Case 40
Indication: Resistance in the left breast.
History: Unremarkable.
Risk profile: Premenopausal breast cancer in a sister.
Age: 47 years.
Clinical Findings
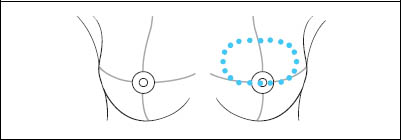
Increased resistance of the upper half of the left breast.
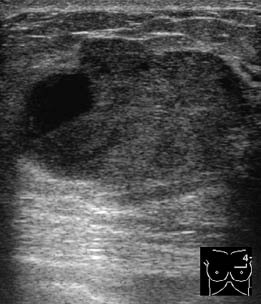
Fig. 40.1 Sonography.
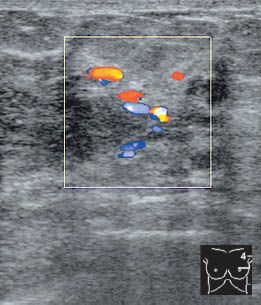
Fig. 40.2 Color-coded Doppler sonography.
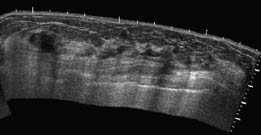
Fig. 40.3 Sonography. Panoramic view of the left breast.
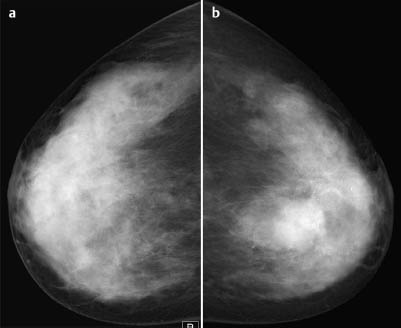
Fig. 40.4a, b Digital mammography, CC view.
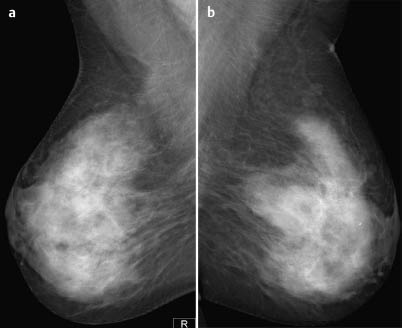
Fig. 40.5a,b Digital mammography, MLO view.
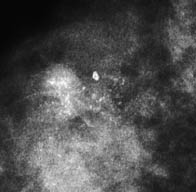
Fig. 40.6 Magnification view of the central region of the right breast.
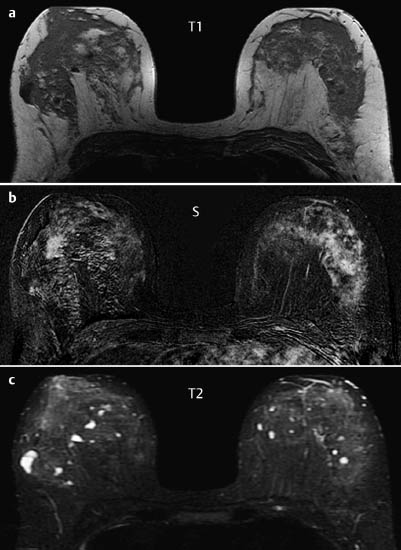
Fig. 40.7a-c Contrast-enhanced MRI of the breasts.
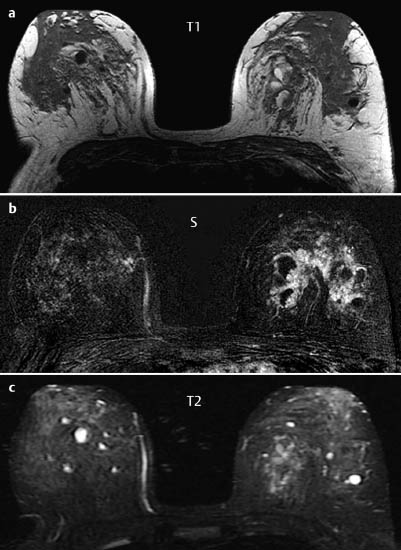
Fig. 40.8a–c Contrast-enhanced MRI of the breasts.
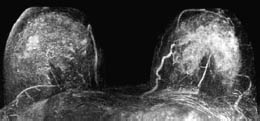
Fig. 40.9 Contrast-enhanced MR mammography. Maximum intensity projection.
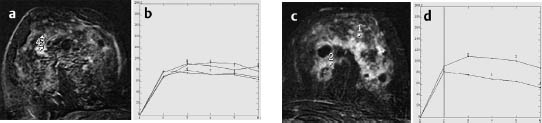
Fig. 40.10a–d Signal-to-time curves of right (a) and left (b) breasts.

|
Please characterize ultrasound, mammography, and MRI findings.
What is your preliminary diagnosis?
What are your next steps? |


