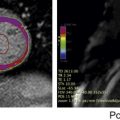
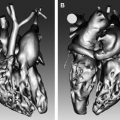
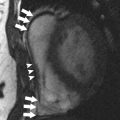
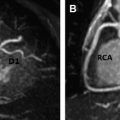
Aortic disease is routinely monitored with anatomic imaging, but until the recent advent of 3-directional phase contrast MRI (4D) flow, blood flow abnormalities have gone undetected. 4D flow measures aortic hemodynamic markers quickly. Qualitative flow visualization has spurred the investigation of new quantitative markers. Flow displacement and wall shear stress can quantify the effects of valve-related aortic flow abnormalities. Markers of turbulent and viscous energy loss approximate the increased energetic burden on the ventricle in disease states. This article discusses magnetic resonance flow imaging and highlights new flow-related markers in the context of aortic valve disease, valve-related aortic disease, and aortic wall disease. Three-directional phase contrast MRI (4D flow MRI) is able to visualize and quantify abnormal flow related to a wide variety of aortic pathologies. Limitations of the technique, including scan time and artifacts, have been greatly reduced making 4D flow a clinically feasible technique. Novel quantitative hemodynamic markers have been developed to characterize abnormal flow, and to investigate underlying mechanisms of disease. Markers beyond aortic diameter could improve risk stratification of patients with aortic disease and better determine the timing of intervention. Larger, prospective studies are needed to validate the clinical relevance of 4D flow. Aortic disease is a broad term that encompasses related and sometimes overlapping conditions associated with substantial morbidity and mortality, including aortic aneurysm and dissection. Imaging has long been used to diagnose and monitor these processes, and along with advances in surgical technique, has markedly improved mortality over the last 50 years. Advances in MRI have led to a more sophisticated understanding of intrinsic and valve-related aortic pathology. These developments not only provide insight into underlying pathophysiology, but also may allow imaging to better predict disease progression and inform the timing of interventions. Hemodynamic imaging with MRI is among the most recent advances in aortic evaluation. The hemodynamic environment of the aorta is unique with extreme pressure variations, high flow rates, and complex flow patterns that exist in both normal and pathologic states. Phase contrast MRI (PC-MRI) has been utilized in routine conventional cardiac MRI for more than 2 decades to accurately measure these flow dynamics. However, the recent optimization of volumetric, time-resolved (cine) and 3-directional PC-MRI (4D Flow), has led to striking visualization of dynamic flow patterns and quantification of associated abnormal hemodynamics. In this article, we briefly review common clinical applications of 2-directional (2D) PC-MRI, and discuss the emerging applications of 4D Flow for the thoracic aorta. We aim to highlight ongoing research in the field of aortic 4D Flow imaging by focusing on promising quantitative hemodynamic markers of aortic disease. Aortic blood flow imaging with MRI is conventionally performed in 2 dimensions (2D). This means that single-directional velocity data is captured with PC-MRI through or parallel to a prescribed imaging plane. In contrast, 4D Flow imaging captures 3-directional (3D) velocity data through a volume on interest. Currently, conventional 2D evaluation is routinely used in several clinical scenarios: aortic valve disease, cardiac shunt lesions and aortic coarctation. Echocardiography is commonly used for assessing aortic valvular disease. However, over the past decade, MRI has become increasingly popular because it provides several distinct advantages, including better evaluation of the ascending aorta, more reproducible measurements of regurgitation fraction, and quantitative measurement left ventricular size, function, and mass. For evaluation of aortic stenosis, transvalvular gradient is a key parameter for determining disease severity and need for intervention. Transvalvular gradient can be estimated with 2D PC-MRI by imaging parallel the aortic centerline, just beyond the valve, to determine peak jet velocity, which can then be used for estimation of the pressure gradient using the modified Bernoulli equation. However, low temporal resolution and suboptimal imaging plane placement can lead to underestimation of true pressure gradients. For aortic regurgitation, measurement of forward and backward flow volume through the ascending aorta can be used to calculate the regurgitant fraction. Conventional 2D PC-MRI can also be used to quantify cardiac shunt fractions and to assess the hemodynamic impact of aortic coarctation. Similar to aortic regurgitation, through plane flow volumes are measured in the aorta and main pulmonary artery, and the shunt ratio or Qp/Qs can be calculated. In the case of coarctation, acquisition planes are placed across the aorta just distal to the coarctation and at the diaphragm to quantify collateral flow through intercostal vessels, which increases with worsening coarctation severity. Multidimensional MRI (eg, 4D Flow) has become an increasingly popular research tool over the past decade. There are several advantages compared with conventional 2D PC sequences: Free breathing, acquisition of 3D velocity data, no need for prospective 2D plane placement, and powerful flow visualization and quantification software. Currently, the main disadvantages of 4D Flow are the need for labor-intensive data after processing, greater susceptibility to motion artifacts, and longer scan times, although scan times have improved dramatically over the last 5 years. 4D Flow datasets are acquired over multiple cardiac cycles: Using electrocardiographic gating, data are collected over many hundreds of heartbeats and then compiled to create a cine image of a complete, representative cardiac cycle. Without the use of scan acceleration techniques, datasets can take 1 hour to fully acquire, a prohibitively long time for routine applications. When clinical patients are considered, rather than a population of healthy research volunteers, scan time becomes a dominant concern. A significant amount of research effort has been dedicated to reducing 4D Flow scan times, with promising results reported using spiral (rather than conventional Cartesian) acquisitions and data undersampling techniques for acceleration, including compressed sensing. Many studies report scan times of less than 15 minutes, with some groups acquiring data in as few as 5 minutes. Data errors with PC-MRI acquisitions have been reported, but can be minimized by routine correction of eddy currents, gradient fields, and Maxwell phase effects. Data fidelity is an important consideration because 4D Flow data are subject to multiple artifacts. In addition to the technical issues listed, there are other sources of error related to acquisitions spanning numerous heart beats and the presence of underlying pathologic flow characteristics (eg, turbulence, helicity). Confirmation of 4D Flow data fidelity has largely relied on in vitro, in silico, and animal models. One in vivo approach for data verification relies on the pathline technique of flow visualization. Pathlines tend to be sensitive to artifact accumulation, because they are calculated by integration over time. Applying conservation-of-mass principles in a specific region of interest, pathlines can be used for data quality verification. Another metric for internal data quality control relies in measurement of aortic ( Qs ) and pulmonary ( Qp ) flow rates, which should be equal in the absence of shunts, and can help in the identification of erroneous data. Of note, several important flow parameters are relative to other internal measurements (eg, Qp / Qs , collateral flow, flow displacement) so that the absolute values of the velocity data are less important than relative internal consistency. Several approaches can be used for 4D Flow data visualization, including vector plots and particle traces (ie, streamlines and pathlines), which are typically color coded for velocity data. Whereas a vector plot represents the actual velocity data at a given moment in time, streamlines are imaginary lines that smoothly connect together these vectors for a depiction of an instantaneous flow field. They are visually appealing, but do not represent actual blood flow because they only reflect 1 time point. Pathlines, on the other hand, do represent blood flow through time. They are calculated by releasing imaginary particles into the flow field and then using the dataset to determine where particles will travel in an iterative process through the cardiac cycle. Despite the need for time-intensive post processing, these visualization methods have shown promise for several potential clinical applications, including investigation of valve-related abnormal flow patterns, blood compartmentalization in the ventricles, intimal entry tears and flow patterns in chronic dissection, corrected postrepair flow patterns, and identification of embolic pathways. Dynamic flow visualization is an obvious appeal of 4D Flow. It affords an intuitive representation of flow and a qualitative assessment of abnormal flow patterns. Quantitative markers, however, can be derived from 4D Flow datasets to more precisely characterize the hemodynamic consequences of pathologic flow disturbances. Although the true clinical utility of aortic 4D Flow remains to be determined, the ability to measure a diverse set of novel hemodynamic markers is likely to be its most clinically applicable feature. Clinical guidelines for the management of aortic disease use maximal diameter to risk stratify patients and to set thresholds for operative intervention. Aortic dissection and increased mortality, however, are reported with normal-sized and mildly dilated aortas. The topic of disease progression and aortic diameter is particularly problematic for patients with bicuspid aortic valves (BAV), with marked variability in management reported in routine surgical practice. Markers beyond aortic dimension that reflect the degree of an individual’s risk would be useful to better anticipate disease progression and complication. Herein we review promising new flow-related markers in 3 general contexts: Aortic valve disease, valve-related aortic disease, and aortic wall disease. Flow assessment has long been central to the clinical evaluation of the aortic valve. Three main flow-derived parameters are currently measured to determine the severity of aortic stenosis and guide surgical intervention: Transvalvular gradient, valve area, and peak velocity. Although these measurements generally perform well as markers of aortic disease severity, they are not always accurate. For example, gradient estimates using the modified Bernoulli equation do not take into account pressure recovery, and severe aortic stenosis with a low ejection fraction can have low gradients (ie, low-flow/low-gradient severe aortic stenosis). A more accurate composite measurement of the increased overall ventricular workload, “valvuloarterial impedance,” has been developed, and takes into account the degree of valve obstruction, the ventricular response, and the systemic vascular impedance. Valvuloarterial impedance may better represent the pathologic burden placed on the left ventricle that leads to overload and failure. 4D Flow affords a complimentary means of calculating the overall ventricular workload experienced with aortic stenosis. Energy loss can be directly assessed with the technique by 2 recently described methods: Estimation of vicious energy loss and turbulent kinetic energy. Viscous dissipation of energy is a normal feature of aortic flow. For normal laminar flow, it is caused by friction between adjacent fluid layers with different velocities. This friction increases with the abnormal flow features that are seen with aortic valve disease, resulting in substantially elevated viscous energy losses ( Fig. 1 ). A limitation of measuring viscous energy loss, however, is that it does not take into account turbulence.
Key points
Overview of aortic imaging
Current clinical 2-directional flow applications
4-Directional flow
Data Acquisition, Reconstruction, and Fidelity
Flow Visualization
Quantitative hemodynamic markers
Aortic Valve Disease


