Case 50
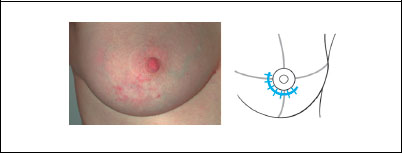
Indication: Cutaneous changes in lower outer quadrant of the right breast.
History: Excisional biopsy of bilateral fibroadenomas 7 years previously
Risk profile: Breast cancer in mother and grandmother.
Age: 50 years.
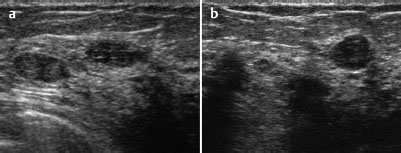
Fig. 50.1 a,b Ultrasound of the left breast, lower outer quadrant.
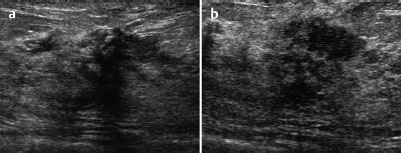
Fig. 50.2a, b Ultrasound of the right breast, lower outer quadrant.
Palpation
Nodular parenchymal texture. No circumscribed resistance.
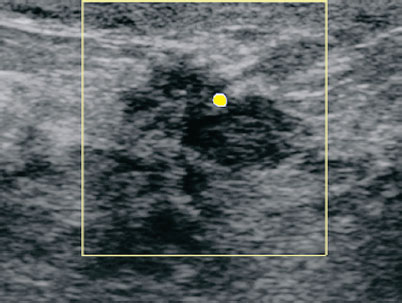
Fig. 50.3 Color-coded Doppler sonography of the right breast, outer quadrants.
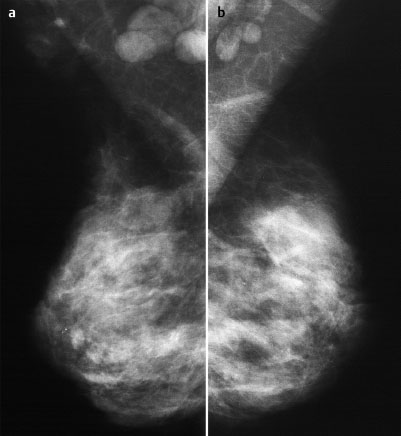
Fig. 50.4a,b Conventional mammography, MLO view [imaging not performed by authors].
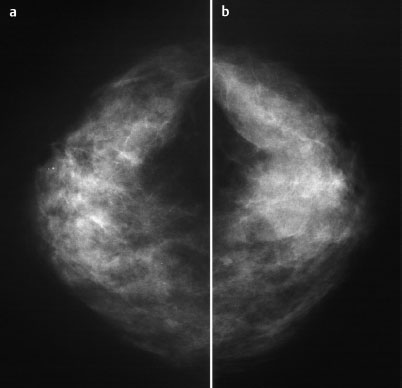
Fig. 50.5a,b Conventional mammography, CC view [imaging not performed by authors].
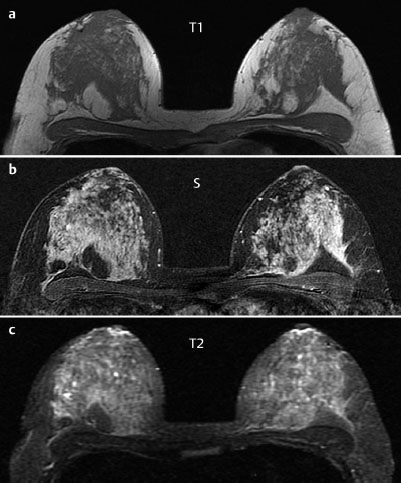
Fig. 50.6a–c Contrast-enhanced MR mammography.
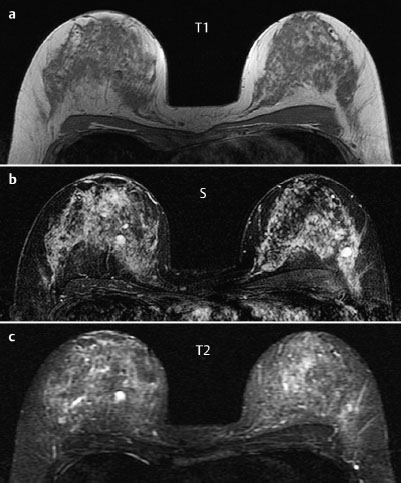
Fig. 50.7a–c Contrast-enhanced MR mammography.
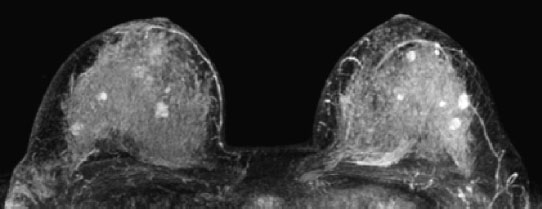
Fig. 50.8 Contrast-enhanced MR mammography. Maximum intensity projection.
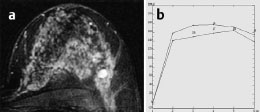
Fig. 50.9a,b Signal-to-time curves.
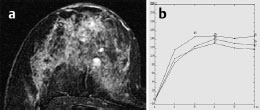
Fig. 50.10a,b Signal-to-time curves.

|
Please characterize ultrasound, mammography, and MRI findings.
What is your preliminary diagnosis?
What are your next steps?
|


