Case 60
Indication:. Suspicious ultrasound findings in the left breast in examination performed elsewhere.
History: Unremarkable.
Risk profile: No increased risk.
Age: 38 years.
Clinical Findings
Normal.
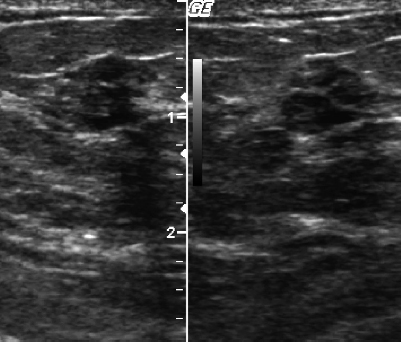
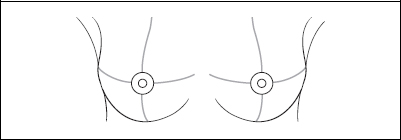
Fig. 60.1 Ultrasound images from the center of the left breast.
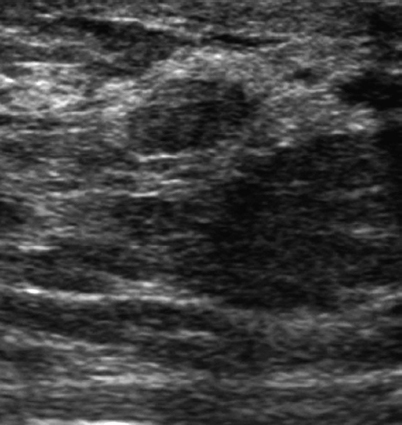
Fig. 60.2 Ultrasound image from between the lower quadrants of the left breast.
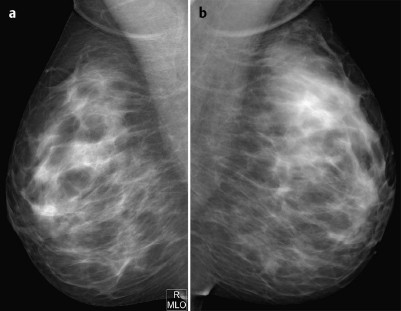
Fig. 60.3a,b Digital mammography, MLO view.
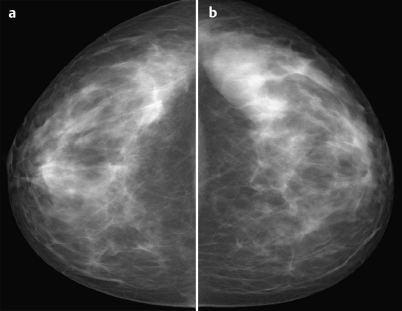
Fig. 60.4a,b Digital mammography, CC view.
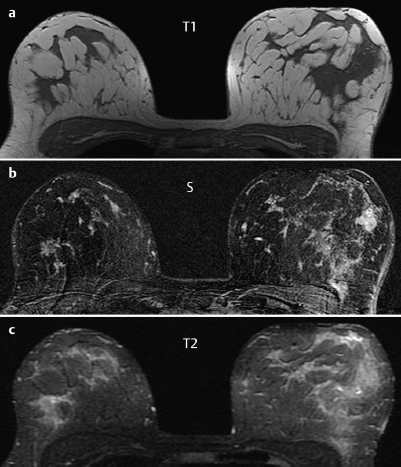
Fig. 60.5a–c Contrast-enhanced MR mammography in fourth week of menstrual cycle.
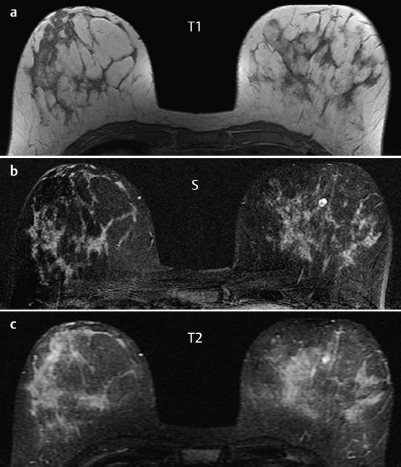
Fig. 60.6a–c Contrast-enhanced MR mammography in fourth week Of menstrual cycle.
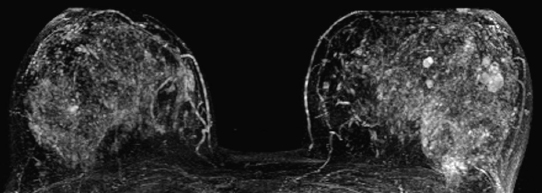
Fig. 60.7 Contrast-enhanced MR mammography. Maximum intensity projection.
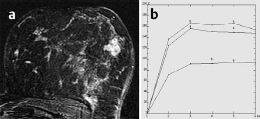
Fig. 60.8a,b Signal-to-time curves.
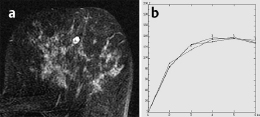
Fig. 60.9a,b Signal-to-time curves.

|
Please characterize ultrasound, mammography, and MRI findings.
What is your preliminary diagnosis?
What are your next steps? |


