Case 61
Indication: Screening.
History: Unremarkable.
Risk profile: No increased risk.
Age: 65 years.
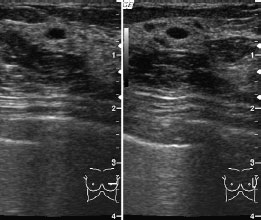
Fig. 61.1 Ultrasound of the center of the left breast.
Clinical Findings
normal.
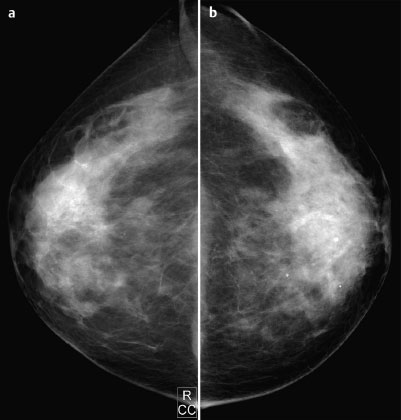
Fig. 61.2 a,b Digital mammography, CC view.
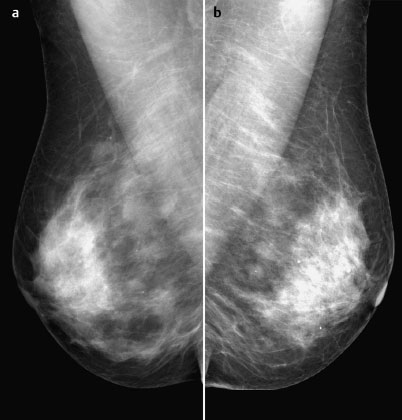
Fig. 61.3 a,b Digital mammography, MLO view.
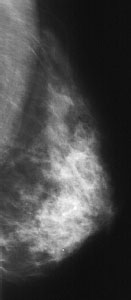
Fig. 61.4 Conventional mammography two years earlier, MLO view [imaging not performed by authors].
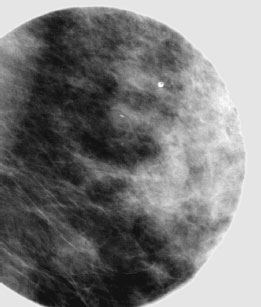
Fig. 61.5 Spot compression of the left breast, MLO view.
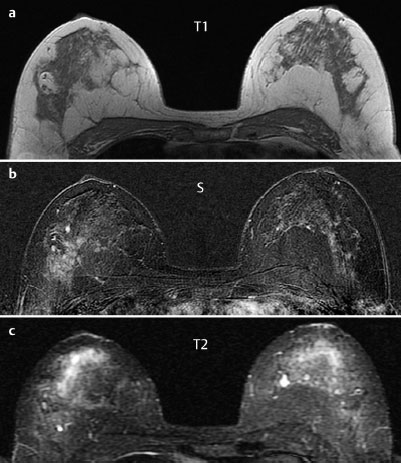
Fig. 61.6 a-c Contrast-enhanced MRI of the breasts.
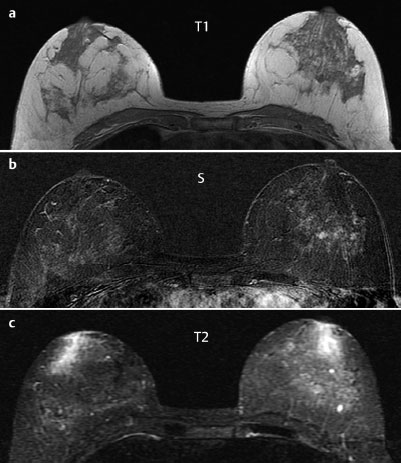
Fig. 61.7a–c Contrast-enhanced MRI of the breasts.
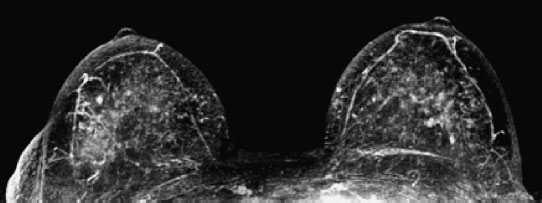
Fig. 61.8 Contrast-enhanced MR mammography. Maximum intensity projection.
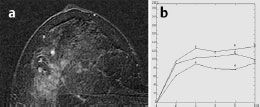
Fig. 61.9 a,b Signal-to-time curves, right breast.
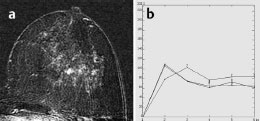
Fig. 61.10 a,b Signal-to-time curve, left breast.

|
Please characterize ultrasound, mammography, and MRI findings.
What is your preliminary diagnosis?
What are your next steps? |


