Case 68
Indication: Sonographically suspicious lesion in the left breast discovered in screening performed elsewhere.
History: Unremarkable.
Risk profile: No increased risk.
Age: 76 years.
Clinical Findings
No findings.
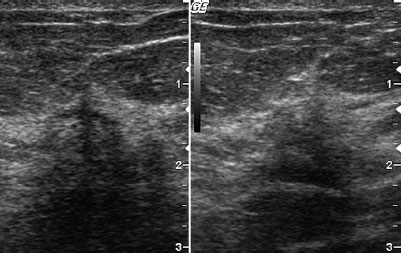
Fig. 68.1 Ultrasound between the outer quadrants of the left breast.
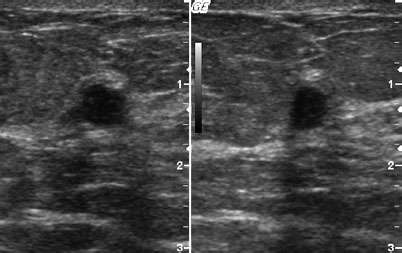
Fig. 68.2 Ultrasound between the inner quadrants of the left breast.
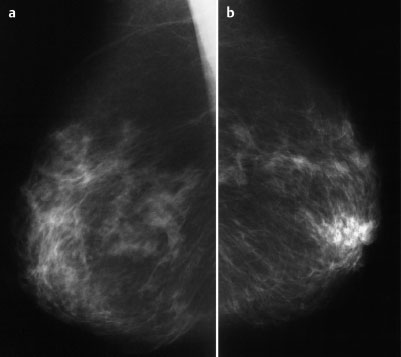
Fig. 68.3 a,b Conventional mammography, ML view [imaging not performed by authors].
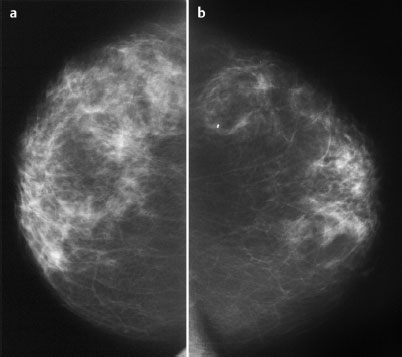
Fig. 68.4 a,b Conventional mammography, CC view [imaging not performed by authors].
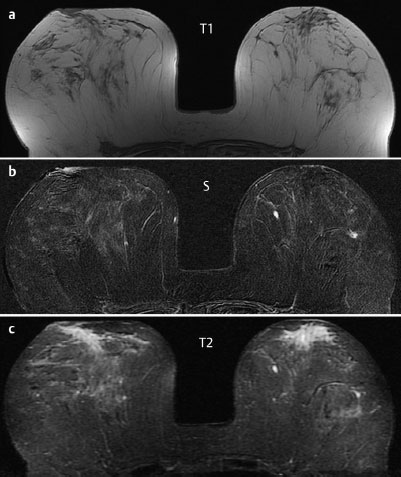
Fig. 68.5 a-c Contrast-enhanced MRI of the breasts.
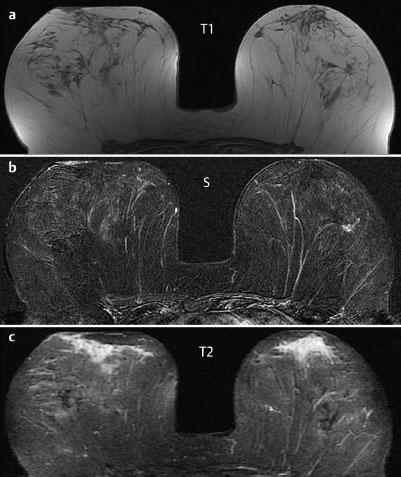
Fig. 68.6 a-c Contrast-enhanced MRI of the breasts.
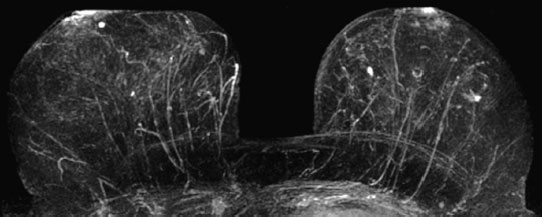
Fig. 68.7 Contrast-enhanced MR mammography. Maximum intensity projection.
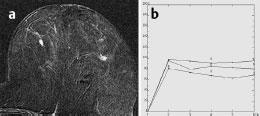
Fig. 68.8 a,b Signal-to-time curves, finding between outer quadrants.
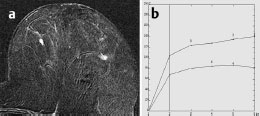
Fig. 68.9 a,b Signal-to-time curves, finding between inner quadrants.

|
Please characterize ultrasound, mammography, and MRI findings.
What is your preliminary diagnosis?
What are your next steps? |


