Abstract
Prostate cancer (PCa) poses a significant threat to men’s health, with early diagnosis being crucial for improving prognosis and reducing mortality rates. Transrectal ultrasound (TRUS) plays a vital role in the diagnosis and image-guided intervention of PCa. To facilitate physicians with more accurate and efficient computer-assisted diagnosis and interventions, many image processing algorithms in TRUS have been proposed and achieved state-of-the-art performance in several tasks, including prostate gland segmentation, prostate image registration, PCa classification and detection and interventional needle detection. The rapid development of these algorithms over the past 2 decades necessitates a comprehensive summary. As a consequence, this survey provides a narrative review of this field, outlining the evolution of image processing methods in the context of TRUS image analysis and meanwhile highlighting their relevant contributions. Furthermore, this survey discusses current challenges and suggests future research directions to possibly advance this field further.
Introduction
Prostate cancer (PCa) is a malignant disease of the prostate gland. According to [ , ], in 2022, the number of patients with PCa ranked second among male cancer patients worldwide, accounting for 14.2%, and the number of deaths from PCa ranked fifth among male cancer patients, accounting for 7.3%. Early diagnosis and treatment is the crucial key to the cure of progressive PCa. If this cannot be carried out effectively, PCa can invade nearby tissues and spread to other parts of the body, such as bones, seminal vesicles and the rectum [ ]. Such spread not only severely affects the patient’s quality of life but also increases the risk of death. The prevalence of subclinical and undiagnosed PCa is high among elderly men, and the incidence of asymptomatic PCa is also significant. Approximately one-half of patients with low-risk PCa (Gleason score of ≤6/Grade Group 1) ultimately require active treatment. For low-risk PCa, more active monitoring is an effective approach [ ]. Therefore, early diagnosis of PCa is crucial for improving the treatment success rate and reducing mortality.
The diagnostic procedure for PCa requires the comprehensive use of various detection tools to ensure accuracy. First, digital rectal examination is a traditional method for preliminary assessment of the prostate condition, where the size, shape and texture of the prostate are checked through rectal palpation [ ]. Second, prostate-specific antigen (PSA) blood testing is an important screening tool that assesses the risk of prostate disease by measuring the level of PSA in the blood, despite the possibility of its elevation owing to non-cancerous reasons [ ]. Additionally, imaging examinations, including ultrasound examination, computed tomography (CT) scans and magnetic resonance imaging (MRI), provide physicians with more detailed views of the prostate structure [ ], with multi-parametric MRI offering higher resolution images that help to locate tumors more accurately. Ultimately, prostate biopsy is a key step in confirming PCa, determining the nature of the tumor through pathological analysis. However, early cancerous lesions are often small and difficult to accurately locate and obtain sufficient samples in one biopsy, usually requiring multiple attempts. Multiple biopsies not only increase patient discomfort but can also lead to complications such as prostatitis or urinary tract infections [ ]. To reduce this over-diagnosis phenomenon, additional imaging guidance for targeted prostate biopsy is essential [ ], such as MRI and ultrasound examination.
Transrectal ultrasound (TRUS)–guided prostate biopsy is the standard method for the diagnosis of PCa, which is widely used in clinical practice [ ]. TRUS scans the prostate through the rectal wall, generating images of the prostate, including B-mode, micro-ultrasound (micro-US), color Doppler ultrasound examination, contrast-enhanced ultrasound (CEUS) examination, 3-D imaging and elastography, to meet various clinical needs. The real-time B-mode provides two-dimensional images commonly used for the diagnosis of benign prostate hyperplasia and prostatitis and intraoperative guidance. Although 3-D TRUS generates comprehensive 3-D volumetric information that is particularly important for preoperative planning. Furthermore, micro-US operates at a higher frequency than conventional ultrasound, providing higher-resolution imaging. However, this technology is not yet widely available, and there is limited imaging processing research related to it. CEUS and color Doppler ultrasound examination are used to identify suspicious regions based on the assumption that microvascular density increases in PCa owing to its association with angiogenesis. These imaging techniques can easily detect areas with dense blood vessels, assisting clinicians in quickly identifying suspicious vascular regions [ ]. Elastography, in contrast, relies on the assumption that PCa regions tend to exhibit increased stiffness, often owing to higher cell density, which reduces tissue elasticity. These stiffened areas can be detected by strain elastography or shear wave elastography (SWE), enabling clinicians to locate potential regions of concern based on increased tissue hardness. However, using these two modalities alone to localize PCa can lead to false positives. Prostatitis and benign prostate hyperplasia can also cause increased vascularization, and benign nodules and prostate fibrosis can result in tissue stiffening. Therefore, it is essential for clinicians to integrate information from multiple modalities to localize PCa accurately [ ].
Here are several key clinical tasks where TRUS is needed as an imaging tool for the diagnosis and treatment of PCa.
PCa classification and detection
TRUS can help physicians identify different types of PCa, including localized and invasive PCa. Through TRUS images, physicians can roughly assess the size, location and invasion of tumors into surrounding tissues.
Prostate gland segmentation
Accurate prostate boundary delineation from TRUS images can provide the target area for interventions, which facilitates physicians with effective treatment planning, biopsy needle placement and brachytherapy.
Image guidance for prostate intervention
TRUS is the routine imaging tool for image-guided biopsy and therapy of PCa, owing to its real-time advantage. Moreover, other preoperative imaging modalities such as MRI can be registered/fused with TRUS to provide more comprehensive visual information, thereby improving the efficacy of the intervention.
Intraoperative needle localization
During the procedure of biopsy, brachytherapy, cryotherapy and so on, TRUS is used to monitor the position of the biopsy or treatment needle, ensuring the accuracy and safety of the intervention.
Although TRUS has been widely used for the imaging of the prostate, there are still limitations in practical applications. The image quality may be degraded by speckle noise and shadow, leading to blurred details and artifacts. Especially in the apex and base regions of the prostate, the gland’s contour in TRUS is often unclear, increasing the complexity of diagnosis. In addition, the interpretation of TRUS depends on the experience and skill of the physicians, leading to subjectivity. Moreover, the modalities and dimensions of TRUS are various, making it difficult for physicians to quickly obtain potentially useful information during diagnosis and treatment. Therefore, applying image processing technology to analyze TRUS is with clinical significance.
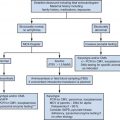
The development of image processing technology has greatly promoted the progress of the medical imaging field [ ], especially playing an important role in computer-assisted diagnosis and computer-assisted intervention. With the help of advanced image processing methods, it is beneficial for physicians to make more accurate and efficient clinical decisions. In the field of TRUS image processing, lots of relevant methods have been developed and applied in different tasks, mainly including prostate gland segmentation, prostate image registration, PCa classification and detection and interventional needle detection, as illustrated in Figure 1 .

This survey summarizes the related image processing methods in TRUS over the past 20 years, including gland segmentation, image registration, PCa classification and detection and interventional needle detection. We classify and summarize these methods according to modality, dimension and technical route, presenting the similarities and differences of these methods. We also list the primary evaluation metrics for different tasks, as well as the results of representative methods under their datasets and metrics, making a rough comparison of different methods. Finally, we also summarize these methods to propose current challenges faced by each task and possible future research directions.
The organization of this survey is as follows. In the Task Definition section, we define each task of TRUS image processing and list the definitions and formulas of their primary evaluation metrics. The Method Overview section is the main part of this survey, where we review and summarize the methods of prostate gland segmentation, prostate image registration, PCa classification and detection and needle detection in the Prostate Gland Segmentation section, Prostate Image Registration section, Prostate Cancer Classification and Detection section and Needle Detection section, respectively. In the Discussion and Future Research Directions section, we discuss and analyze existing challenges and suggest future research directions for these four tasks. A summary of the entire survey is provided in the Summary.
Task Definition
Prostate Gland Segmentation
Image segmentation is one of the most common tasks in the field of medical image processing. The purpose of prostate segmentation is to accurately obtain the contour/region of the prostate gland (see Fig. 1 a). Prostate segmentation plays a crucial role in different stages of the clinical decision-making process. For example, prostate volume, which can be directly determined through prostate segmentation, aids in the diagnosis of benign prostate hyperplasia. Moreover, the boundary information of the prostate is important and useful in various treatment scenarios, such as prostate brachytherapy, high-intensity focused ultrasound therapy, cryotherapy and transurethral microwave therapy. In addition, prostate segmentation also facilitates other image processing tasks, such as surface-based multi-modality image registration. To achieve prostate segmentation, lots of shape-/region-based methods, as well as conventional machine learning methods and advanced deep learning (DL) methods, have been developed. We classify and summarize these segmentation methods in the Prostate Gland Segmentation section, according to TRUS modality, dimension and technical route.
Evaluation Metrics
The evaluation of segmentation accuracy can be divided into qualitative and quantitative evaluations. For qualitative evaluation, the resulting contours are visually compared to the ground truth. For quantitative evaluation, the numerical calculation involves measuring the similarity between the obtained contours and the ground truth. The commonly used quantitative evaluation metrics consist of region-based metrics, boundary-based metrics and classification-based metrics. Because traditional segmentation methods often rely on contour constraints, they always use boundary-based metrics for the evaluation. In contrast, recent DL methods usually use region-based metrics.
The Dice similarity coefficient (DSC) is currently the most popular region-based evaluation metric for the segmentation task, which measures the overlap between the segmented result and the ground truth:
DSC=2×TPFP+FN+2×TP,
Intersection over union (IoU) is another commonly used region-based metric, also known as the Jaccard coefficient. It is defined as follows:
IoU=Jaccard=TPTP+FP+FN.
Larger values of DSC and IoU indicate better segmentation accuracy.
As for the boundary-based metrics, mean surface distance (MSD), mean absolute distance (MAD) and average symmetric surface distance (ASD) are often used to measure the similarity between the segmented boundary (in 2-D)/surface (in 3-D) and the ground truth:
MSD=1N∑i=1Ndi,
MAD=1N∑i=1N|di|,
ASD=1N∑i=1N(|di|+|di′|),
d ′ i
represents the shortest distance from the i -th point on the segmentation result to the ground truth and d i represents the shortest distance from the i -th point on the ground truth to the segmentation result. It can be seen that MSD, MAD and ASD measures the average distance, mean absolute distance and average symmetric distance, respectively.
In contrast with the MSD, MAD and ASD, the maximum distance (MAXD) and Hausdorff distance (HD) are used to represent the dissimilarity between the segmented boundary/surface and the ground truth:
MAXD=max|di|,
HD=max(max|di|,max|d′i|).
The MAXD measures the maximum distance between each point from the segmentation result and its corresponding point from the ground truth. The HD measures the maximum distance between the segmentation result and ground truth, and with 95HD denoting the 95th percentile of HD. For all aforementioned boundary-based metrics, smaller values denotes better segmentation accuracy.
In addition to region- and boundary-based metrics, point-wise classification-based metrics can also be applied to measure segmentation accuracy. Accuracy represents the proportion of correctly predicted pixels to the total number of pixels in the segmentation result:
ACC=TP+TNTP+TN+FP+FN,
Sensitivity=Recall=TPTP+FN.
Precision indicates the proportion of all predicted positive pixels that are TP pixels:
Precision=TPTP+FP.
There is usually a trade-off between precision and sensitivity. Specificity is the proportion of all negative pixels that are correctly segmented as true negative:
Specificity=TNTN+FP.
Larger values of these classification-based metrics indicate better segmentation.
Prostate Image Registration
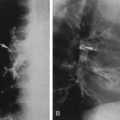
Image registration is the process of aligning two or more images acquired at varying times or viewpoints or by different sensors. Taking registering a pair of images as an example, one is denoted as fixed image and the other as a moving image. The objective is to estimate the optimal deformation field between the fixed and moving images; thus, the warped moving image can be matched with the fixed image, enabling the alignment of the regions of interest. Prostate image registration plays a crucial role in assisting surgeons during preoperative planning and intraoperative surgery, with TRUS being a frequently used modality in this context. Its purpose is to provide surgeons with more complementary and valuable information. This task often involves analyzing multi-modality images (e.g., MR to TRUS) (see Fig. 1 b), and thus remaining challenging in clinical practice. We classify and summarize relevant registration methods in the Prostate Image Registration section, according to modality, dimension, deformation type and technical route.
Evaluation Metrics
Considering the purpose of image registration, the numerical evaluation metrics are mainly aimed at quantifying the similarity of corresponding regions between the fixed image and the warped moving image. Therefore, the metrics like DSC, HD, MAD and MAXD can also be used to evaluate the registration performance, by calculating the overlap of corresponding regions or the distance of corresponding boundaries pr surfaces.
Target registration error (TRE) is one of the most commonly used metrics in medical image registration. It involves measuring the Euclidean distance of the manually identified corresponding landmarks in the fixed and moving images:
TRE=1N∑i=1N∥LIfi,LImi∘ϕ∥2,
Surface registration error (SRE) has a similar computing method with TRE, but the difference is SRE measures the similarity of surface points between fixed and moving images:
SRE=1N∑i=1N∥SIfi,SImi∘ϕ∥2,
In addition to assessing registration accuracy using these metrics, some studies also evaluate the quality of the estimated deformation field ϕ . The Jacobian matrix J ϕ ( p ) = ∇ ϕ ( p ) evaluates the regularity of the deformation field by capturing the local gradient of ϕ around pixel p . A smaller value of the percentage of pixels with non-positive Jacobian determinant (% | J ϕ | ≤ 0) indicates a smoother ϕ .
PCa Classification and Detection
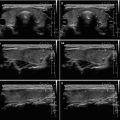
Early and accurate diagnosis, along with precise staging, effectively improves the success rate of treatment. The standard method for diagnosing and grading PCa is the histopathological analysis of prostate tissue samples, typically obtained via TRUS-guided biopsy. Consequently, the accurate identification of target lesions during the biopsy procedure has been a longstanding and active research task. To better support TRUS-guided targeted biopsies, automated detection methods have been developed to predict PCa based on TRUS images ( Fig. 1 c). Most of these methods approach cancer detection as a classification problem, where small regions of interest or whole images are categorized as benign or malignant. We classify and introduce these methods in the Prostate Cancer Classification and Detection section, according to TRUS modality and technical route.
Evaluation Metrics
The evaluation metrics for classification task mainly include area under the receiver operating characteristic curve, accuracy ( 8 ), sensitivity ( 9 ), specificity ( 11 ), precision ( 10 ) and F-score.
The area under the receiver operating characteristic curve is a measure of the diagnostic ability of a binary classifier, which computes the area under the receiver operating characteristic curve. The receiver operating characteristic curve is a curve drawn with the true-positive rate (namely, sensitivity) as the y axis and the false-positive rate (namely, specificity) as the x axis. The area under receiver operating characteristic curve can be calculated as:
AUC=∫01TPR(fpr)dfpr.
It represents the probability that a randomly chosen positive instance is ranked higher than a randomly chosen negative instance.
The F-score is a weighted harmonic mean of precision and recall:
F−score=2×Precision×RecallPrecision+Recall.
Needle Detection
Prostate needles are primarily used during surgical procedures for various purposes, including biopsy, brachytherapy, high-intensity focused ultrasound therapy, cryotherapy and so on. Automated detection and segmentation of interventional needles are crucial in surgical settings because this ensures precise localization and safe interventions, as illustrated in Figure 1 d. We summarize needle detection methods in the Needle Detection section, according to clinical scenario and technical route.
Evaluation Metrics
The numerical metrics for evaluating the needle detection and segmentation mainly include shaft error and tip error. Shaft error measures the deviation between the predicted and actual axes of the needle, usually expressed in terms of distance or angle:
Eshaftdistance=1N∑i=1N∥oi,o^i∥2,
Eshaftangle=arccos(v·v^∥v∥∥v^∥),
Related posts:
 Other Important Issues: Training Challenges, Certification, Credentialing and Billing and Coding for Services
 Methods of Examination, Techniques, and Anatomy of the Chest
 Drainage of Articular Ganglia Around the Ankle
 Subacute Granulomatous Thyroiditis: de Quervain’s Diseases
 Evaluation of Hydrops Fetalis
 How to Inject Chemotherapeutic Agents
Stay updated, free articles. Join our Telegram channel

Full access? Get Clinical Tree


