A Primer in Compartment Modeling
Cyrill Burger
Alfred Buck
The information contained in nuclear medicine images represents the average concentration of the tracer compound in tissue during the acquisition of the emission counts. If all distortions such as photon scatter or attenuation have been corrected for during image reconstruction, this concentration is quantitative in the sense that the amount of tracer per tissue volume is known. However, in most cases, tracer concentration cannot be directly transformed into a quantitative tissue parameter such as perfusion in milliliters per minute per 100 mL of tissue or receptor concentration in picomoles per milliliter. Prerequisites for absolute quantification are a suitable tracer, an optimized acquisition protocol, and an adequate data analysis procedure. Often compartment models are used to describe processes mathematically in living systems, including tracer uptake and metabolism (see Fig. 13.3). Different forms or spaces of tracer are distinguished (the “compartments”) between which material is continuously exchanged.
A classic example is the one-tissue compartment model that actually has two compartments: tracer in blood plasma and tracer in tissue. Exchange between these compartments occurs by tracer extraction into tissue, a perfusion- and endothelium-related process, and some backflux from tissue. Quantification then consists of adjusting the model parameters so that the tissue concentration predicted by the model based on the measured tracer concentration in arterial plasma optimally matches the tracer concentration in a tissue structure measured at different times during tracer uptake. The one-tissue compartment model can be refined by differentiating between distinct forms of tracer in tissue (free, nonspecifically bound, specifically bound). Although refined models are better able to describe the complex physiology, they require more unknown material transfers. More unknowns in matching a model to measured data of limited quality in general reduce the reliability of the results. The “art” of compartment modeling, therefore, is to find a model with the least number of parameters and the best information about significant tissue parameters.
Introduction
Imaging in nuclear medicine is based on the application of radioactively labeled compounds (tracers) that are distributed throughout the body by the vascular system and take part in physiologic processes according to the properties of the tracer molecule. Each tracer is designed to assess a specific property of tissue (e.g., perfusion, metabolic turnover, or the concentration of a specific receptor). To obtain optimal images, a protocol defines how the tracer is administered and at what timepoints single images or a sequence of images is acquired. The information contained in the images represents the average tracer concentration during the image acquisition, and in most cases it cannot be directly transformed into a quantitative parameter of the target process. For instance, “perfusion-weighted” images cannot be translated directly into images representing tissue perfusion in milliliters per minute per 100 mL of tissue.
Although functionally weighted images bear valuable diagnostic information, some situations require absolute quantification, such as therapy monitoring and group comparisons. Hence there is an interest in using nuclear medicine techniques for the quantitative assessment of tissue parameters not only for the scientific evaluation of tracer characteristics but also for clinical purposes.
Although functionally weighted images bear valuable diagnostic information, some situations require absolute quantification, such as therapy monitoring and group comparisons. Hence there is an interest in using nuclear medicine techniques for the quantitative assessment of tissue parameters not only for the scientific evaluation of tracer characteristics but also for clinical purposes.
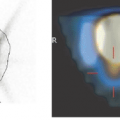
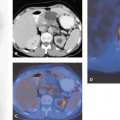
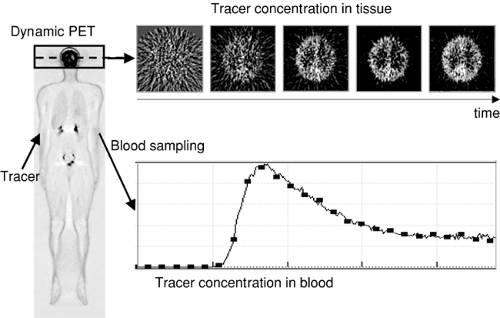 Figure 13.1 PET acquisition setup for quantitative imaging. A series of dynamic images is acquired to observe the tracer distribution processes. Additionally, the tracer concentration in plasma is assessed by withdrawing blood samples throughout the scanning period. |
The transformation of the measured data into absolute metabolic parameters is based on physiologic models, often compartment models. Hereby the relevant transport and uptake parameters are mathematically modeled and a prescription derived that predicts the tracer concentration in tissue given a measured plasma concentration. Quantification of the measurement then consists of solving the following inverse problem: Which model parameters predict the measured tissue concentration most closely? It must be possible to find a model that adequately describes the processes with a small number of parameters. Otherwise, with too many parameters in the model, there is a high chance that different parameter combinations will result in approximately the same predicted tissue response, and an optimization algorithm will then have difficulty finding a definite optimal solution. Whether such a model—one that is considerably simplified with respect to the underlying physiology—still provides valuable information is a question that must be answered for each tracer individually.
Compartment modeling has the following requirements:
A tracer with favorable properties regarding distribution and uptake dynamics;
Sampling of the tracer concentration in blood plasma (input curve) from the time of tracer administration until the end of image acquisition;
Observation of the dynamic tracer distribution in tissue by a series of image acquisitions (Fig. 13.1); and
Appropriate correction of the image information (e.g., attenuation correction) and conversion into absolute tracer concentration in becquerels per milliliter (as a result of which the time course of the tracer activity concentration [TAC, tissue time–activity curve] is available in each image pixel).
Compartment Models
To describe a physiologic system, it is often helpful to decompose it into a number of interacting subsystems, called compartments. Each compartment represents a homogeneous distribution of material and may exchange material with other compartments. Note that compartments
should be understood not as a physical volume but rather as a mass of well-mixed material that behaves uniformly. Examples of frequently used compartments include these:
should be understood not as a physical volume but rather as a mass of well-mixed material that behaves uniformly. Examples of frequently used compartments include these:
Tracer in the arterial plasma that can be extracted into the tissue;
Free tracer in tissue that can be bound or that may diffuse back into the blood;
Tracer in tissue that has been nonspecifically bound to other than the targeted cell components; and
Tracer in tissue that has been specifically bound, for instance, at the target receptor site.
Compartment models are visualized by diagrams in which the rectangles symbolize compartments and the arrows represent material exchange, as illustrated in Figure 13.2. Although the mechanisms of material transport may be diverse, models that can be reasonably analyzed with standard mathematical methods assume first-order processes. As a consequence, the change of tracer concentration in one of the compartments is a linear function of the concentrations in all other compartments. Put into mathematical terms,
It is assumed that the observed system is not disturbed by the administration of the tracer. Because of the tiny amounts of tracer material applied in nuclear medicine investigations, this assumption is highly justified in most cases.
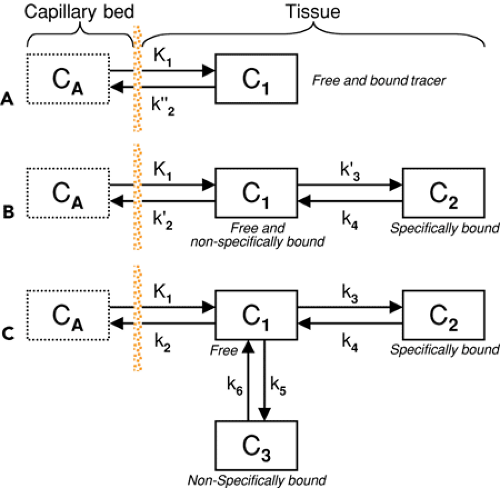 Figure 13.2 Three different configurations of compartment models. A: One-tissue compartment model. B: Two-tissue compartment model. C: Three-tissue compartment model. The Ci indicates the tracer concentrations in the compartments, and the ki the transfer coefficients of the material exchange between them. |
To illustrate the properties of compartment models, let us consider a tracer that is not freely diffusible and is injected intravenously as a bolus. When the tracer arrives at the heart, it is well mixed with blood and distributed by the arterial circulation. It finally arrives at the capillary bed, where exchange with the tissue can take place. Nonextracted tracer is transported back to the heart, from which a new circulation starts. This highly simplified “physiologic” model can be translated into a one-tissue compartment model, as illustrated in Figure 13.2A. It is assumed that, because of mixing, the arterial tracer concentration is the same throughout the body, so it can be measured in a peripheral artery. The tracer concentration in tissue increases by the extraction of tracer from the blood plasma, and as this is described by a first-order process, the transfer of material is proportional to the concentration in plasma CA(t). Conversely, it is reduced by a backward transfer, which is proportional to the concentration in tissue C1(t). Both processes compete, so the change over time of the net tracer concentration in tissue (dC1(t)/dt) can be expressed by the following differential equation:
The two transfer coefficients, K1 and k″2, have a somewhat different meaning, indicated by using capital and small letters. K1 includes a perfusion-dependent component and has units of milliliter per minute per milliliter of tissue, whereas k″2 [min-1] indicates the fraction of mass transferred per unit of time. For example, if k″2 equals 0.1[min-1], the material leaves the compartment at a rate of 10% per minute. The plasma concentration CA(t) is not modeled but is considered a measured quantity and appears as the input curve driving the system.
By solving differential equation (2), the following equation for the concentration of tracer in tissue can be derived:
Related posts:
 11C-Based PET- Radiopharmaceuticals of Clinical Value
 Brain Tumors: Astrocytoma, Oligodendroglioma, and Glioblastoma Images with PET and SPECT
 Sentinel Node Imaging in Head and Neck Tumors
 PET-CT and SPECT-CT of Bone Metastases
 SPECT and PET in Benign Thyroid and Parathyroid Disease
Stay updated, free articles. Join our Telegram channel

Full access? Get Clinical Tree


