Basic Principles
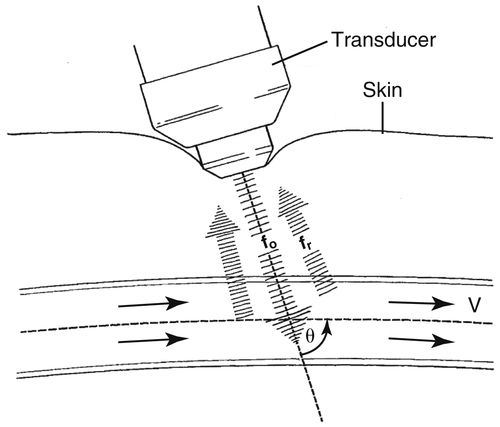
The Doppler Equation
fd=2foVCosθC
fd = Doppler shifted frequency
fo = Carrier (operating) Doppler frequency
C = Speed of sound in soft tissue
Cos ignore Е = Doppler beam angle relevant to the path of blood
V = Velocity (speed) of blood
• As the sound beam is sent into the body, any motion detected in the path of the beam is depicted as a change or shift in frequency.
General Information
Frequency Range
• The diagnostic frequency range for ultrasound is 1 MHz to 20 MHz.
• The frequency chosen depends on the depth of penetration required and the resolution necessary to achieve diagnostic information.
Images in this section courtesy Penn State Hershey Vascular Noninvasive Diagnostic Laboratory, Hershey, Penn., unless otherwise noted.
• As the frequency increases, resolution and blood flow detection also increase, but the depth of penetration decreases.
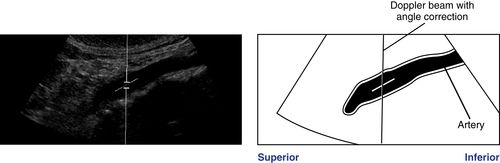
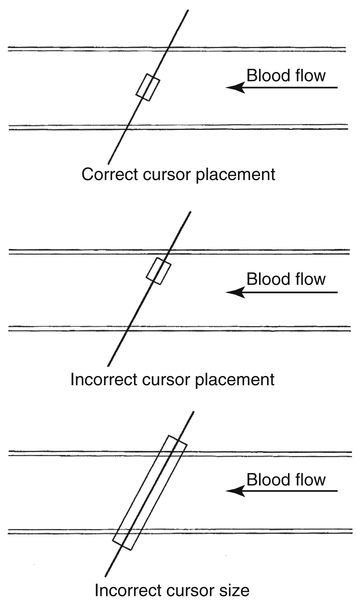
• If quantitative information is needed, the angle of the Doppler beam relevant to the path of blood flow must be known.
• The Doppler shift decreases as the Doppler angle increases. The angle of insonation is usually controlled by the operator.
• It must be remembered that if Doppler-shifted signals are collected at an angle of 0 degrees, the cosine of 0 is 1.0; therefore, a very accurate estimation of velocity is possible.
• An angle of insonation between 45 and 60 degrees usually ensures maximum signal return. It is important to ensure that the angle cursor is aligned parallel to the vessel wall or to the path of blood flow.
• If the angle of insonation is 90 degrees (i.e., perpendicular to flow), the ultrasound system’s computer will not be able to differentiate forward from reverse flow.
• When examining abdominal vessels with very small diameters, sample volume size may be initially enlarged to ensure that all returning Doppler-shifted signals are detected.
• When examining vessels with larger diameters, the sample volume size should be kept smaller.
Doppler Gain
• Doppler spectral gain should be optimized to ensure display of the full range of velocity information without introduction of an inappropriate signal-to-noise ratio.
• An appropriate gain level can be achieved by increasing the Doppler gain until “noise” is apparent and the Doppler spectral envelope is disturbed. Decrease the gain level just to the point where the spectral envelope is clear.
Most Frequently Used Doppler Controls
• Doppler gain: will increase or decrease the total gain applied to the Doppler spectral information.
• Wall filter: high-pass filters. The wall filter eliminates signals based on their frequency. Signals with a frequency higher than the filter setting will pass, whereas lower frequency signals are filtered out. Care must be taken not to set the wall filter too high or useful information will be deleted.
• Angle control: as discussed previously.
• Zero baseline: may be adjusted to allow display of the full range of velocities in a spectral waveform.
• Velocity scale: same as pulse repetition frequency (PRF). Used with pulse Doppler to help eliminate aliasing and to optimize Doppler spectral display. Remember that the Nyquist limit is half the PRF, and aliasing occurs when the Nyquist limit is exceeded.
Doppler Instrumentation
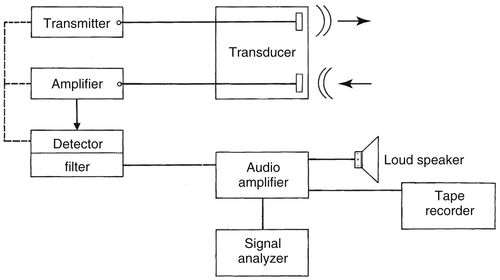
• Continuous-wave (CW) Doppler
• Cheaper.
• Generally a small pencil probe.
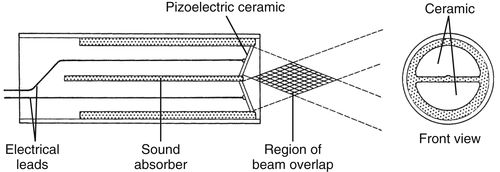
• Employs two crystals. One continuously sends signals, one continuously receives returning echoes.
• Lacks axial resolution.
▪ Cannot determine vessel depth.
▪ Filters may be used to help decrease interference from noise.
• An area of overlap between the outgoing and incoming signals is used as a basis for comparison to determine the Doppler shift frequency.
▪ A demodulator (often a quadrature phase detector) is used to determine the Doppler shift frequency.
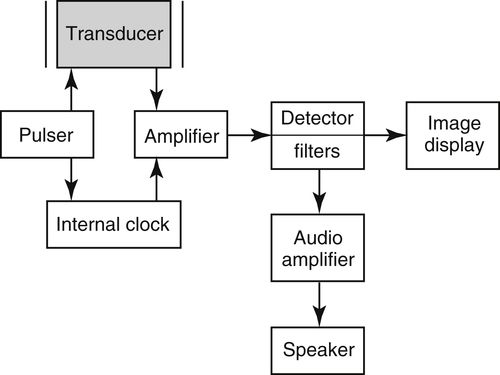
• Pulsed-wave (PW) Doppler
• Often duplex instrumentation. A combination of real-time Doppler velocity spectral display and B-Mode image instrumentation.
▪ The Doppler velocity information may be collected from discrete sample sites within the gray-scale image.
▪ The Doppler crystals are located within the imaging transducer.
• Allows Doppler velocity spectral analysis (temporal display) from a small, specific operator-controllable region (sample volume).
• Capable of examining only a limited frequency range.
▪ Will alias because the Doppler shift frequencies are determined by sampling multiple times along the same pulse line. Because of time and depth limitations (i.e., PRF), the internal computer may not be able to sample often enough within a given time frame to allow display of the full range of frequencies.
• Has poor signal-to-noise ratios; therefore, it may be difficult to detect very low flow signals due to noise interference.
▪ Hard to remove noise without removing real information.
• May use high levels of power.
▪ Spatial peak temporal average (SPTA) levels may reach 1 W/cm2.
• The use of an operator-set Doppler angle correction allows easy calculation of flow velocity by the internal computer, which uses the Doppler equation.
• Color Doppler
• Color encodement is dependent on Doppler shift; therefore, this is an angle-dependent technology.
• Offers an estimate of mean flow velocities (spatially) at each sampling point within the image field at a given instant in time. To produce a color image, the sampling is performed at a very fast rate.
• Multiple sampling often causes noise from tissue movement and moving blood cells to be recorded. Filters must be used to eliminate all but the continuously moving signals.
• Frequency shifts are detected through autocorrelation.
• Power Doppler
• Color encodement is based on the relative intensity of the Doppler signal rather than the Doppler shift. Because of this feature, the direction of flow cannot be determined.
• Useful tool for when flow path is off-axis, slow, or perpendicular to the beam.
Doppler Analysis
Audible Sound
• The Doppler-shift frequency falls within the audible range of 200 Hz to 15 KHz.
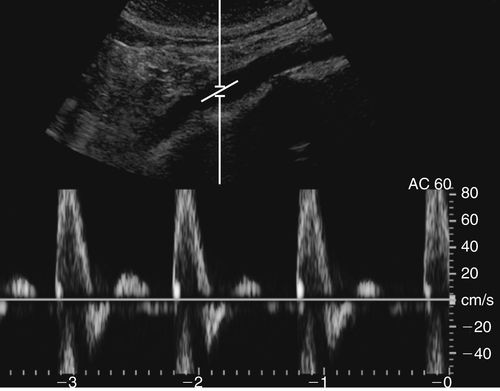
Spectral Analysis
• The Doppler spectral waveform, generated by fast Fourier transform (FFT) analysis, is a graphic display of the range of frequencies and amplitudes contained within the returned signal throughout each cardiac cycle.
• The frequency shift is displayed on the vertical axis, time on the horizontal axis, and amplitude of the returned signals as shades of gray.
Color Doppler Analysis
• The color display is based on 3 characteristics of color:
1. Hue: the three primary colors are used to create color maps (red, blue, and green).
2. Saturation: the amount of white present in a color. This is used to create color shades.
3. Luminosity: this is used to create the brightness of a color.
• Red hue generally represents flow toward the transducer.
• Blue hue generally represents flow away from the transducer.
• Mosaic color patterns or “desaturation” of a primary color represent high velocity or complex, turbulent flow. Choice of color maps is controlled by the operator.
• With color imaging, spectral broadening may be viewed as “variance.”
• One color is arbitrarily chosen to display a wide range of velocities present within the signals.
• The color green is frequently chosen to “tag” a threshold velocity. This allows recognition of elevated velocities (i.e., those that exceed the threshold).
• Other color Doppler controls:
• The number of cycles per color line (often referred to as dwell time, ensemble length, or packet size). As this number is increased, flow sensitivity increases, but frame rate decreases.
• Gray-scale or color priority: this control determines whether gray-scale or color Doppler information will be emphasized in the display. Increasing this control increases the color saturation. Decreasing it helps decrease the color that may be present because of vessel wall and tissue motion. The control acts as a filter by suppressing color information above a threshold level set by the operator.
Doppler Pitfalls
Aliasing
• Does not occur with continuous-wave Doppler.
• Occurs with PW and color Doppler when the Nyquist limit (½ PRF) is exceeded.
• May be corrected by increasing the PRF (velocity scale), lowering the 0 baseline, changing the angle of insonation, or decreasing the Doppler frequency.
• Appearance: an aliased signal will wrap around the baseline.
• This phenomenon occurs because the pulsed-Doppler system cannot sample often enough.
• Aliasing also may occur with color Doppler. It appears as an abrupt change in high-frequency color codes (i.e., light red to light blue).
• Flow reversal will appear as adjacent deep shades separated by black (0 baseline) on the color image.
• The Doppler signal is backscattered from moving red blood cells (Rayleigh scattering). As frequency increases, Rayleigh scattering increases. As in gray-scale imaging, the operator must choose the incident Doppler frequency for adequate penetration that will allow acceptable resolution and signal amplitude without aliasing.
Doppler Mirror Image
• An artifactual display of the Doppler spectral waveform appearing on the opposite side of the zero baseline from the waveform corresponding to the appropriate direction of flow.
• Results from inappropriate angle of insonation or PRF.
Color Imaging Pitfalls
• Color Doppler systems are usually unable to detect flow velocity less than approximately 0.05 meters per second.
1. Low-velocity signals are often obscured by noise or eliminated by the wall filter (if set too high). This problem may be overcome by using a low color velocity PRF.
2. Color Doppler system may use frame rates of 4 to 32 frames per second. The frame rate is operator-controlled. Increase for better resolution.
3. To better detect low-velocity flow, use a higher frequency transducer.
4. To decrease the effect of tissue or vessel wall vibrations, increase the color wall filter.
• Mirror image artifacts:
1. To correct range ambiguity artifacts:
▪ Decrease the PRF.
▪ Increase frequency of the transducer.
▪ Decrease far gain.
2. Grating lobes:
▪ Result from decreased lateral resolution because the beam is not perpendicular to the target.
▪ To correct, adjust the transducer angle and/or Doppler steering angle.
Biologic Effects
• The American Institute of Ultrasound in Medicine (AIUM) states that for imaging transducers, no known bioeffects have been proven below scanning intensity levels of 100 mW/cm2 SPTA.
• No known bioeffects have been documented at currently used diagnostic intensity levels.
• All sonographers should be familiar with their equipment and the intensity levels stated in the manufacturer’s operator’s manual.
• Sonographers should scan conscientiously at all times using the ALARA (as low as reasonable acceptable) principle to adjust power or intensity.
• The AIUM recommends using high power for as brief a period as possible to allow diagnostic studies. This practice ensures that the valuable diagnostic information will still be obtained without introducing any remote risk of harmful biologic effects.
Preparation
Examination Protocol for Abdominal Doppler and Color Flow Imaging
• Abdominal duplex and color flow imaging are performed to confirm patency of vessels, detect the presence and severity of disease, and define the location of disease processes.
Patient Prep
• Patients should fast for 8 to 12 hours or take no food after midnight the evening before the examination. This will decrease abdominal gas, which may interfere with acquisition of image and Doppler flow information.
• Patients with diabetes are made a priority on the early morning schedule. These patients may have dry toast and clear tea before the examination if necessary to prevent hypoglycemia.
• Smoking and gum chewing are discouraged to reduce the amount of swallowed air.
• Morning medications should be taken with sips of water only. No dairy products or citrus juices are allowed because these promote abdominal gas.
• The use of cathartics is usually unnecessary.
Transducer
• A range of transducers from 2.25 MHz to 5.0 MHz, phased or curved linear array probes will be necessary to penetrate to the depth of the abdominal aorta and distal renal arteries.
Patient Position
• The examination is usually initiated with the patient in the supine position with the head resting on a thin pillow.
• Lateral decubitus or prone positions are used as necessary to obtain adequate acoustic windows for visualization of organs and blood vessels.
• The bed is moved to the reverse Trendelenburg position so that the visceral contents can descend into the abdomen. This position facilitates creation of acoustic windows in the upper abdomen.
Arterial Flow Patterns
• Arterial flow pulsates with the cardiac cycle.
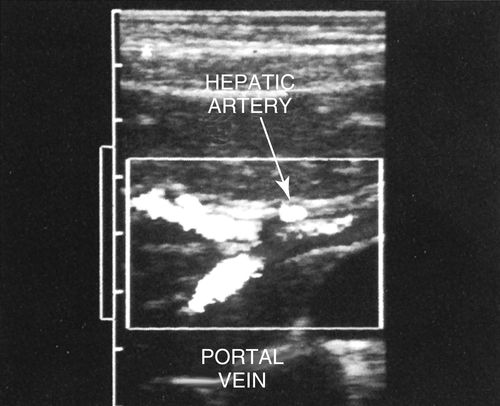
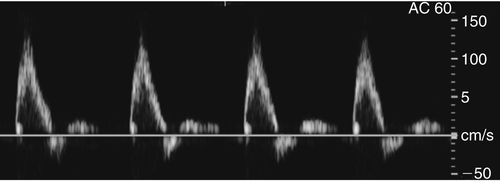
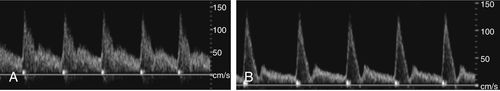
• Most arterial flow within the abdomen exhibits a low resistance waveform pattern (celiac, hepatic, splenic, and renal arteries) because these arteries supply end organs with high flow demands.
• Low-resistance Doppler spectral waveforms exhibit constant forward diastolic flow (above the zero baseline).
• Low-resistance arteries or abdominal masses often have a spectral waveform appearance with lower systolic peaks and a more pronounced diastolic component.
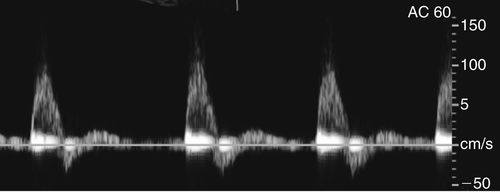
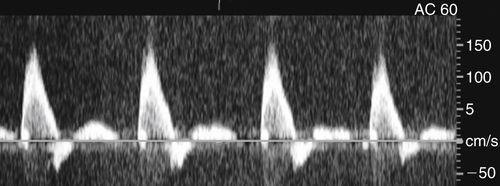
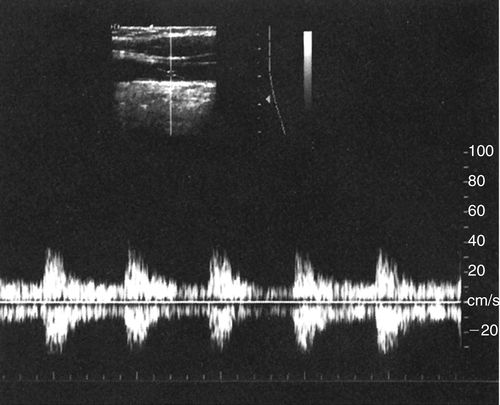
• The superior mesenteric and inferior mesenteric arteries supply muscular tissue beds. In the fasting state, these arteries exhibit a high-resistance Doppler spectral waveform.
• High-resistance Doppler spectral waveforms are characterized by low diastolic flow. A reverse flow component may be present at the end of the systolic deceleration phase of the waveform.
Note
Each vessel has a characteristic appearance based on the level of vascular resistance present in the end organs that they supply or the pathology distal to the sample site.
Related posts:
Stay updated, free articles. Join our Telegram channel

Full access? Get Clinical Tree


