Abstract
Valvular heart disease affects more than 100 million people worldwide and represents a growing problem because of the high incidence of rheumatic heart disease in developing countries and the increasing burden of degenerative valve disease in the ageing population. Imaging is fundamental for the initial diagnostic work-up, follow-up, and selection of the optimal timing and type of intervention in patients suffering from valvular heart disease. Echocardiography is the first line imaging but combining multimodality imaging (e.g., 3D echo, strain imaging, cardiac CT, CMR, nuclear imaging) with clinical findings and circulating biomarkers enables to enhance individualized risk stratification.
Keywords
Prosthetic valves, Stenosis, Regurgitation, Cinefluoroscopy, Doppler echocardiography, Computed tomography, Magnetic resonance imaging.
Aortic root
- V. Polsani
- X. Zhou
- M. Vannan
- X. Zhou
- Marcus Heart Valve Center, Piedmont Heart Institute, Atlanta, GA, USA
- Chinese PLA General Hospital
Echocardiography has an established role in the morphological and hemodynamic assessment of the disorders of aortic root; hence, this section will focus on the essentials of advanced, integrated quantitative imaging of the aortic root to guide interventions. The annulus, the aortic valve (AV) leaflets, the sinuses of Valsalva (SoV), and the sinotubular junction (STJ) are the anatomical components that constitute the aortic root. The functional anatomy of the aortic root involves imaging the geometric relationship of each of these components to delineate pathophysiology of the disease and to guide interventions. This is best achieved by a combination of echocardiography and another modality, the latter being dependent on the target anatomy and the planned intervention.
16.1
Annulus size and calcification
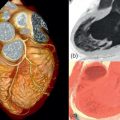
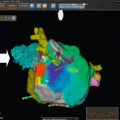
From the imaging perspective, the annulus is the virtual ring formed by the lowest point of the scalloped attachments of the crescent-shaped AV leaflets in left ventricular outflow tract (LVOT). This ring is below a true ring formed by the atrio-ventricular junction where the myocardium gives way to the aortic sleeve. This true ring is below the hinges of the leaflets, the so-called surgical annulus, which is below another true ring, the STJ junction [ , ]. Accurate measurement of the annulus (virtual ring) dimensions has become increasingly important with the advent of trans-catheter-based AV replacement (TAVR). It has also become evident that a single-dimensional 2-D measurement by 2-D echocardiography (2-DE) is anatomically incorrect because the virtual ring is, in fact, not circular, and like the LVOT, there is a minimum and maximum diameter. Thus, at least a mean diameter derived from the bi-plane measurement of the annulus is mandatory to accurately size the annulus. However, even this does not entirely account for the shape of the annulus. The latter is clinically relevant given that the prosthetic valves have a circular design and need to be placed within a noncircular annulus to prevent para-valvular leak (PVL) after TAVR. Thus, it appears that area-based or perimeter-based annulus diameters that account for the shape of the annulus seem to be a better predictor of optimal prosthesis size for TAVR [ ]. Computed tomography (CT) has emerged as the most widely used method to size the annulus for TAVR, although 3-DE is equally good for this purpose [ ]. Recent developments in automated quantitative modeling of the aortic root have in fact further enhanced the reproducibility and workflow of CT and 3-DE (Figure 16.1) for the measurement of annulus size [ ]. When contrast CT is hazardous, as in chronic kidney disease, or contraindicated, sizing the annulus using automated modeling from 3-DE is perhaps the best approach. Balloon sizing is an alternative in this situation, but it still requires contrast injection to ensure that there is no AR when the balloon is fully inflated [ ]. Preliminary data indicate that 3-DE may be at least as good as balloon sizing in the choice of optimal prosthesis size for TAVR. Figure 16.2 shows an example of automated 3-D TEE and correlation to CT in TAVR planning.


Sizing the aortic graft during aortic valve-sparing (AVS) surgery in patients with AR due to dilatation of the ascending aorta (AA) or the aortic root can also be done using the geometric relationship between the annulus and the STJ junction. The diameter of the latter is usually 10–20% smaller than that of the annulus, about 15–20% is children, and 10–15% in adults. In AA aneurysm seen typically in the patients upwards of the fifth decade, the dilatation begins in the AA and extends proximally into the STJ and SOV and distally into the arch. The annulus is usually spared, therefore using the principle that the ideal graft size to remodel the STJ will be ~ 10% less than the annulus diameter holds true. While 2-DE diameter has been used for this purpose it is conceivable that the area or perimeter-based annulus diameter may be more accurate predictors of the graft size [ ]. In aneurysms of the aortic root, typically seen in younger population, the dilatation begins in the sinuses and extends proximally to the annulus and distally to the STJ and AA; using the annulus size to size the graft is not correct [ ].
Annular calcification is both a friend and foe in TAVR. While the presence of calcification ensures stability of the implanted valve, it can interfere with the optimal seating of the fully deployed, appropriately sized valve. Bulky calcification of the annulus at the non-coronary cusp, especially those which extend into the LVOT, are predictors of significant PVL post-TAVR. CT is uniquely suited to assess the distribution and quantify the volume of annular calcification [ , ]. 2-DE and 3-DE can be used to visualize calcification, and the latter can be used to assess the distribution of annular calcium. However, both techniques are inferior to CT for this purpose.
16.2
Aortic valve leaflets
The aortic leaflets are semilunar shaped to conform to the scalloped curvature of each annular segment. The bases of the aortic leaflets are longer than the free edge length (~ 1.5 times), and the latter is 1.6–2.2 times the height of the leaflets. The normal leaflet edge lengths range from 26 to 35 (average ~ 31 mm) mm and height from 12 to 19 mm (average ~ 14.5 mm). The NCC tends be the largest (because most of the systolic flow occurs over this leaflet) followed by the RCC and LCC. The cusps form the belly of the leaflets, and the latter forms a sphere with their respective SOV. The thin fibrous coapting surfaces of the adjacent leaflets called the lunulae are about 2–4 mm in height, and the nodular thickening at the center of the free edge called the nodule of Arantius aids in the competence of the closed AV. About 50% of the leaflet height and 30% of the leaflet surface area are used for effective sealing of the valve orifice in diastole. The effective leaflet height is the vertical distance between the annular plane and the tips, which is usually 7–12 mm. The length of the cusp apposition during closure is called the coaptation length, which is 5–6 mm, and the closure point does not necessarily correspond to the geometric center of the AV orifice. The highest point of attachment of the leaflets to the aorta are the commissures which are just below the STJ. Beneath the commissures of the leaflets there are 3 triangular spaces at the junction of the scalloped annulus and the LVOT. The subcommissural segment between the NCC and RCC is fibrous and includes the membranous interventricular septum, the triangular space between the NCC and LCC is the fibrous aorto-mitral curtain, and the space between the RCC and LCC is the muscular interventricular septum. The two subcommissural spaces of the NCC constitute 55% of the circumference of the attachment of the annulus to the LVOT, the subaortic space between LCC, and RCC occupies the other 45% of the circumference. Dilatation of the annulus causes the two subcommissural triangular spaces beneath the NCC to become more obtuse, which reduces leaflet coaptation length and results in AR [ ].
Echocardiography is the key imaging modality to assess the AV leaflets. CT and CMR provide limited information in this regard. While trans-thoracic echocardiography (TTE) can provide visualization of the morphology of the leaflets, measurement of leaflet parameters is best done by 2-D/3-DTEE. Real-time volume TEE of the aortic root is now an established clinical tool, and automated algorithms can be applied to measure leaflet free edge length, height, and coaptation height [ ]. CT can also be used for this purpose but the leaflets can be difficult to identify for automated 3-D quantification. Dilatation of the STJ causes the commissures to be pulled outwards increasing the inter-commissural distance (ICD), which in turn causes AR both due to non-coaptation of the leaflets and downward displacement of the coaptation height relative to the annulus. However, often the aortic leaflets lengthen and become taller to compensate for the dilatation of the STJ and maintain competency of AV closure with no or minimal AR. However, this proportionate leaflet remodeling is offset by a limited increase in the height so that with progressive dilatation of the STJ, the leaflets continue to lengthen but the increase in height is blunted. This results in leaflets that are disproportionately longer than they are taller, at which point a regurgitant orifice and AR develop. This usually occurs when the leaflet length to the height ratio exceeds 2:1, which can be measured by automated modeling of the leaflets from 3-D TEE or CT data ( Figure 16.3 ) [ , ].

The leaflet free-edge length and height are useful in estimating the size of the graft during AVS surgery. Generally, the optimal graft size is about 10% less than the average free-edge length but the considerable leaflet remodeling that occurs in AR associated with aortic root aneurysms renders this index less useful. However, the leaflet height is relatively fixed so that two-thirds of the average heights of the leaflets, plus 3–4 mm since the graft is sutured outside of the annulus, is a reliable predictor of the optimal graft size [ ]. A number of other indices such 90% of the average free edge leaflet length, diameter of the best fit circle of the ICD, and commissural height have all been used for predicting graft size but all of these are affected by leaflet remodeling in aortic root aneurysms and do not provide a reliable estimate of the best-fit graft size. In older patients with aortic aneurysm with STJ dilatation and normal annulus, sinuses and leaflets AVS surgery can be performed using a graft size estimated by the diameter of the imaginary best fit circle, which includes the ICD between the cusps when the cusps and pulled upwards to create an optimal coaptation after surgical exposure of the STJ. This is an alternative/additional approach to using the annulus diameter to predict the graft size during STJ remodeling operation, and a height < 8 mm is predictive of recurrent AR after AVS surgery.
16.3
Sinus of Valsalva and sinotubular junction
The 3 sinuses can be considered as horizontal outpouchings from the annulus extending to the STJ. The shape of the normal sinuses can show individual variations with the height of the right SOV usually being the biggest followed by the non-SOV and the left SOV, respectively. The sinuses do not have a role in maintaining valve competency in diastole but play an important role in reducing the mechanical stress on the leaflets during closure. The eddy currents that form in the sinuses during systole allow the belly of the leaflets to approximate before the free edges of the leaflets during cosure, thereby reducing the trauma on the thin lunulae. The walls of the sinuses are thinner closer to annulus than the STJ, and circumference of the aortic root at the mid-point of the SOV is about 50% larger than the STJ. The origin of the coronary ostia is also distinctive, with the right arising higher (closer to the STJ) than the left, which arises almost from the mid-portion of the SOV. The STJ is a ridge of collagen and elastic fibers at the summit of the SOV just above the commissures. The circumference of the STJ in children (~ 15%) and younger adults (~ 10%) is less than that of the annulus; aging-related replacement fibrosis causes the STJ diameter to become equal to or exceed the diameter of the annulus.
Both echocardiography and CT are useful in the assessment of the SOV. Sinus height, width, and volume can be measured. Reduced sinus height, and perhaps volume can predict challenges during TAVR both with respect to optimal landing of the prosthetic valve and risk of rupture. Similarly, dilated sinuses may result in PVL due to improper landing of the valve during TAVR. During AVS surgery, using grafts that include sinuses have been advocated as beneficial in reducing closing stress on the native leaflets and ensuring durability of the repair. However, this has not been necessarily borne out in the long-term outcome data of AVS surgery, which may have to do with the design of these grafts rather than the concept that the preservation of the natural geometry of the SOV is a desirable goal. In the future, imaging flow patterns in SOV by phase contrast CMR may help design these grafts to have the intended benefits.
Aortic stenosis
- V. Polsani
- X. Zhou
- M. Vannan
- X. Zhou
- Marcus Heart Valve Center, Piedmont Heart Institute, Atlanta, GA, USA
- Chinese PLA General Hospital
16.4
Aortic valve/root morphology
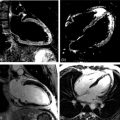
2-D trans-thoracic (TTE) usually suffices to image the etiology of aortic stenosis (AS) because calcific AS is the most common cause. If TTE is suboptimal, and it is necessary to visualize the valve anatomy, trans-esophageal echocardiography (TEE) is helpful for this purpose ( Figure 16.4 ). Additionally, TEE can be useful to image the LVOT and the supra-valvular aorta if there is suspicion of associated abnormalities. For both of these, CMR is also a valuable additional or alternative imaging modality ( Figures 16.4 and 16.5 ). CT is the modality of choice for the assessment of the aortic root in calcific AS for TAVR planning, and when contrast CT is contraindicated 3-D TEE is a useful alternative for TAVR planning ( Figure 16.6 ) [ ].


16.5
Severity of aortic stenosis
Doppler echocardiography is the cornerstone for hemodynamic evaluation of AS. It is now the established modality to assess the severity of AS in both normal and reduced stroke volume with preserved or reduced EF [ ]. Measurement of instantaneous peak and mean gradient from aortic valve (AV) Doppler velocity and the calculation of the AVA using the continuity equation are the two most commonly used methods to assess the hemodynamic severity of AS. In most instances, these two indices provide a reliable assessment of the degree of valvular obstruction. In specific instances, the ratio of the peak LVOT velocity to that of the AV velocity (the so-called dimensionless index) and calculation of the arterial impedance (ZVa score) is helpful in making the diagnosis of severe AS ( Figure 16.7 ). Not only is Doppler echocardiography essential in the diagnostic evaluation of AS, it has become the basis for prognostic assessment too, especially in the setting of asymptomatic severe AS. Very severe AS, low-flow low-gradient normal and reduced EF (LFLG-nEF, LFLG-rEF) severe AS are examples that are now recognized as groups with higher risk when not treated or may have variable response to valve replacement (AVR) based on other factors [ ]. Reduced global longitudinal strain measured by speckle-tracking echocardiography in very severe AS or LFLG-rEF or LFLG-nEF is an additional marker of adverse outcomes or suboptimal response to AVR [ , ]. Similarly, myocardial scar burden and extent of fibrosis on T1 mapping by CMR are evolving as powerful predictors of outcomes in these selected subgroups of severe AS [ ]. When Doppler hemodynamics are equivocal in the evaluation of severity of AS, direct planimetry of the AV area (anatomic AVA) may be useful. It is often difficult if not impossible to obtain anatomic AVA by TTE, especially when there is significant calcification of the annulus and leaflets. Hence, 2-D TEE and 3-D TEE are preferred for this purpose, the latter being superior to the former ( Figure 16.8 ). Both TEE techniques may be limited by bulky calcification for anatomic AVA, in which case CMR offers an alternative. Velocity-encoded CMR may also provide hemodynamic assessment of AS by measurement of peak velocity and gradient ( Figure 16.9 ) [ ]. It is also possible to use the amount of calcification of the AV as an index of the severity of AS in addition to hemodynamic assessment especially when the Doppler data is uncertain. Also, the extent of calcification of the AV may be used to predict progression to severe AS and used for decision making about the timing of intervention in specific circumstances [ , ]. The extent of calcification of the AV is best imaged and quantified by CT ( Figure 16.6 ). Anatomic AVA may also be obtained by CT when it is done for assessment of coronary anatomy in patients with AS. Lastly, exercise hemodynamics of the AV using Doppler echocardiography and peak-exercise myocardial strain imaging are valuable when resting data do not resolve the issue of severity of AS, when symptoms are either apparently absent in the setting of severe AS, or when symptoms are out of proportion to the severity of AS [ ].


16.6
Synthesis
Resting and exercise 2-D and Doppler echocardiography are the key techniques to assess the hemodynamic severity of AS. When the data from echocardiography is ambiguous or when additional data on the morphology of the AV is may provide additional insights, TEE or CMR may be used to obtain additional information. CT is particularly useful when the degree of AV calcification is needed for diagnostic or prognostic evaluation of AS, and is the modality of choice for evaluation of the aortic root for TAVR planning.
Aortic regurgitation
- V. Polsani
- X. Zhou
- M. Vannan
- X. Zhou
- Marcus Heart Valve Center, Piedmont Heart Institute, Atlanta, GA, USA
- Chinese PLA General Hospital
16.7
Aortic valve/root morphology
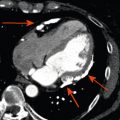
The combination of 2-D trans-thoracic and trans-esophageal echocardiography (TTE, TEE) usually suffices to image mechanism of aortic regurgitation (AR). Additionally, 3-D TEE provides additional insights into the aortic valve and root for a comprehensive assessment of the underlying mechanism of AR in most instances. CMR and CT may be helpful in specific circumstances to complement echocardiography in the assessment of the aortic root. For example, in bicuspid AV, the leaflet morphology and the associated aortic abnormalities can be accurately imaged by CMR. Similarly, CT may be useful to assess the aortic root when the cause of AR is aortic dissection/hematoma ( Figure 16.10 ).

16.8
Severity of aortic regurgitation
While symptomatic severe aortic regurgitation (AR) is Class I indication for surgical intervention, symptoms are often non-specific or unreliable. Hence, quantitative imaging data is important in clinical decision-making and has been included in guidelines in the management of AR. In fact, among the objective parameters that influence the current clinical practice for intervention in chronic AR, almost all of these can be obtained by non-invasive imaging [ , ].
Current quantitative assessment of the AR is done by three principal approaches: measuring the effective regurgitant orifice area (EROA), the width of the vena contract (VC), and the regurgitant volume and fraction (RV, RF). The first two approaches are done by color flow Doppler (CFD) imaging, and the RV and RF can be measured by both echocardiography and CMR. Measurement of EROA and RV using the 2-D flow convergence radius (PISA method) is both validated and recommended to quantify AR [ , ]. But the PISA method in AR is technically demanding and often not possible, especially in eccentric and multiple jets. The measurement of VC width by 2-D CFD imaging ( Figure 16.11 ) is more practical than the PISA method but it is a semi-quantitative measure of the regurgitant orifice size, unlike the PISA method. Also, the 2-D VC width is limited by the lateral resolution of the CFD, is not valid in multiple jets, and small technical errors in measurement can lead to misclassifying the degree of AR. Whether 3-D echo can improve the accuracy of the PISA method and the VC (area) to quantify AR remains to be seen but has shown promise in preliminary studies [ ]. Another potential quantitative measure of AR is the direct measurement of the anatomic orifice area using 3-D TEE, the so-called anatomic orifice area (AOA, Figure 16.12 ). This is less validated in AR compared to mitral regurgitation but may offer an additional or alternative approach where other quantitative measures are equivocal or not possible.


Measurement of RV and RF is the most optimal way to quantify AR and in this regard CMR clearly is the preferred technique. While RV and RF can be measured by Doppler echocardiography, it is both impractical and fraught with technical challenges where small errors can lead to big inaccuracies, hence it is largely abandoned in routine clinical practice [ ]. The PISA method does yield RV/RF but in addition to the limitations of the PISA method mentioned above, the spectral Doppler of AR is often incomplete especially in eccentric jets making it an unreliable index. Hence, CMR is the preferred method to measure RV and RF. Using both magnitude and phase-contrast (PC) images from velocity-encoded CMR imaging, instantaneous flow volume can be obtained by measuring the flow velocities of each pixel within a region of interest (lumen of the aorta) ( Figure 16.13 ). Integrating the flow volume in each frame over the entire cardiac cycle generates forward and regurgitant flow volumes from which RF can be calculated ( Figure 16.14 ) [ , ]. When velocity-encoded PC-CMR is unreliable as when the area of interest is obscured by hardware artifacts and or when flow is complex in a markedly dilated aortic root, PC-CMR of the descending thoracic aorta may be used to demonstrate holo-diastolic flow reversal similar to flow reversal seen in the distal aortic arch or the abdominal aorta by Doppler echocardiography ( Figure 16.11 ) [ , ]. Alternatively, holo-diastolic flow reversal may be used for additional evidence of severe AR during CMR imaging, albeit this is a semi-quantitative measure of severity of AR. Similarly, Doppler echocardiography provides a number of semi-quantitative measures of severe AR, such as the dense envelope (when optimally aligned with the direction of the AR jet), a short pressure half-time (typically < 250 ms), deceleration time < 150 ms of the mitral-inflow Doppler, and the time-velocity integral of the flow reversal in the distal aortic arch > 15 cm ( Figure 16.11 ) [ ].


Another advantage of CMR over echocardiography is for accurate measurement of LV volumes and EF [ ]. Both of these parameters are necessary for determining the need to intervene in AR. Both, 2-D and M –Mode echo are excellent for measurement of single-plane LV dimension, but accurate measurement of EF is often not reliable or limited by sub-optimal acoustic windows. Contrast echocardiography improves the feasibility and accuracy of EF measurements and may also aid in the measurement of LV dimensions in the setting of sub-optimal acoustic windows. Whether 3-D echocardiography can provide improved quantification of LV size and EF specifically in AR remains to be seen [ ]. However, at the present time, if accurate LV size and EF are needed either to confirm the degree of AR or for clinical decision-making CMR is the preferred method. Also, the extent of myocardial fibrosis measured by CMR may be another break-point for intervention in severe AR even in the absence of symptoms in the future [ ].
Table 16.1 summarizes the parameters used to measure severity of AR and the applicable imaging techniques.
| Echocardiography | CMR | |
|---|---|---|
| Semi-quantitative parameters | ||
| Density of spectral Doppler | ++ | − |
| Spectral Doppler pressure HT | ++ | − |
| Aortic HDFR | +++ | ++ |
| Color-Doppler VC | +++ | − |
| Quantitative parameters | ||
| EROA | ++ | – |
| Anatomic ROA | ++ | – |
| RV/RF | + | +++ |
| LV dimension | +++ | ++ |
| LV volume/EF | + | +++ |
Mitral regurgitation
- P. Lancellotti
- University of Liège Hospital, CHU Sart Tilman, Liège, Belgium
- GVM Care and Research, E.S. Health Science Foundation, Lugo (RA), Italy
16.9
Introduction
Mitral regurgitation (MR) is the second most frequent valve disease in Europe after aortic stenosis [ ]. MR consists of abnormal systolic regurgitation of blood from the left ventricle (LV) to the left atrium (LA). Imaging plays a major role in assessing the aetiology, mechanisms and severity of MR [ ].
16.10
Aetiology and mechanisms
Assessment of MR by imaging involves comprehensive evaluation of the aetiology (cause of the valve disease) and mechanism (lesion/deformation resulting in valve dysfunction), including the dysfunction type (leaflet motion abnormality). The cause of MR is classified as either primary (i.e., organic/structural) or secondary (i.e., functional/non-structural), whereas the mechanism is based on Carpentier’s classification of leaflet motion: Type I: normal leaflet motion, Type II: excessive motion, or Type III: restrictive motion (A: diastolic (e.g., rheumatic disease) and B: systolic (e.g., ischaemic or non-ischaemic LV remodeling with leaflet tethering due to local or diffuse ventricular dilatation)). The same aetiology can cause different MR mechanisms (e.g., endocarditis causing perforation-Type I or ruptured chordae-Type II) [ , ].
Normal mitral valve function depends on coordinated interaction between the annulus, leaflets, sub-valvular apparatus (chordae tendineae and papillary muscles) and the LV ( Figure 16.15 ). Dysfunction of any component can cause MR. The location of the involved leaflets (A: anterior; P: posterior) and scallops (numbered 1–3 for anterolateral, middle, and posteromedial, respectively), the calcification location (limited to annulus or extending to leaflets, commissures or sub-valvular apparatus), and the extent (localized or diffuse) determine the feasibility of valve repair.

Degenerative disease , the most common surgical MR cause, involves mitral valve prolapse (type II) and covers a large spectrum of lesions, such as (1) isolated billowing with the leaflet tips remaining intra-ventricular to flail leaflet with valvular eversion, (2) isolated scallop to multi-segment (or generalized) prolapse and (3) thin/non-redundant leaflets to thick/excess tissue (Barlow’s disease). Prolapse location, valvular/annular calcifications and the severity of the annulus dilatation may affect the feasibility and choice of surgical/percutaneous repair techniques.
Secondary (functional) MR develops despite a structurally normal mitral valve due to mitral tethering secondary to ventricular deformation/remodeling, annular dilatation/dysfunction and insufficient LV-generated closing forces. Assessing ventricular global (diameters, volumes, sphericity, mass) and local remodeling (displacement of papillary muscles) and mitral valve deformation (coaptation depth, tenting area and volume in 3D) is of paramount importance in evaluating repairability and results of treatment [ ].
16.11
2D/3D echocardiographic evaluation
Two-dimensional (2D) TTE is critical to initial and longitudinal assessment of patients with MR [ ]. However, TOE plays a major role when TTE is non-diagnostic, when further diagnostic refinement is required or when mitral valve surgery is contemplated. Use of 3D echocardiography, especially 3D TOE, for mitral morphology and function evaluation is growing. A 3D display of complex mitral pathology or cardiac structures not well visualized by 2D echo (mitral annulus, papillary muscles) enhances pathophysiologic insight and communication.
- ●
Mitral valve analysis
The assessment of the different components of the mitral valve apparatus requires multiple views. The short-axis view can be obtained by TTE or TOE, using the classical parasternal short-axis view and the transgastric view at 0°. This view permits, in diastole, the assessment of the six scallops and the two commissures. In systole, the localization of prolapse may be identified by the localization of the origin of the regurgitant jet. With TTE, a classical apical 4-chamber view is obtained and explores the anterior leaflet; the segments A3 and A2 and the posterior leaflet in its external scallop P1 can be visualized ( Figure 16.16 ). With TOE, different valvular segments are observed, which depend on the position of the probe in the oesophagus when progressing from up to down. This allows successive observation of A1 and P1 close to the anterolateral commissure, A2 and P2 and finally A3 and P3 close to the posteromedial commissure (at 40–60°). The parasternal long-axis view with TTE and the sagittal view at 120° with TEE show the medium portions of the leaflets (A2 and P2). A bi-commissural view can be obtained in the apical 2-chamber view with TTE, and a view at 40–60° with TOE shows the two commissural regions and, from left to right, P3, A2 and P1. A 2-chamber view from the transgastric position, perpendicular to the sub-valvular apparatus, allows measurement of the length of the chordae and the distances between the head of the papillary muscle and the mitral annulus. With the use of real-time 3D imaging , the mitral valve is best imaged when obtained in zoom mode to avoid stitch artefacts that may occur in a wide-angled acquisition. With both TTE and TOE, the unique ‘en face’ view, which is similar to the surgical view after left atriotomy, can be displayed ( Figure 16.17 ) [ ]. To simulate the surgeon’s view of the valve, the 3D images are reoriented to exhibit the aortic valve at the 11 o’clock position. The sub-valvular apparatus is, on the opposite, best imaged from the LV perspective. To note, the gated full volume modality (wide-angled acquisition of 4 ECG gated pyramidal volumes) is the ideal way to obtain imaging of the entire mitral valve apparatus (chordae, papillary muscles, LV). Recently, new dedicated software for advanced 3D analysis of the mitral valve has been developed to be incorporated into clinical practice [ ]. It provides a realistic 3D model of the mitral valve and allows the calculation of a wide range of potentially useful parameters (annulus, anterior and posterior leaflet, leaflet segmentation, coaptation line and potential coaptation defects, mitral valve spatial relationship with the papillary muscles and aortic valve). The possibility of measuring the surface of the anterior leaflet to estimate, in a beating heart, the size of the annular ring ranks among the software’s most interesting features. The added value of these parameters still needs to be defined.

Figure 16.16
Mitral valve segmentation analysis with TTE.

Figure 16.17
3D volume rendering of the mitral valve. (a) P2 prolapse, (b) Flail of P3.
- ●
Repairability
Repairability prediction requires a systematic approach to describe the combination of lesions contributing to mitral dysfunction that all require specific correction ( Table 16.2 ). Surgical mitral valve repair can be compromised in the presence of a large central regurgitant jet, severe annular dilatation (> 50 mm), involvement of 3 or more scallops (especially if the anterior leaflet is involved) and extensive valve calcifications or calcified rheumatic valve disease. Additionally, in secondary MR, extensive LV remodeling (end-systolic diameter > 51 mm), severely altered geometry of the mitral valve apparatus (systolic tenting area > 2.5 cm 2 and coaptation distance > 1 cm) and extensive basal LV necrosis have been shown to increase the risk of unsuccessful mitral valve repair [ , ].
Table 16.2
Probability of successful mitral valve repair in MR based on echo findings
Aetiology
Dysfunction
Calcification
Mitral annulus dilatation
Probability of repair
Degenerative
II: Localized prolapse (P2 and/or A2)
No/Localized
Mild/Moderate
Feasible
Secondary
I or IIIb
No
Moderate
Feasible
Barlow
II: Extensive prolapse (3 or more scallops, posterior commissure)
Localized (annulus)
Moderate
Difficult
Rheumatic
IIIa but pliable anterior leaflet
Localized
Moderate
Difficult
Severe Barlow
II: Extensive prolapse (3 or more scallops, anterior commissure)
Extensive (annulus + leaflets)
Severe
Unlikely
Endocarditis
II: Prolapse but destructive lesions
No
No/Mild
Unlikely
Rheumatic
IIIa but stiff anterior leaflet
Extensive (annulus + leaflets)
Moderate/Severe
Unlikely
Secondary
IIIb but severe valvular deformation
No
No or Severe
Unlikely
Adapted from Lancellotti et al. [ ] (Eur Heart J Cardiovasc Imaging 2013).
- ●
Assessment of MR severity
Comprehensive MR severity assessment is mandatory, using an integration of qualitative findings (e.g., mitral valve morphology, color flow and continuous wave signal of MR jet), semi-quantitative findings (e.g., vena contracta width, pulmonary vein flow, mitral inflow) and quantitative findings (regurgitant volume (RVol) and effective regurgitant orifice area (EROA)), as well as supportive findings (enlarged LV and/or LA, increased pulmonary arterial pressure) [ ]. MR can easily be diagnosed with color-flow imaging, but this technique should not be used for grading MR severity. Localization, duration, timing and direction of regurgitant jet into the LA should be evaluated. Only holosystolic MR jets are typically associated with significant regurgitation. When feasible, measurements of vena contracta width and flow convergence are recommended when more than a small central jet is observed. The width of the vena contracta – the narrowest part of the jet – correlates with quantitative measurements of MR. Using a Nyquist limit of 40–70 cm/s, a vena contracta width < 3 mm correlates with mild MR, whereas a width ≥ 7 mm indicates severe MR ( Table 16.3 ; Figure 16.18 ). Intermediate values are not accurate at distinguishing moderate from mild or severe MR (large overlap); they require the use of another method for confirmation. The moderate lateral resolution is a limitation. In the absence of mitral stenosis, a peak mitral E wave velocity > 1.5 m/s suggests severe MR. A pulsed Doppler mitral (at the mitral leaflet tips) to aortic velocity time integral (VTI) ratio > 1.4 also strongly suggests severe MR, whereas a VTI ratio < 1 is in favor of mild MR. In severe MR, the S wave component of pulsed Doppler pulmonary venous flow becomes frankly reversed if the jet is directed into the sampled vein. A dense MR continuous wave Doppler signal with a full envelope indicates more severe MR than a faint signal. When truncated (notch) with a triangular contour and an early peak velocity (blunt), it indicates elevated LA pressure or a prominent regurgitant pressure wave into the LA due to severe MR. Quantitation of MR severity is essential for MR grading and clinical decision-making. Quantitatively defined severe MR portends a poor prognosis regardless of the aetiology. Quality control of the flow convergence method (proximal isovelocity surface area (PISA)), particularly important with eccentric jets, dynamic MR throughout systole and the proximal flow convergence shape, is essential in practice as this method has demonstrated links to outcome ( Figure 16.19 ). The use of 3D color flow volumetric imaging allows direct assessment of the size and shape of the regurgitant orifice, preventing the geometric assumptions applied by 2D imaging. With manual cropping of the image plane perpendicularly orientated to the jet direction, the narrowest cross-sectional area of the MR jet can be obtained in an ‘en face’ view and measured by planimetry in systole ( Figure 16.20 ). In primary MR, the shape of the regurgitant orifice has been shown to be relatively rounder. Several studies using 3D TOE for planimetry of the anatomical regurgitant orifice (the vena contracta area) have found a high correlation with the 2D vena contracta and the PISA method [ , ]. A recent study showed its superiority over the PISA method in eccentric jets [ ]. Of note, new 3D/4D ultrasound probe generations will allow automatic visualization of the 3D PISA surface and anatomic orifice area, with expected higher accuracy of the subsequent RVol calculation.
Table 16.3
Grading the severity of primary MR
Parameters
Mild
Moderate
Severe
Qualitative
MV morphology
Normal/Abnormal
Normal/Abnormal
Flail leaflet/Ruptured PMs
Color flow MR jet
Small, central
Intermediate
Very large central jet or eccentric jet adhering, swirling and reaching the posterior wall of the LA
Flow convergence zone
None or small
Intermediate
Large
CW signal of MR jet
Faint/Parabolic
Dense/Parabolic
Dense/Triangular
Semi-quantitative
VC width (mm)
< 3
Intermediate
≥ 7 (> 8 for biplane) a
Pulmonary vein flow
Systolic dominance
Systolic blunting
Systolic flow reversal
Mitral inflow
A wave dominant
Variable
E wave dominant (> 1.5 m/s)
VTI mit/VTI Ao
< 1
Intermediate
> 1.4
Quantitative
EROA (mm 2 )
< 20
20–29; 30–39 b
≥ 40
RVol (ml)
< 30
30–44; 45–59 b
≥ 60
+ LV and LA size and the systolic pulmonary pressure.
Adapted from Lancellotti et al. [ ] (Eur Heart J Cardiovasc Imaging 2013).
a Average between apical 4- and 2-chamber views.
b Grading of severity of organic MR classifies regurgitation as mild, moderate or severe, and sub-classifies the moderate regurgitation group into ‘mild-to-moderate’ (EROA of 20–29 mm 2 or a RVol of 30–44 ml) and ‘moderate-to-severe’ (EROA of 30–39 mm 2 or a RVol of 45–59 ml). In secondary MR, the thresholds of severity, which are of prognostic value, are 20 mm 2 and 30 ml, respectively.

Figure 16.18
A semi-quantitative assessment of MR severity using the vena contracta width. The three components of the regurgitant jet (flow convergence zone, vena contracta, jet turbulence) are shown.

Figure 16.19
Quantitative assessment of MR severity using the PISA method. Stepwise analysis of MR: (a) Apical 4-chamber view, color-flow display, zoom of the selected zone, downward shift of zero baseline to obtain an hemispheric PISA; measurement of the PISA radius using the first aliasing; (b) Continuous wave Doppler of MR jet allowing calculation of the effective regurgitant orifice area (EROA) and regurgitant volume (RVol).

Figure 16.20
Vena contracta area as assessed by 3D echocardiography showing that the vena contracta of the regurgitant jet can be elliptic. 3D echocardiography allows correct alignment perpendicular to the jet direction and accurate measurement of the vena contracta area.
Severe MR is defined according to current recommendations with different criteria for primary/organic MR (severe: RVol ≥ 60 ml, EROA ≥ 40 mm 2 ) and for secondary/functional MR (severe: RVol ≥ 30 ml, EROA ≥ 20 mm 2 ) based on outcome studies. Exercise echocardiography can also be useful to evaluate the changes in EROA and RVol during stress; an increase by one MR grade is indicative of higher cardiovascular risk [ ].
- ●
Consequences of MR
MR hemodynamic consequences on LV, LA and pulmonary pressure should be evaluated. LV enlargement is measured by LV diameters and/or volumes (2D method of discs or 3D echo when imaging is of high quality). LV dysfunction is evaluated by either ejection fraction or end-systolic LV size. Of note, LV ejection fraction is load dependent and often overestimates LV systolic performance. An increased LV end-systolic diameter (> 40–45 mm) and an LV ejection fraction < 60% are indicators of LV systolic dysfunction, portend poor long-term prognosis and generally are accepted as indications for surgery even in the absence of symptoms [ ]. A systolic tissue Doppler velocity measured at the lateral annulus < 10.5 cm/s has been shown to identify subclinical LV dysfunction and to predict post-operative LV dysfunction in patients with asymptomatic primary MR [ ]. Similarly, a global longitudinal strain < 18% (2D-speckle tracking) has been associated with post-operative LV dysfunction [ ]. More recently, LV global longitudinal strain < 20% was associated with reduced cardiac event-free survival in asymptomatic patients with primary MR and no LV dysfunction/dilatation [ ]. The response to exercise stress echocardiography can be used to identify the presence of contractile reserve (viability) in patients with secondary MR. In primary MR, it is defined as a < 4% increase in LV ejection fraction or exercise-induced < 2% changes in longitudinal strain [ ]. The LA dilates in response to chronic volume and pressure overload. A normal-sized LA is not normally associated with significant MR unless it is acute, in which case the valve appearance is likely to be grossly abnormal. An enlarged LA (LA volume index > 60 ml/m 2 ) predicts poor prognosis in patients with primary MR [ ]. A systolic pulmonary arterial pressure > 50 mm Hg at rest or > 60 mm Hg (obtained by summing the transtricuspid pressure gradient and the estimated right atrial pressure) at exercise markedly affects the outcome of patients with primary MR [ ]. A tricuspid annulus dilatation (≥ 40 mm or > 21 mm/m 2 ) contributes to recurrent tricuspid regurgitation after mitral valve surgery [ ].
16.12
Cardiac magnetic resonance
In patients with inadequate or discrepant echocardiography, cardiac magnetic resonance (CMR) permits quantification of MR severity and evaluation of LV anatomy and function. CMR is the most accurate and reproducible non-invasive method for assessing LV volumes, the LV ejection fraction and remodeling findings [ ] ( Figure 16.21 ). For instance, the extent of LV remodeling is often undervalued in patients with degenerative MR, especially when localized at the LV apical region [ , ]. It has been recently shown that in patients with moderate to severe primary MR without overt LV dysfunction, 2D TTE may significantly underestimate LV remodeling in comparison to CMR [ ].

CMR can also be used for valve analysis using steady-state free precession (SSFP) sequences, which precisely discriminate blood from tissue [ ]. Turbulent flow through the mitral regurgitant orifice is easily visible with SSFP (visualization of signal voids due to spin dephasing in moving protons). Mitral valve anatomy can be imaged by acquisition of standard short-axis, 2-, 3- and 4-chamber long-axis views in combination with oblique long-axis cines orthogonal to the line of coaptation [ ]. CMR has comparable diagnostic value to echocardiography for identification of prolapsing scallops, but it is inferior for imaging the sub-valvular apparatus (torn chordae) due to its lower spatial and temporal resolution.
Only a few studies have used SSFP CMR for assessing the EROA by planimetry of the regurgitant orifice in a slice parallel to the valvular plane and perpendicular to the regurgitant jet at mid-systole. Quantification of EROA seems to be correlated well with angiographic and echocardiographic data [ ]. There is also a good agreement with the PISA method by 2D or 3D echo and CMR planimetry of the regurgitant orifice [ ] ( Figure 16.22 ). To note, CMR planimetry defines the anatomic regurgitant lesion, whereas the area of EROA by PISA yields the narrowest flow stream, which tends to be smaller than the anatomic orifice area. It should also be emphasized that the regurgitant orifice is frequently inconstant throughout systole in primary MR. This can potentially affect the estimation of the regurgitant severity. Lastly, planimetry of the MR regurgitant orifice is time consuming and remains challenging because appropriate plane alignment and angulation may be more difficult due to the longitudinal movement of the mitral annulus and, in some cases, of the irregular shapes of the regurgitant orifice. Furthermore, with CMR, blood flow and velocity can be accurately obtained by phase-contrast velocity mapping. Hence, RVol can be measured indirectly as the difference between the total stroke volume and the aortic flow (forward stroke volume), as well as directly as the regurgitant flow across the mitral valve. This latter measurement, however, requires a specialized imaging sequence that tracks the motion of the mitral valve annulus during the cardiac cycle. Lastly, it should be noted that all measurements with velocity imaging might be inaccurate in patients with high heart rate variability. In the absence of other regurgitant lesions, a rare situation in primary MR, RVol can also be calculated by subtracting the right ventricular stroke volume from the LV stroke volume. However, the calculation of the right ventricular stroke volume is less reproducible due to the extensive trabeculation of the right ventricle.

Late gadolinium enhancement CMR (images obtained 10–20 min after injection of contrast) is widely used to assess cardiac fibrosis in various cardiomyopathies. In contrast, very few studies have investigated cardiac fibrosis by CMR in primary MR. For instance, Han et al., using 3D high-resolution late gadolinium enhancement CMR imaging, showed the presence of focal myocardial fibrosis in the papillary muscles in some patients with mitral valve prolapse and complex ventricular arrhythmias [ ]. Also, the presence of LV remodeling seems to be associated with the presence of myocardial fibrosis in primary MR [ ] ( Figure 16.23 ). In addition, the blood-to-leaflet contrast ratio was also increased in these patients, which might reflect the significantly expanded spongia layer with proteoglycans in the myxomatous valve. In secondary MR, CMR can play a major role in the evaluation of the extent of myocardial necrosis, which may limit the extent of functional recovery after revascularization or of functional recruitment in resynchronized patients [ ].

16.13
Multislice cardiac computed tomography
Experience with multislice cardiac computed tomography (MSCT) in MR is still limited but may be considered for quantifying mitral and coronary calcification or to assess coronary artery disease preoperatively [ ] ( Figure 16.24 ). Given its high spatial resolution, MSCT can accurately delineate MV anatomy, and it is uniquely useful in demonstrating the size and course of the coronary sinus in relation to the mitral annulus and circumflex coronary artery, an important consideration for some transcatheter mitral valve devices [ , , ].

MSCT, from thin-section reconstructions, allows direct visualization of the thickening and calcification of the leaflets, mitral annulus, chordae and papillary muscles. A recent study showed good correlation with 3D TOE concerning measurements of mitral valve geometry and leaflet lengths and angles. The extent of calcification of the mitral annulus might even be better demonstrated than by echo or CMR [ , ].
The inner contour of the regurgitant orifice can be manually outlined on reconstructed cross-sectional images of the mitral valve in oblique short-axis. Two studies have demonstrated that the MSCT-derived anatomical regurgitant orifice area correlates well with EROA measured by echocardiography [ , ]. Chamber dimensions can be obtained after post-processing of the images with a contour-detection algorithm and manual correction, if not satisfactory. The RVol can be generated as the difference between the calculated stroke volume of the left and the right ventricle and has recently been shown to have a good correlation with the RVol obtained by CMR. Although MSCT might be particularly useful in the preoperative setting because it provides complementary information on the coronary arteries (high negative predictive value in patients who are at low risk of atherosclerosis), a routine clinical implementation is not yet recommended.
16.14
Conclusion
For assessment of MR, 2D/3D TTE and TOE remain the first-line imaging modalities. In patients with poor echogenicity, CMR is the imaging modality of choice for assessment of MR. Routine assessment with cardiac CT is not yet recommended, but its use is steadily increasing. In the future, it is likely that CMR and MSCT will be increasingly used for pre-procedure assessment and planning of intervention procedures in patients with MR.
Tricuspid and pulmonary valves
- D. Muraru
- M.P. Marra
- L.P. Badano
- M.P. Marra
- University of Padua, Padua, Italy
Echocardiography is the primary imaging modality for initial and longitudinal evaluation of patients with right-sided valvular heart disease. Cardiovascular magnetic resonance (CMR) has emerged as an additional or alternative modality for providing information not only about the valve itself, but also about the pulmonary artery (PA) and the consequences on the right ventricle (RV), including myocardial scar or fibrosis. This chapter highlights the use of current imaging modalities in state-of-the-art assessment of right-sided valvular heart diseases, with emphasis on indications as well as on strengths and limitations of each technique.
16.15
Tricuspid valve
TV disease commonly occurs in combination with left-sided heart disease. Despite its former neglect, TV has recently gained more consideration as physicians become aware of the detrimental consequences of severe TV regurgitation on patient survival, functional capacity, and surgical risk [ ].
16.15.1
Anatomy
TV is the largest and most caudally located among the four cardiac valves. Classically, TV is described as having three leaflets ( Figure 16.25 ), however a great variability in the number of leaflets (from 2 to 4) has been described in autopsy studies [ , ]. Normal TV is thinner than the mitral valve due to lower right-sided pressures. Tricuspid annulus (TA) has an elliptical saddle-shape and is a highly dynamic structure, with up to 40% of area decrease during systole. Effective TV function depends on the structural integrity and functional coordination of all components of TV apparatus, which include leaflets, TA, chordae tendineae, papillary muscles, and ventricular myocardium [ ].

16.15.2
Pathology
The etiology of TV diseases is generally divided into organic (having intrinsic structural changes of TV leaflets) and functional (no structural leaflet abnormalities). While tricuspid stenosis due to rheumatic, carcinoid, or congenital diseases is rather uncommon nowadays, tricuspid regurgitation (TR) is a relatively frequent finding in adult patients. Trivial or mild functional TR without any detectable abnormality of the TV is seen in 65–75% of healthy subjects and is considered benign, while significant functional TR is associated with poor prognosis. Only a minority of severe TR (8–10%) is organic, and due to various etiologies: prolapse (myxomatous disease), endocarditis, rheumatic, traumatic, carcinoid, tumors, congenital, induced by leads/catheters, or drug etc. [ ]
In most instances, TR is functional in nature and develops as a consequence of deformation of the TV apparatus, such as dilation and abnormal shape of TA, leaflet tenting, and RV dilatation with papillary muscle displacement [ ]. Common conditions evolving with functional TR are left-sided heart valve diseases, pulmonary hypertension, congenital heart defects, and cardiomyopathies [ ].
16.15.3
Imaging
16.15.3.1
2D Echocardiography (2DE)
2DE is the current imaging gold standard for assessing TV disease and is often sufficient for diagnosis. Doppler echocardiography detects the presence of regurgitation, but also enables the understanding of the mechanisms of TR and quantitation of its severity and consequences ( Table 16.4 ) [ ]. However, several views are required to assess TV during a 2DE study, and poor acoustic windows and suboptimal patient body habitus can compromise image quality. Transoesophageal echocardiography is performed when further diagnostic refinement is required, but may result less satisfactory than for left-sided valves, since TV is located farther from the transducer and obliquely oriented with respect to the Doppler beam.
| Parameters | Imaging | Severe TR, if: |
|---|---|---|
| Qualitative | ||
| TV morphology |  | Abnormal/Flail/Large coaptation defect |
| Color Doppler flow |  | Very large central jet or eccentric wall impinging jet |
| CW signal of TR jet |  | Dense/Triangular with early peaking (peak < 2 m/s in massive TR) |
| Semi-quantitative | ||
| Vena contracta width (mm) |  | > 7 |
| PISA radius (mm) |  | > 9 |
| Hepatic vein flow |  | Systolic flow reversal |
| Tricuspid inflow |  | E wave dominant (≥ 1 cm/s) |
| Quantitative | ||
| EROA (mm 2 ) R Vol (ml) |  | ≥ 40 ≥ 45 |
| Supportive | ||
| RV/RA/IVC size | 
| |