Cardiovascular magnetic resonance (CMR) can characterize acute myocardial infarction (AMI) in unique ways and with high quality. Cine CMR can assess left ventricular (LV) volumes, ejection fraction (LVEF), and regional wall motion in ways comparable to a high-quality transthoracic echocardiogram. Late gadolinium enhancement (LGE) is generally considered the reference standard in imaging chronic myocardial infarction and the method works well for AMI as well. CMR stress testing is capable of detecting residual myocardial ischemia. Various important complications of myocardial infarction can be imaged, such as LV dysfunction, thrombus, ventricular septal defect, aneurysm, pseudoaneurysm, and valvular complications. Newer CMR methods for quantifying myocardial T1, T2, T2*, and extracellular volume fraction (ECV) are providing quantitative insights into the pathophysiology and characterize AMI in ways that are not currently possible with alternative modalities. Thus CMR is highly relevant and a powerful diagnostic tool for complex problems in AMI patients.
Cardiovascular Magnetic Resonance for Detecting Acute Coronary Syndrome and Acute Myocardial Infarction
Balanced steady-state free precession (bSSFP) cine CMR has been accepted as a reference standard for assessing LV mass, volumes, and LVEF. Cine CMR is a powerful method for detecting regional wall motion abnormalities, as is evidenced by the diagnostic accuracy of dobutamine stress tests. This is an important set of validations because dobutamine stress testing poses some of the most extreme challenges for assessing regional wall motion (see Chapter 17 ). The diagnostic information must be acquired quickly (usually within about 2 minutes) at a time when the heart rate is 85% of age-predicted maximum and patients may be experiencing angina.
Cine CMR can assess regional wall motion with high image quality, allowing diagnosis of small wall-motion abnormalities with confidence that might be missed by other methods. For example, Fig. 19.1 illustrates a case in which a presumptive diagnosis of clinically unrecognized myocardial infarction could be made based on a focal anteroseptal wall-motion abnormality that was missed on a good-quality noncontrast enhanced transthoracic echocardiogram.

Cine CMR also performed well in detecting acute coronary syndrome (ACS) in patients presenting to an emergency department with at least 30 minutes of chest pain. Both qualitatively and quantitatively, regional wall-motion abnormalities by cine CMR had an accuracy of 82% for ACS, 89% for non–ST elevation myocardial infarction (NSTEMI), and 98% for ischemic heart disease. One important reason cine CMR performed so well may have related to how early patients were imaged after presentation to the emergency department. Specifically, 87% of subjects were scanned before the 4-hour troponin was available. By studying patients within 6 hours of presentation to the emergency department, stunned myocardium offers an additional mechanism that is capable of detecting infarction or unstable angina. When combined with LGE, the sensitivity for AMI increased to 100%. An example of a rest perfusion abnormality in a patient with a normal initial electrocardiogram (ECG) and normal initial troponin is shown in Fig. 19.2 .

However, a single CMR scan of regional wall motion does not differentiate acute from chronic conditions. In patients with no history of myocardial infarction, a definite regional wall-motion abnormality is reasonably specific for coronary artery disease (CAD) even though there are other conditions that can cause regional wall-motion abnormalities, such as myocarditis. However, using T2-weighted imaging to characterize the acuity of regional wall-motion abnormalities, Cury et al. replicated the primary findings of Kwong et al. but improved the specificity for diagnosing ACS.
Plein et al. formally studied the additive value of each available CMR method for diagnosing ACS. In that study, an LV wall motion by cine CMR had lower sensitivity (68%), perhaps as a result of the later timing of the CMR scan during the index hospitalization. In that setting, stress perfusion and CMR coronary angiography were the most sensitive components, and the comprehensive analysis of all methods used had 96% sensitivity. Ingkanisorn et al. also found that stress perfusion CMR had high diagnostic accuracy for detecting patients with possible ACS presenting to the emergency department. An example of a patient with a stress-induced perfusion defect that extends beyond the myocardial infarction is shown in Fig. 19.3 . In that study, CMR did not miss any patients with major adverse cardiac events over about 1 year of follow-up.

A series of studies from Wake Forest University examined the diagnostic accuracy and cost effectiveness of CMR to detect CAD in patients presenting to the emergency department with chest pain. Miller et al. found that use of adenosine stress CMR to assess patients with acute chest pain who were triaged to a chest pain observation unit had lower short-term and 1-year costs than those managed with standard inpatient care. In lower risk patients presenting to the emergency department with chest pain, provider-selected evaluation reduced costs compared with mandated stress CMR. That study was interesting because the primary stress test modality used was transthoracic echocardiography in 62% of patients. The primary provider used stress CMR in 32%, single proton emission computed tomography (SPECT) in only 2%, and computed tomography (CT) in 2%. In the setting of intermediate-risk patients with chest pain in an observation unit with a negative initial ECG and negative initial troponin, CMR was again a cost-effective modality.
Although CMR is not commonly used to evaluate patients with chest pain in the emergency department, these studies demonstrated several important concepts. Cine CMR is a powerful method of assessing global and regional LV systolic function and is useful in patients with acute presentations of possible CAD. However, the multiple ways that CMR can characterize the heart, including stress perfusion, LGE of myocardial infarction, and other methods create an even more powerful diagnostic tool. Despite the relatively high costs of CMR, the modality has high diagnostic accuracy and can be cost effective in the management of patients with possible ACS when applied to appropriate risk categories.
Late Gadolinium Enhancement of Acute Myocardial Infarction
LGE-CMR is accepted as a reference standard method for imaging myocardial scar. Before discussing applications of LGE, it is important to understand the different mechanisms leading to hyperenhancement of AMI versus the fibrotic or collagen scar associated with chronic myocardial infarction. As summarized in Fig. 19.4 , after intravenous injection, gadolinium (Gd)-based contrast agents rapidly enter the interstitial space, as represented by the yellow between cardiomyocytes. Thus contrast-enhanced normal or viable myocardium has a T1 that is shorter than native T1. The intact cell membranes of viable cells exclude Gd-based contrast agents from the intracellular space; hence the dark intracellular space in the diagram. Using inversion recovery methods, the inversion time is adjusted to null normal myocardium, making it appear dark on the LGE images.

Acutely infarcted myocardium enhances more strongly with Gd-based contrast agents than viable myocardium because damage to cell membranes allows Gd into what used to be the intracellular space. This is represented by yellow in both the intracellular and extracellular spaces in Fig. 19.4 . Finally, chronically infarcted myocardium also enhances strongly with Gd-based contrast agents because collagen scar has relatively little cellular volume and thus a large volume of distribution as represented by extensive yellow patches in Fig. 19.4 .
Validation of Late Gadolinium Enhancement in Acute Myocardial Infarction
LGE-CMR is currently the highest-resolution method for detecting AMI and provides an exquisitely sensitive diagnostic test. In animal studies in which histopathology was used as a reference standard for determining what is normal or infarcted myocardium, the bright zones on LGE CMR correlate closely in size and location to the infarct delineated by triphenoltetrazolium chloride (TTC) histopathology. These experiments examined acutely infarcted canine hearts and some experiments included a transient coronary occlusion in a different coronary territory to document that stunned myocardium did not enhance whereas infarcted myocardium did enhance. The bright myocardium on LGE-CMR corresponded closely to the infarcted myocardium in reperfused and nonreperfused canine infarction at 4 hours, 1 day, 3 days, 10 days, 4 weeks, and 8 weeks postinfarction. That study also found no difference in signal intensity between viable myocardium in the area at risk (AAR) versus remote myocardium. In another study using electron probe x-ray microanalysis, Gd concentration was high in the infarcted myocardium but not statistically different between viable myocardium in the AAR versus remote myocardium. The elevations in Gd concentration were 2 to 3 times higher still in the chronically infarcted myocardium than in acutely infarcted myocardium. Failing to find an elevation in Gd concentration in the viable portion of the AAR is likely related to the detection limit of the assay and underpowered statistics owing to small sample size. This concept becomes important when one considers newer data finding CMR abnormalities in the salvaged myocardium ; techniques that detect abnormalities in the viable AAR are described later in this chapter. Beyond this subtlety, there is general agreement that the hyperenhanced myocardium on LGE images corresponds closely to infarcted myocardium by pathological standards in animals.
Clinical trials helped validate that LGE imaging of AMI is a clinically validated measurement of infarct size ( Table 19.1 ). The infarct size visualized by LGE-CMR correlated with the degree of elevations of creatine kinase-MB (CKMB) or troponin. Several studies demonstrated that the recovery of function could be predicted by the transmural extent of LGE-CMR in AMI patients. The relationship between transmural extent of infarction and recovery of function was used by Kim et al. and Selvanayagam et al. to validate CMR viability imaging in patients with chronic CAD undergoing revascularization. Bullock et al. recommend using a higher transmural extent of hyperenhancement in the context of AMI than recommended for chronic infarction.
| Reference | N | Acute ± Chronic | Major Findings |
|---|---|---|---|
| Ricciardi et al. | 14 6 | Acute Chronic | Microinfarcts were detected in patients who had PCI-related elevations in CKMB. Two patterns of MI were observed: small side branch occlusion and distal embolization. |
| Choi et al. | 24 | Acute Chronic | Within 7 days of AMI, infarct size correlates with peak CKMB. There is an inverse relationship between the transmural extent of infarct and the likelihood of regional recovery of function. |
| Gerber et al. | 20 | Acute Chronic | In patients 4 days after AMI, LGE predicted recovery of regional function better than did perfusion images, which significantly underestimated the amount of irreversible injury. |
| Beek et al. | 30 | Acute Chronic | In patients 1 week after AMI, there was an inverse relationship between the transmural extent of infarction and the likelihood of regional recovery of function. |
| Ingkanisorn et al. | 33 20 | Acute Chronic | In patients 2 days after acute PCI, MI size correlated with peak troponin. AMI size predicted chronic LVEF and regional function. Infarct size decreased from 16%–11% of the LV. |
| Lund et al. | 60 | Acute | SPECT and CMR infarct size correlated, but SPECT had 80% sensitivity and CMR had 100% sensitivity. SPECT missed 6 of 30 inferior AMI. |
| Ibrahim et al. | 33 | Acute | LGE-CMR was superior to SPECT in detecting myocardial necrosis after reperfused AMI because CMR detects small infarcts missed by SPECT. |
| Baks et al. | 22 | Acute Chronic | LGE predicted recovery of function after AMI better than perfusion imaging. |
| Selvanayagam et al. | 50 24 | Acute Chronic | All patients with a troponin elevation (as low as 3.7 mg/L) associated with PCI exhibited new abnormal LGE. Troponin level correlated with AMI size. |
| Ichikawa et al. | 18 | Acute Chronic | Thickness of nonenhanced myocardium had better diagnostic accuracy than percent transmural enhancement for predicting improvement in systolic wall thickening. |
| Baks et al. | 22 | Acute Chronic | Segments without MVO had early increased wall thickness and late partial functional recovery. Segments with MVO showed late wall thinning and no functional recovery at five months. |
| Gerber et al. | 16 21 | Acute Chronic | Infarct size by CT and CMR correlated well ( r = 0.89), although the two standard deviation limits of agreement were about 35 g. Interobserver agreement and interstudy agreement were good. |
| Kumar et al. | 37 | Acute Chronic | In patients with inferior AMI, LGE CMR detected right ventricular infarction more frequently than echocardiography or electrocardiography. |
| Ibrahim et al. | 78 | Acute | AMI was detected more often by CMR than by SPECT, specifically for non–Q-wave AMI and for the left circumflex territory. |
| Plein et al. | 25 | Acute | LGE mass is highest in Q-wave AMI, intermediate in non–Q ST elevation AMI, and lowest in non-ST elevation AMI. |
| Kim et al. | 282 284 | Acute Chronic | Multicenter validation of LGE imaging of both acute and chronic infarction. |
| Total | 764 | Acute |
With a slightly different interpretation of the LGE findings, Ichikawa et al. found that the amount of viable-appearing myocardium was a better predictor of functional recovery postinfarction than the transmural extent of hyperenhanced myocardium. In a study of patients with AMI, Baks et al. found that LGE could predict recovery of function distal to a totally occluded coronary artery, but the effect was modulated by the presence or absence of microvascular obstruction.
LGE-CMR imaging for AMI appears to be more sensitive than SPECT imaging. This concept was already known for chronic infarction. In the setting of AMI, three studies showed that LGE-CMR was more sensitive than SPECT for detecting the infarct. These studies showed that CMR was more likely to detect small infarcts, as evidenced by lower troponin elevations, NSTEMI, and infarcts in the circumflex territory.
As further evidence of the benefits of high-resolution CMR imaging of AMI, Ricciardi et al. helped prove the sensitivity of LGE-CMR imaging by detecting two types of embolic infarction in patients undergoing percutaneous coronary intervention (PCI) who had mild elevations in creatine kinase-MB. The microinfarcts ranged in size from 0.7 to 12.2 g. Selvanayagam et al. also found new abnormalities by LGE-CMR in patients with post-PCI elevations in troponin and could detect abnormities in all patients, including troponin levels as low as 3.7 µg/L. Before those studies, there had been debate over whether the post-PCI biomarker elevations truly represented infarction because older imaging methods generally could not reliably detect abnormalities in <10% of the myocardium.
The culmination of validation studies of LGE as an imaging marker of infarction was a multicenter clinical trial led by Kim et al. As a study intended to get US Food and Drug Administration approval for the contrast agent gadoversetamide, participants were randomized to one of four doses of: 0.05, 0.1, 0.2, or 0.3 mmol/kg. The sensitivity of CMR for detecting infarction increased with rising dose of gadoversetamide reaching 99% for AMI and 94% chronic infarction. Likewise, the accuracy of LGE-CMR for identifying infarction location also increased with rising dose of gadoversetamide and was 99% for AMI and 91% for chronic infarction.
Overall, the transmural extent of infarction predicts recovery of function in patients with either acute and chronic infarction although the relationship is tighter for chronic infarction.
Microvascular Obstruction After Acute Myocardial Infarction
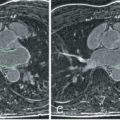
LGE is dependent on enough perfusion to get Gd to the myocardium. In a nonreperfused AMI, there will be a severe perfusion defect (see Fig. 19.2 ) unless there is significant collateral circulation. In the setting of successfully opening the epicardial coronary artery, microvascular obstruction (MVO) and related “no-reflow” phenomena can prevent reperfusion in the core of the MI as shown in Fig. 19.5 . CMR is generally accepted as the best noninvasive imaging test for detecting MVO.

There are four interrelated mechanisms that can lead to MVO or no reflow: ischemic injury, reperfusion injury, distal embolization, and individual susceptibility. Although vascular tissue has lower energetic requirements than cardiomyocytes, if the duration and severity of ischemia is severe enough, then severe ischemic capillary damage may occur. Endothelial protrusions, swelling of endothelial cells, and endothelial blebs may block the capillary lumen. Gaps in the endothelial may open and allow red blood cells into the extravascular space, a situation that will lead to abnormal iron in the interstitial space of the myocardium. Ischemic injury to cardiomyocytes can lead to edema and increased pressure in the tissue. When tissue pressures exceed capillary perfusion pressure, edema can further decrease perfusion through the myocardium. Reperfusion injury is accompanied by white blood cells, platelets, and accompanying vasoconstrictors such as endothelin and thromboxane-A2. Reperfusion injury to the myocardium may exacerbate tissue edema and may cause release of oxygen free radicals that cause further damage to cardiomyocytes and the vasculature. Distal embolization of thrombus and cholesterol plaque can compromise microvascular reperfusion despite effective epicardial PCI. Finally, some patients may have genetic or other susceptibilities to microvascular injury that modulate the likelihood of this complication of AMI.
Judd et al. reported that the hypoenhanced regions within an otherwise contrast-enhanced AMI corresponded to regions of no reflow in a 2-day reperfused canine model. That same year, Lima et al. published that similar findings were observed in patients after AMI when imaged by contrast-enhanced CMR. Shortly thereafter, Wu et al. published one of the first CMR prognosis studies. They found that patients with AMI characterized by having MVO had higher adverse cardiovascular event rates than patients without MVO.
The relative prognostic significance of different CMR imaging characteristics will be addressed more completely later in this chapter.
T1, T2, T2*, and ECV as Quantitative CMR Characteristics of AMI
Signal intensity on CMR depends on the T1, T2, T2*, and proton density characteristics of different tissues and fluids in the body. In the last several years, it has become possible to produce quantitative maps of myocardial T1, T2, and T2* and ECV. The application of these methods to characterization of AMI has led to interesting and objective observations that indicate CMR can image and differentiate infarcted myocardium, salvaged myocardium, and remote myocardium.
Using LGE imaging alone to estimate the AAR in AMI, Hillenbrand et al. reported that one can infer the presence of salvaged myocardium based on a transmural extent of AMI that is less than the full wall thickness. The concept behind this method is based on the wavefront theory of AMI where the infarction starts at the endocardium and progresses toward the epicardium with longer durations of coronary occlusion. One should note that the sensitivity and specificity for predicting recovery of function by that method was about 70% based on the optimal point on the receiver operating characteristic (ROC) curve but was substantially better than occlusion time. That study also did not make a measurement of the size of the perfusion defect.
Another method for estimating the AAR in AMI using only LGE imaging is based on a measurement of the endocardial surface area of the hyperenhanced AMI on LGE-CMR. This method is also based on the wavefront theory of how MI develops. The endocardial surface area method extrapolates transmurally from the endocardial extent of AMI to define the AAR. This method worked well in the first clinical study of 83 patients with AMI when compared with angiographic estimates of the AAR and as a constraint of the AMI size by LGE. Using CMR endocardial surface area and the same angiographic indices of AAR, Wright et al. found weaker correlations between these measures of AAR than with T2-weighted estimates. In a study of 197 patients, Fuernau et al. found that AAR was reliably assessed by T2-weighted CMR. They found that the endocardial surface area underestimated the AAR in patients with high myocardial salvage, such as aborted infarction. Ubachs et al. also found that the endocardial surface area underestimated the AAR, particularly in patients with aborted AMI. These effects are also seen in the careful validation studies of LGE by Fieno et al. where the endocardial surface area underestimates the circumferential extent of the fluorescent marker of the AAR in multiple cases in those canine infarcts.
Several alternative CMR tissue characterization methods have been proposed and validated to estimate AAR and myocardial salvage including T2-weighted imaging, T2 mapping, T1 mapping, early Gd enhancement, and contrast enhanced bSSFP cine CMR after Gd administration. In general, these methods are based on the concept that the infarcted subset of the AAR is represented by the LGE-CMR performed at least 10 to 20 minutes after injection of Gd. In general, the AAR appears bright on T2-weighted images (long T2) or dark on T1-weighted images (long T1). On quantitative T1 and T2 maps, the AAR will be in the bright range of the color scale because T2 and T1 are long ( Fig. 19.6 ). The mechanisms behind these signal intensity changes include the observations that recent ischemic myocardium is either edematous or has abnormal tissue characteristics associated with postinfarction inflammation.

The original noncontrast method for estimating the size of the AAR used dark-blood, native T2-weighted imaging and was validated in a reperfused canine infarct model as well as a nonreperfused model. Dark-blood prepared T2-weighted imaging was validated against human SPECT imaging of the AAR by Carlsson et al. on day 1 and day 7 after AMI. This is the most widely used CMR method for imaging the AAR and has been used in many clinical trials. An example of a T2-weighted image from a patient with AMI is shown in Fig. 19.7 .

Related posts:
 Use of Navigator Echoes in Cardiovascular Magnetic Resonance and Factors Affecting Their Implementation
 Clinical Cardiovascular Magnetic Resonance Imaging Techniques
 Atherosclerotic Plaque Imaging: Coronaries
 Cardiac Iron Loading and Myocardial T2*
 Pulmonary Vein and Left Atrial Imaging
 Noncardiac Pathology
Stay updated, free articles. Join our Telegram channel

Full access? Get Clinical Tree


