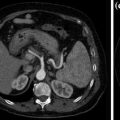
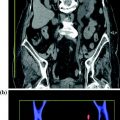
Fig. 6.1
Example of the unenhanced CT densitometry technique in lipid-rich adrenal adenomas. Unenhanced image (a) shows incidental lesions (arrows) in both adrenal glands. ROIs placed within both lesions (b) reveals an attenuation of −3 and 0 HU, respectively, consistent with adenomas
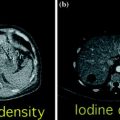
Although the detection of intracellular lipid content is a sensitive and specific finding, many adrenal lesions have an attenuation value greater than +10 HU on unenhanced CT scans, as do almost all malignant lesions (Fig. 6.2). Therefore, these lesions are considered indeterminate, and other tests are generally required for further characterization [2, 3, 7, 12, 21–23].
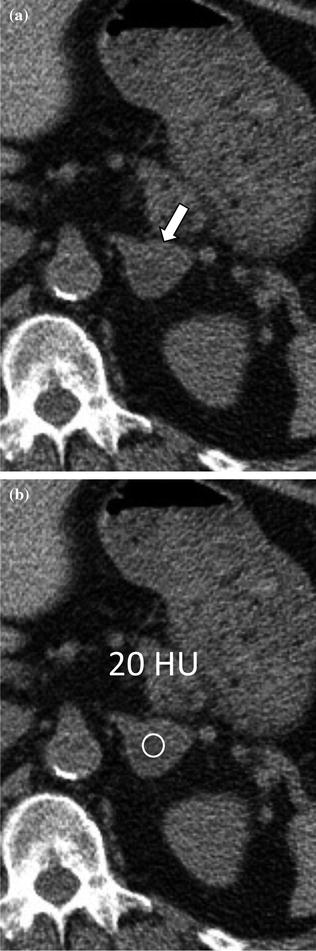
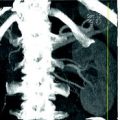
Fig. 6.2
Example of the unenhanced CT densitometry technique in lipid-poor adrenal adenoma. Unenhanced image (a) shows an incidental lesion (arrow) in the left adrenal gland. ROI measurement (b) shows an attenuation value greater than +10 HU. Therefore, this lesion is considered indeterminate, and other tests are required to characterize it
Some authors have suggested that the CT densitometry technique can be improved if a histogram analysis of the distribution of attenuation numbers is used [12, 24]. Bae et al. [24] found the histogram method to be far more sensitive than the +10-HU threshold method in characterizing adrenal lesions on unenhanced images. This method also involves placement of an ROI over approximately one-half to two-thirds of the adrenal lesion surface area. This ROI is then post-processed with a histogram analysis tool that permits calculation of the number and range of pixel attenuation measurements (Fig. 6.3) [12, 24]. Recent studies proposed the use of a 10 % threshold to improve the accuracy of this technique to characterize some adenomas that would otherwise be considered indeterminate by mean CT attenuation alone (Figs. 6.4, 6.5) [25, 26]. A more recent study found that the combination of 18-FDG PET/CT with standard uptake values (SUV) and CT histogram analysis further improves the diagnostic accuracy of adrenal lesions characterization, yielding a sensitivity of 100 % and specificity of 97.3 % [27].
Fig. 6.3
Example of CT histogram analysis in a lipid-rich adrenal adenoma. An ROI is placed within the lesion on an unenhanced image (a). The ROI is then post-processed with a histogram analysis (b) measuring the number and range of pixel attenuation measurements within the lesion. The total number of examined pixels is 135, of which 92 (68 %) have an attenuation measuring less than 0 HU
Fig. 6.4
Example of CT histogram analysis in a lipid-poor adrenal adenoma. An ROI is placed within the lesion on the unenhanced image (a). The ROI is then post-processed with a histogram analysis (b) measuring the number and range of pixel attenuation measurements within the lesion. The total number of examined pixels is 89, of which 20 (22 %) have an attenuation measuring less than 0 HU
Fig. 6.5
Example of CT histogram analysis in an adrenal metastasis. An ROI is placed within the lesion on the unenhanced image (a). The ROI is then post-processed with a histogram analysis (b) measuring the number and range of pixel attenuation measurements within the lesion. The total number of examined pixels is 156, 3 of which (2 %) have an attenuation measuring less than 0 HU
Secondary imaging findings that suggest an adrenal lesion has a benign nature include lesion size (most adenomas tend to measure less than 3 cm), smooth margins and uniform shape [2, 3, 7, 12, 21–23, 28, 29].
Up to 30 % of adenomas contain only small amounts of intracellular lipids (so-called “lipid–poor adenomas”) and cannot be characterized with unenhanced CT densitometry techniques. Additional workup with contrast-enhanced CT or MRI is thus necessary to diagnose such challenging lesions [21–23, 28, 29]. The use of contrast-enhanced CT as an accurate technique for distinguishing between adrenal adenomas and non-adenomatous lesions was first described in the late 1990s. Boland et al., [30] first demonstrated that non-adenomatous adrenal lesions have significantly higher attenuation than adenomas on delayed CT scans obtained at arbitrarily chosen times (between 6 and 30 min) after the administration of contrast media. In particular, it was noticed that intravenous contrast media tended to “washout” much faster, sometimes as early as 3 min, from adenomatous lesions compared with non-adenomatous lesions and that the CT attenuation values began to approximate the unenhanced values [12]. Initially, one absolute CT attenuation measurement on a delayed scan was proposed [12, 31]. However, since delayed CT measurements depend on several factors (i.e., type, total dose, and injection rate of intravenous contrast media as well as the cardiac output of the patient), evidence in the literature failed to reproduce high accuracy when attempting to characterize adrenal lesion using an absolute attenuation measurement [8, 12, 32]. It was observed, however, that the ratio of adrenal attenuation measurements on the washout-delayed scan to the attenuation on the initial dynamic enhanced scan (during the portal venous phase using a 70 s delay) could characterize adrenal lesions with greater precision (Figs. 6.6, 6.7, 6.8) [12, 29]. Korobkin et al. [28] described a threshold enhancement washout value of 40 % for the diagnosis of adrenal adenomas, which yielded a sensitivity of 96 % and specificity of 100 %. The relative percentage washout is calculated by dividing the difference in attenuation (HU) between the portal venous and delayed phases by the attenuation (HU) during the portal venous phase, multiplied by 100 [12, 29]. If an unenhanced scan has been obtained, an absolute percentage washout can be calculated by dividing the difference in attenuation (HU) between the portal venous and delayed phases by the difference in attenuation (HU) between the portal venous and unenhanced phases, multiplied by 100 (Fig. 6.9). Based on the evidence from several studies [12, 29, 30, 33, 34], both absolute and relative percentage washout calculations are reliable, reproducible, and accurate methods for distinguishing adenomatous from non-adenomatous adrenal lesions in daily clinical practice. Although some debate still persists over the optimal threshold value, most authorities agree that, using a 15 min delayed scan, the optimal threshold values are 60 and 40 % for the absolute and relative percentage washout, respectively [2, 3, 7, 12, 21, 23].
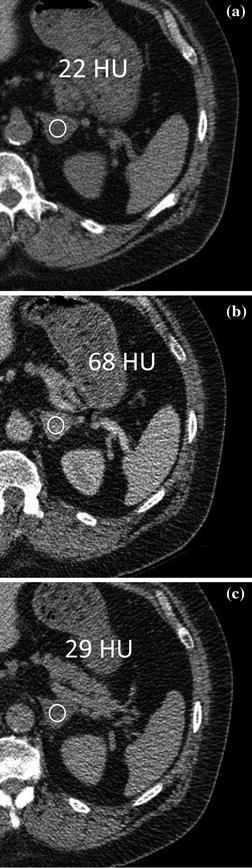
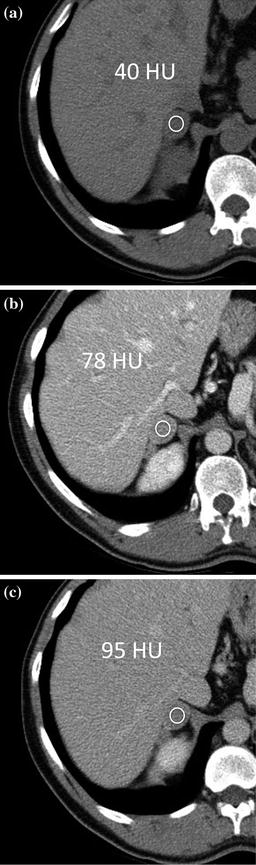
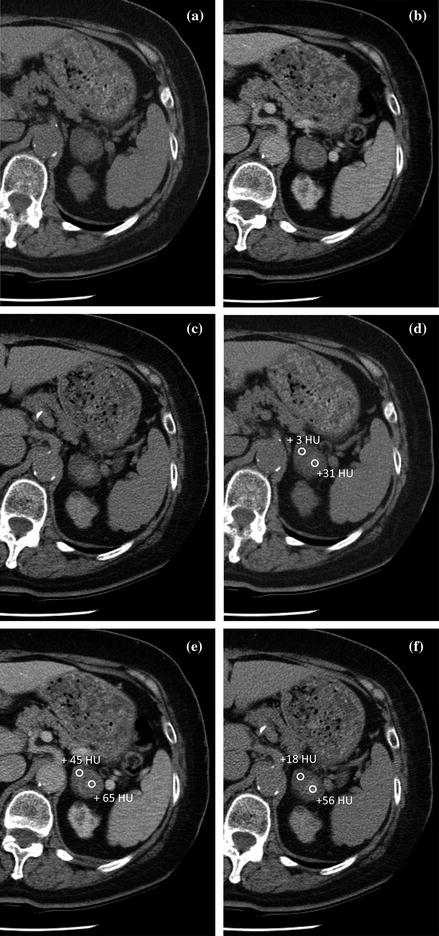
Fig. 6.6
Example of a washout % calculation in a lipid-poor adrenal adenoma. Based on unenhanced (a), contrast-enhanced portal venous (b) and delayed (c) phase attenuation values, the lesion demonstrated absolute washout of 85 % (39/46 × 100) and was characterized as an adenoma
Fig. 6.7
Example of a washout % calculation in an adrenal metastasis from non-small cell lung cancer. Based on unenhanced (a), contrast-enhanced portal venous (b) and delayed (c) phase attenuation values, the lesion showed absolute washout of 45 % (17/38 × 100) and was characterized as a metastasis
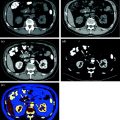
Fig. 6.8
Example of a washout % calculation in an adrenal collision tumor consisting of an adenoma and metastasis from non-small cell lung cancer. The lesion visually shows two different components, anteriorly and posteriorly, on unenhanced (a), contrast-enhanced portal venous (b) and delayed (c) phase images. Based on unenhanced (d), contrast-enhanced portal venous (e) and delayed (f) phase attenuation values, the anterior component demonstrated absolute washout of 64 % (27/42 × 100) and is characterized as an adenoma, The posterior component demonstrated absolute washout of 26 % (9/34 x 100) and is characterized as a metastasis
Fig. 6.9
Summary of absolute and relative washout % calculation
Although the validity of these thresholds by using 15- or 10-minute delayed enhancement acquisition has been demonstrated [19, 29, 30, 33, 34], for efficiency reasons a protocol with a shorter time delay would be desirable. In fact, in some patients, delayed scans cannot be obtained because of the need to modify the CT schedule, and imaging directed at the adrenal glands may thus require a return visit to the radiology department, with additional exposure to radiation and contrast media thereby increasing the cost. A recent study by Kamiyama, et al. [35] demonstrated that the use of a 5-minute delayed CT acquisition can yield a high diagnostic accuracy in the differentiation of adenomatous from non-adenomatous adrenal lesions that is comparable with the accuracy for previous studies which used longer delay times ranging from 15 to 60 min [29, 30, 33, 34]. However, there continue to be concerns that a scan delay shorter than 15 min is not an enough washout time to allow for reliable separation between adenomas and non-adenomas. This is in part due to a recent study by Sangwaiya et al. [36] who refuted results from a previous publication [29] by demonstrating that the washout on a 10-min delayed scan had reduced sensitivity for the characterization of adrenal adenomas [36].
Overall, according to Boland et al. [12], when an adrenal lesion is encountered, it is helpful to employ a diagnostic algorithm for the use of multi-detector CT (MDCT) (Fig. 6.10) [3, 12, 19, 21–23]. The radiologist has to consider the following two points: (1) the age of the patient (metastases are less common in younger patients) and (2) the hormonal tests (to rule-out a hyperfunctioning tumor). The next two steps to be addressed are as follows: (3) whether the patient has a history of malignancy and (4) the availability of prior imaging examinations through the adrenal glands (e.g., a lumbar spine CT scan). If a lesion is stable on serial imaging for at least 6 months, the lesion can confidently assumed to be benign; on the other hand, significant growth, particularly in a patient with an underlying malignancy, strongly suggests metastatic disease [21–23]. If no prior imaging is available, unenhanced CT is required. Those lesions ≤ + 10 HU are deemed lipid-rich and benign. If the CT attenuation is ≥ + 10 HU, a dynamic and delayed contrast-enhanced CT for calculating the % washout is required. Most lesions at this point will be characterized adequately with no need for further testing. However, a small percentage of lesions may benefit from chemical-shift MRI or 18-FDG PET [2, 12]. If a lesion remain indeterminate after these additional examinations, percutaneous biopsy may be considered. Alternatively, for young patients with no history of malignancy, a 6-month interval follow-up CT may be considered [21–23].
Fig. 6.10


MDCT diagnostic algorithm for incidental adrenal lesion [23]
Related posts:
Stay updated, free articles. Join our Telegram channel
Full access? Get Clinical Tree
