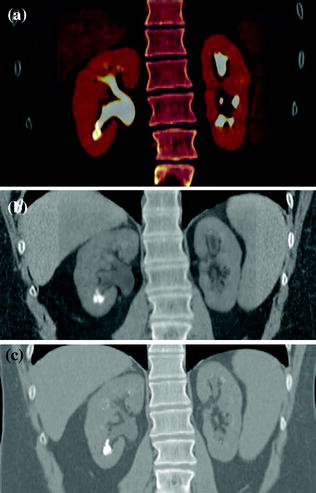
Fig. 4.1
Standard MDCT urography protocol, consisting of unenhanced (a), contrast-enhanced nephrographic- (b), and excretory phase (c) images, with corresponding coronally reformatted reconstruction, in a patient with urothelial lesion arising from the left kidney upper calyx. On unenhanced image (a), the lesion shows soft tissue attenuation and it is barely visible; a moderate contrast enhancement is seen on nephrographic phase image (b). On excretory phase image (c, d), the lesion is clearly visible as filling defect within the renal pelvis filled with dense contrast medium
In light of these applications, CT is recognized as the most sensitive and specific test for the diagnosis of urinary calculi (Fig. 4.2), renal masses, and urothelial lesions (Fig. 4.3). However, the principal disadvantage of CT urography is that there is an increased patient radiation dose associated with the technique; with attention to detail and judicious use of patient selection protocols, the radiation dose should be minimized. So, the outstanding question is essentially whether there are categories of patients for whom the increased sensitivity and specificity of CT urography justify the increased radiation dose. The obvious category comprises those patients with suspected urological cancer and, in particular, patients whose own risk factors for urological malignancy include increasing age (>40 years), smoking, macroscopic compared with microscopic hematuria (4:1), and exposure to aniline dyes. In these patients, a reasonable strategy to limit radiation dose exposure is considering CT urography as the final step of the urologic evaluation, always and only after the patient undergoes urinalysis and cystoscopy.
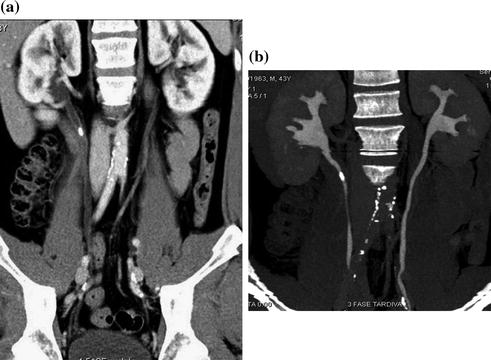
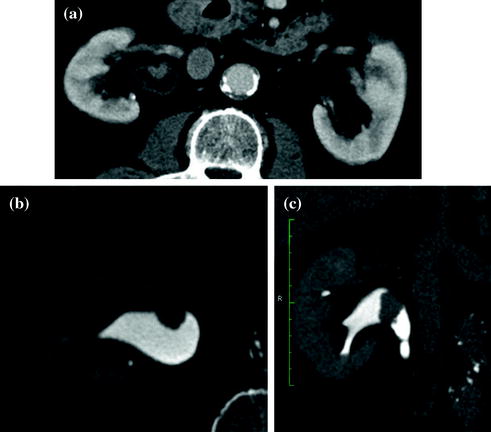
Fig. 4.2
Coronally reformatted CT images in a patient having a non-obstructing stone located in the upper right ureter. A mild hydronephrosis with non-obstructing stone is seen on contrast-enhanced parenchymal phase image (a). Simultaneous excretion of contrast medium, with no further dilatation of the right ureter, is seen on excretory phase image (b)
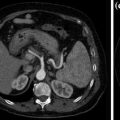
Fig. 4.3
Axial and coronally reformatted contrast-enhanced nephrographic- and excretory phase images in a patient with urothelial lesion of the right renal pelvis. A moderately enhancing vegetans lesion is seen on axial contrast-enhanced nephrographic phase image (a). On axial (b) and coronally reformatted (c) excretory phase images, the lesion is clearly visible as filling defect within the renal pelvis full of dense contrast medium
4.2 State of the Art of Conventional (Multi-detector) CT
MDCT urography is today recognized as state-of-the-art imaging modality in the evaluation of hematuria. It allows fast and high-resolution volumetric scanning of the urinary tract in a single comprehensive examination, termed “one–stop–shop modality,” offering several three-dimensional post-processing features including multi-planar reformations (MPR) and maximum intensity projection (MIP) images (Fig. 4.4) [1–3, 7].
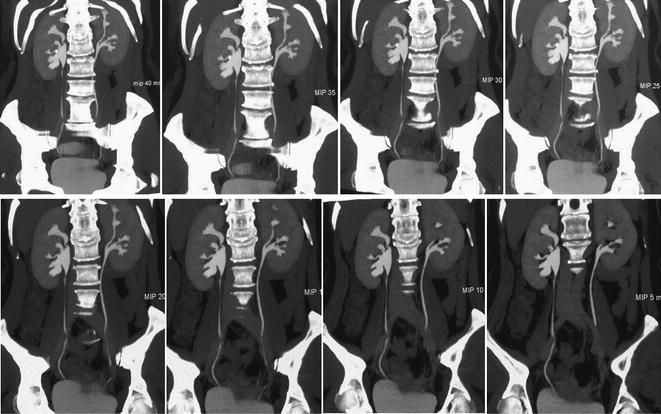
Fig. 4.4
Coronally reformatted MIP images at different thickness (40–5 mm) in a patient with left Bertin’s column hypertrophy and associated double renal collecting system
For most of the different CT urographic techniques, no special preparation is necessary. Oral hydration (usually 500–700 ml of water to drink in the waiting room) and voiding before starting the examination of the patient are two basic pre-requirements for CT urography. In many centers, in order to achieve an optimal distension of the excretory system and to dilute iodine contrast medium otherwise too dense, a diuretic-enhanced CT urography technique is performed with the additional injection of low-dose furosemide (between 5 and 10 mg, i.e., an individual dose of 0.1 mg furosemide per kg of body weight) before the beginning of CT examination. Several studies have demonstrated that the use of low-dose diuretics provide benefits for obtaining accurate depiction of the urinary tract morphology and fine anatomic details, such as calyceal fornices visualization (Fig. 4.5) [1, 13].
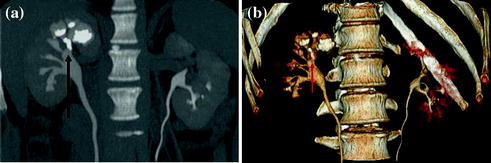
Fig. 4.5
Coronally reformatted excretory phase image with corresponding VRT image in a patient with intra-renal calculosis (arrow). Both excretory images provide an accurate depiction of the urinary tract morphology and calyceal fornices visualization
The first step of CT urography examination is always unenhanced acquisition, from the upper renal pole to the pubic symphysis. In particular, care has to provide on the topogram to include the entire bladder. Afterward, as with conventional excretory urography, a single intravenous bolus of contrast medium is usually administered in CT urography, as well. The volume of the contrast material bolus ranges from 100 to 150 ml, administered at a rate of 2–3 ml/sec [1, 3, 7, 10, 11, 13].
Any urographic imaging technique presupposes at least one data acquisition during the excretory phase. Thus, some authors simply use a single-phase CT urographic protocol [14]. However, in the common sense, to exploit all the potential of this technique, CT urography is understood as a combination of renal CT plus CT of the contrast-enhanced upper urinary tract. Therefore, in most centers, a three-phase CT urographic protocol, consisting of unenhanced, nephrographic, and excretory phases, is performed [1, 3, 7].
During any CT urography acquisition protocol, some tricks, such as abdominal compression (“compression CT urography”) or the injection of a saline chaser bolus, to improve the distension of the upper urinary tract can be adopted [15–17]. Some authors suggest that a significant improvement in the opacification of the middle and distal ureters on the post-release excretory phase scan is achieved, whereas other authors report that no significant difference in ureteral distension exists on CT urography without compression. Several studies have utilized intravenous saline chaser injection technique [15, 16]. As diuretic-enhanced CT urography technique, supplemental hydration may improve the distension of the urinary tract by increasing the urine volume, but also causes endoluminal dilution of the excreted amount of contrast material. Several studies found a significant improvement in the opacification of the pelvicalyceal system and the proximal ureters [15–17]. However, the opacification of the middle and distal ureteral segments does not profit significantly from saline chaser injection [1].
An alternative to the single-bolus injection technique with subsequent three-phase acquisition protocol is represented by the “split-bolus CT urography”. Using the split-bolus technique, one injects initially only 40–50 ml of contrast medium. After a delay of several minutes (generally 6–7 min), another 80–110 ml of contrast material is administered, and then, a CT scan is obtained after a delay of 90–100 s. The split-bolus technique generates a combined nephrographic and pyelographic phase, which allows for a simultaneous assessment of the renal parenchyma in the nephrographic phase and the pelvicalyceal system in the excretory phase by acquisition of only a single CT scan. In particular, with first bolus of contrast medium, urinary excretion of contrast medium is achieved, whereas the renal nephrogram is obtained with the second bolus [1, 18, 19].
MDCT urography usually produces about 300–700 slices per series, making workstation review mandatory. Axial images, reconstructed with a thickness of 5 mm, are for the most part sufficient for diagnosis and MPR images used for display. Many authors recommend wide window settings for the evaluation of the urothelium and calyceal details on excretory phase images, because artifacts from dense endoluminal contrast material are less disturbing (Fig. 4.6) [1, 3, 19]. Tiny neoplastic lesions lying in the axial plane are hard to identify on axial images, so MPR review is generally recommended [20–26]. From the excretory phase multi-slice volumetric dataset, thin-slab or thick-slab maximum intensity projection (MIP) images and volume rendering (VR) images can be reconstructed to obtain typical urographic views similar to conventional urograms (Fig. 4.7).
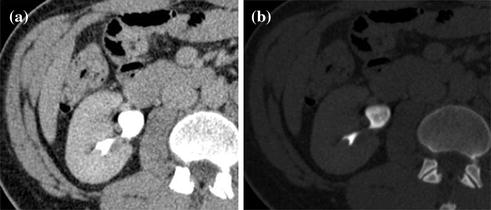
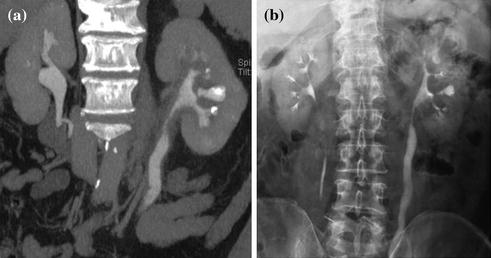
Fig. 4.6
Axial excretory phase images with different windowing levels in a patient with urothelial tumor of the right renal pelvis. Note that soft tissue window setting (a) is highly affected from noise and dense endoluminal contrast material hides the presence of subtle alterations, whereas a wide window setting (b) offers an almost noise-free evaluation of urothelium and calyceal details
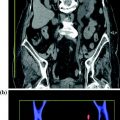
Fig. 4.7
Coronally reformatted contrast-enhanced excretory phase image (a) with corresponding conventional urogram image (b) in a patient with infiltrating urothelial lesion of the left renal pelvis
As one may guess, numerous different examination techniques exist to put MDCT urography into operation, including various ways in administering the contrast agent and achieving complete urinary tract opacification. However, while a substantial homogeneity in diagnostic performances between different CT urography protocols exists, they are dramatically heterogeneous with each other in terms of radiation dose exposure [1, 3, 27–29].
In conventional EU, the delivered effective radiation dose was usually between 1.5 and 4 mSv, depending on acquisition parameters, number of films acquired, patient size and gender. With three- or two-phase CT urography approach, mean effective doses of 20.1 mSv, approximately 5 times higher than those of excretory urography, have been reported. Even, for a four-phase CT urography protocol, the calculated average effective dose is between 25 and 35 mSv [27–32]. Consequently, in the evaluation of patients with a high pretest probability of malignant urothelial disease, the “As Low As Reasonably Achievable (ALARA)” principle should always be kept in mind. In order to contain the radiation dose, the first strategy is to reduce the number of study phases and the scanning coverage. Based on the specific clinical context (e.g., proven urothelial disease), a dual-phase (unenhanced and excretory phases) protocol can be carried out. Adopting the split-bolus technique may represent an optimal compromise to not preclude the possibility of a renal parenchyma evaluation even though the patient does not have a high pretest probability of renal neoplastic disease [1, 18, 19].
More recently, several technologies that are available on commercial CT systems are geared toward radiation dose reduction by a scanning parameters modulation. Dose management technology in CT has led to optimization of CT protocols using angular (x and y-axes), longitudinal (z-axis), or combined (x, y, and z-axes) modulation of the dose; in some modern systems, this can also be combined with 3D adaptive noise filtration [1, 11, 12].
However, current studies are moving in the direction of performing CT urography using a low-tube-voltage dual-energy CT urography with synchronous nephrographic/excretory enhancement. One study demonstrated that the diagnostic quality of low-tube-voltage (80 kVp) excretory phase images is comparable with that of 120-kVp images. Given the significantly lower radiation dose (greater than 50 %) and greater opacification of the urinary system with low-tube-voltage (80 kVp) images, the use of 80-kVp images in the excretory phase of CT urography seems to be feasible. However, this approach is problematic in terms of increased image noise and applicability, especially in the US population due to higher BMI values.
4.3 Spectral CT: Study Protocols and Clinical Applications
The advent of dual-energy CT represents a unique opportunity for CT urography to significantly reduce the radiation dose while ensuring high diagnostic performances.
By exploiting the difference in CT attenuation of different materials as a function of electron densities and photon energies, it allows the identification, separation, and quantification of certain material compositions [33–36]. If materials having sufficiently different K-edges, defined as “a sudden increase in attenuation at photon energy levels just above the K–shell binding energy,” are shown at two different energies (80/100 and 140 kVp), they can be characterized on the basis of variations in photon absorption at different photon energies (e.g., calcium or iodine can be distinguished from soft tissues based on their differences in K-edges) [33–35, 37]. In light of this basic physical assumption, iodinated contrast medium can be completely subtracted to obtain virtual unenhanced images and one of the main purposes of unenhanced images during CT urography (i.e., urinary calculi detection) could be achieved without requiring an unenhanced scan, therefore significantly cutting the radiation dose exposure [33, 36, 37].
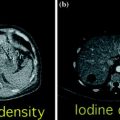
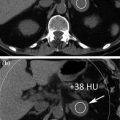
In daily clinical practice, urinary stone detection as well as pre- and post-contrast HU attenuation measurement on the upper and lower urinary tract is crucial to evaluate patients with hematuria, hydronephrosis, urinary tract tumors, congenital anomalies, chronic urolithiasis, and patients’ pre- and post-surgical status. In order to fully omit standard unenhanced acquisition, the first issue deserving to be addressed is whether urinary stones can be detected by means of high-attenuating iodinated contrast medium subtraction from the renal parenchyma or whether collecting system and virtual unenhanced images provide reliable CT attenuation measurements [38].
With the use of a phantom model, one study showed the dual-energy CT iodine subtraction virtual unenhanced technique is capable of depicting urinary stones submerged in iodine solutions [38]. Subsequent clinical studies also demonstrated that virtual unenhanced images reconstructed from nephrographic phase scans are helpful for detecting urinary stones with a sensitivity of 83 and 63 % [39, 40]. All the studies found that most stones appear slightly smaller or less conspicuous on virtual unenhanced images than on the true unenhanced images (Fig. 4.8). This is due to subtraction of some stone signal from the stone periphery along with the iodine signal. In addition, the difference in collimation between dual-energy (1.2 mm) and single-energy (0.6 mm) acquisitions determines a relatively lower z-axis resolution that does not allow separation of the small stones and iodine in the urinary tract because of the volume averaging [41–43]. Similar results have been reported by reconstructing virtual unenhanced images from synchronous nephrographic/excretory enhancement (split-bolus CT urography technique) dual-energy CT images [44]. Furthermore, in all these studies, it emerged that the presence of very dense iodine in the urine leads to insufficient or excessive subtraction of contrast medium (Fig. 4.9). In particular, a recent study showed that highly concentrated iodine causes a breakdown of the iodine subtraction algorithm [38].