Anatomy
The left adrenal gland is located anteromedial to the upper pole of the left kidney. The right adrenal gland is located at a slightly higher level (see ▶ Fig. 10.1, ▶ Fig. 10.2, ▶ Fig. 10.3).

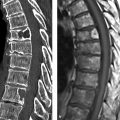
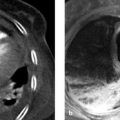
Fig. 10.1 Classic pheochromocytoma. MRI appearance. The signal intensity of the pheochromocytoma ([a], arrow) on T2W images is almost as high as that of bile and CSF. This is particularly evident in the fat-suppressed images (b). The opposed-phase image (d) does not show loss of signal intensity. Note also the relatively central location of the adrenal mass in the body. (a) T2W image. (b) Fat-saturated T2W image. (c) In-phase image. (d) Opposed-phase image.

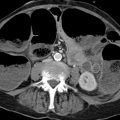
Fig. 10.2 Nonfunctioning incidentaloma of the left adrenal gland. The mass is 3.6 cm in its longest dimension. Note in (a) the different relationships of the right and left adrenal glands to the corresponding kidney. (a) Unenhanced CT. The mass has an attenuation value of 23 HU, which is not diagnostic of adrenal adenoma. (b) In-phase image. The lesion is isointense to spleen. (c) Opposed-phase image. The lesion is hypointense to spleen. This identifies the mass as a (lipid-poor) adenoma. Adrenalectomy was still performed, however, and confirmed the diagnosis.

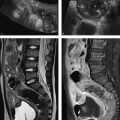
Fig. 10.3 Adrenocortical carcinoma. A mass was detected incidentally in the left adrenal gland ([a], arrow) of a 52-year-old man. The tumor is inhomogeneous and does not show loss of signal intensity in opposed-phase images (c). Its margins are not infiltrative and there is no evidence of metastasis. Because the mass was large (7.4 cm) and its features were not typical of adenoma, adrenalectomy was performed. Histology indicated adrenocortical carcinoma T2 N0 M0. Note the position of the adrenal glands, especially on the (unaffected) right side ([b], arrow). The affected adrenal gland is located almost in the midline. (a) T2W image. (b) In-phase image. (c) Opposed-phase image.
10.2 Imaging
10.2.1 Ultrasound
Adults
The right adrenal gland is consistently definable with transabdominal ultrasound in adults, whereas the left adrenal gland is not. The region of the left adrenal gland can be visualized but the gland itself cannot be positively identified in most cases. As a result, masses of the adrenal gland cannot be confidently excluded with ultrasound.
Note
If an adrenal mass is detected with ultrasound, there are no sonographic criteria that can narrow the differential diagnosis. Given these limitations, targeted ultrasound scanning of the adrenal glands is almost never indicated in adults.
Nevertheless, the adrenal region should still be located and identified during a complete abdominal ultrasound examination. If the adrenal glands are not specifically examined, masses up to 3 cm in size could be overlooked, especially on the left side. On the right side, the inferior vena cava provides a landmark for orientation. The gland is surveyed from above downward in transverse scans, which can be acquired through an intercostal window. The right adrenal gland is located to the right of and behind the vena cava. The left adrenal gland can be imaged with a flank scan that displays the aorta, spleen, and kidney in one image. The left adrenal region is identified in the triangle between these landmarks and is scanned using the same technique as on the right side.
Children
Note
Ultrasound is the imaging modality of first choice for evaluating the adrenal glands in children.
In children the adrenal glands can be clearly visualized on both sides, especially in newborns. The limbs of the neonatal adrenal glands are on average 1.6 cm long and 3 mm wide. The hypoechoic adrenal cortex and the echogenic medulla are clearly distinct from each other at this time (see ▶ Fig. 10.4). The volume of the adrenal glands decreases by 50% during the first 6 weeks after birth. If the limbs of the adrenal glands in a 6-week-old child are more than 2 cm long and more than 5 mm wide, resembling the large adrenal glands of a newborn, it is very likely than an adrenogenital syndrome is present. The decline in adrenal gland volume is paralleled by an increasing loss of corticomedullary differentiation. By 12 months of age, the sonographic morphology of the adrenal glands is practically the same as in adults. The limbs of the adrenal glands appear hypoechoic with no corticomedullary differentiation.

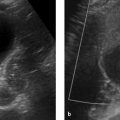
Fig. 10.4 Adrenal hematoma in a preterm infant (36 weeks’ gestation). The newborn was macrosomic with a birth weight of 4,110 g. (a) Routine ultrasound scan reveals a mass in the right adrenal gland, presumed to be a hematoma due to absence of vascularity on color duplex (not shown). (b) The left adrenal gland appears normal for age, with very good corticomedullary differentiation. (c) Follow-up at 6 weeks shows a calcified residual mass (arrow) on the right side.
10.2.2 Computed Tomography
Three CT techniques are available for evaluating the adrenal glands:
Measurement of mean attenuation.
Percentage of pixels with negative attenuation values (histogram analysis).
Measurement of contrast medium washout.
Attenuation measurement of an adrenal mass and histogram analysis exploit the high fat content of most adenomas. An adrenal mass with a CT attenuation of 10 HU or less is definitely an adenoma. This technique has 100% specificity, i.e., there are no false-positives for adenoma and there is no chance of mistaking an adenoma for a metastasis. However, only about 70% of adenomas have a sufficiently high lipid content to produce a CT attenuation of 10 HU or less. Histogram analysis, determination of contrast medium washout, and chemical shift imaging are methods that are designed to diagnose these lipid-poor adenomas despite their low fat content.
A histogram analysis does not involve computing the arithmetic mean of attenuation values in the region of interest as in ordinary densitometry. Instead, the frequencies of the attenuation values are plotted and the percentage of pixels with negative attenuation values within the adrenal mass or region of interest is determined. Most picture archiving and communication system (PACS) software does not have this capability, but histogram analysis can be performed at the diagnostic console of the CT system. If more than 10% of the pixels in the adrenal mass have negative attenuation values, the mass is definitely an adenoma. Histogram analysis increases the sensitivity of unenhanced CT for the diagnosis of adenomas from 70% to 85%. 1
Frequently, only contrast-enhanced images are initially available. If these images show the necessary attenuation threshold (less than 10 HU, at least 10% negative pixels), then this is sufficient for a diagnosis of adenoma (▶ Fig. 10.5). Use of contrast does not alter the 100% specificity; it changes only the sensitivity, due to so-called pseudoenhancement, which is naturally lower than in unenhanced CT. Nevertheless, even the analysis of contrast-enhanced scans can often eliminate the need to proceed with unenhanced CT or MRI.

Fig. 10.5 CT in suspected hepatocellular carcinoma. An indeterminate hepatic lesion (not shown) was found in a patient with alcoholic cirrhosis of the liver. CT demonstrates a 3.5-cm mass in the right adrenal gland (arrows). Unenhanced CT is not available. The adrenal mass has an attenuation of 28 HU in the arterial phase of enhancement. Histogram analysis shows 15% negative pixels, positively identifying the mass as adenoma.
If an adenoma is very lipid-poor, all techniques based on the detection of a high fat content (CT attenuation, histogram analysis, chemical shift imaging) will fail. One way to diagnose lipid-poor adenomas is with dynamic CT. 2 This technique exploits the fact that adenomas and nonadenomas differ in their enhancement whereas lipid-rich and lipid-poor adenomas have the same washout characteristics. Adenomas enhance more rapidly and intensely than nonadenomas and show faster washout. Contrast washout is determined with a 10-minute delayed scan. If unenhanced CT is available, the absolute washout can be calculated as follows:

If only contrast-enhanced series are available, the relative washout can be determined using the formula:

An absolute washout greater than 60% or a relative washout greater than 40% indicates adenoma.
Caution
Even nonadenomas may show very high washout of enhancement. The specificity of dynamic CT in differentiating adenomas and nonadenomas is only about 90%. 3
This means that a degree of relative uncertainty exists when an adenoma is diagnosed.
10.2.3 Positron Emission Tomography–Computed Tomography
Targeted PET imaging of the adrenal glands is rarely done but may be appropriate in selected investigations such as the detection or exclusion of ▶ pheochromocytoma. More commonly, the adrenal glands are evaluated as part of a FDG PET staging examination in tumor patients. In this case the FDG uptake of the adrenal glands is compared with that of the liver. An analysis of standardized uptake values does not add significant information.
Caution
False-positive and false-negative PET findings are not uncommon in the adrenal glands.
False-negative findings may have various causes. If the primary tumor does not have increased glucose metabolism, its metastases will not show increased FDG uptake. Tumors smaller than 1 cm often escape PET detection, as do tumors with intralesional hemorrhage or necrosis. False-positive findings are most common with adenomas that have increased glucose metabolism. The reasons for this metabolic increase are unclear. Hormonally active adenomas and hormonally inactive adenomas do not differ in their FDG uptake. If the FDG uptake of adrenal lesions is slightly higher than that of the liver, evaluation of the CT component with densitometry and possible histogram analysis may be helpful. 4 In some cases this can establish adenoma and avoid a false-positive PET diagnosis (▶ Fig. 10.6). Occasionally a false-negative PET diagnosis can also be avoided if an adrenal metastasis is so small that it does not present as a mass and is detectable only by its greatly increased metabolism (▶ Fig. 10.7).

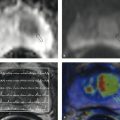
Fig. 10.6 PET-CT in a patient with lung cancer (cT3 cN1 Mx). (a) Staging CT demonstrates a mass in the left adrenal gland (arrow). (b) Glucose metabolism of the left adrenal mass on FDG PET-CT is suspicious for malignancy, with a maximum standardized uptake value of 4.1. The unenhanced CT attenuation of the mass is 6 HU, however. (c) In-phase image. (d) Opposed-phase image shows marked loss of signal intensity, indicating a false-positive PET scan.

Fig. 10.7 PET-CT for staging of lung cancer. (a) The right adrenal gland has a normal CT appearance. (b) Increased glucose metabolism of the right adrenal gland is suspicious for malignancy, however. Two metabolically active hepatic metastases are noted as incidental findings.
10.2.4 Magnetic Resonance Imaging
MRI techniques also exploit the high lipid content of adenomas. The lipid component is detected not by fat-suppression methods but by chemical shift imaging. Due to the different precession frequencies of water and lipid protons, there is a point in time at which the signal intensities from lipid and water protons add together (in phase) and another at which the signals from lipid and water protons are subtracted (opposed phase). A T1W double-echo sequence is used to generate both in-phase and opposed-phase images by suitable selection of the echo times for sampling (at 1.5 T, in-phase at 1.5, 4.6, 9.2 and 13.8 ms; opposed-phase at 2.3, 6.9 and 11.5 ms; the values will vary at different field strengths). The signal intensities of the adrenal mass in the in-phase image are compared with a reference tissue (e.g., liver or spleen). If a definite loss of signal intensity is seen in the opposed-phase image, this indicates a significant lipid component and confirms a diagnosis of adenoma (▶ Fig. 10.8). In routine clinical settings, this technique can yield acceptable results without taking ROI measurements or calculating ratios; the subjective impression of the radiologist is entirely satisfactory.

Fig. 10.8 Lung cancer with bilateral adrenal masses. (a) Staging CT. (b) Staging MRI, in-phase image. The left adrenal gland is hyperintense to spleen, while the right adrenal gland is isointense to spleen. (c) Staging MRI, opposed-phase image. The left adrenal gland is hypointense to spleen, while the right adrenal gland is still isointense. This confirms the adenoma in the left adrenal gland. An adenoma was not confirmed on the right side. (d) CT 2 months later shows enlargement of the right (metastatic) adrenal gland (arrow), but not of the left (asterisk). New hepatic metastases are noted as incidental findings.
Note
In the case of lipid-poor adenomas with a CT attenuation greater than 10 HU, chemical shift MRI can diagnose the adenomas with a sensitivity of 67% and specificity of 100%. 5 Thus, chemical shift imaging is superior to the measurement of CT attenuation on unenhanced CT.
It should be noted, however, that adrenal metastases from clear-cell renal cell carcinoma may contain so much fat that they show loss of signal intensity in opposed-phase images. This limitation has become clinically important now that the ipsilateral adrenal gland is no longer routinely removed as part of a tumor nephrectomy. Very rarely, metastases from hepatocellular carcinoma or liposarcoma may also show decreased signal intensity in the opposed-phase image.
Other MR techniques have no practical significance, so the imaging protocol for adenoma detection is generally quite short, consisting of a T2W sequence plus T1W in-phase and opposed-phase sequences. Administration of contrast medium is unnecessary, as different adrenal pathologies do not show consistent, significant differences in their enhancement characteristics. Diffusion-weighted (DW) images do not aid in differential diagnosis. More detailed MRI protocols are necessary only for malignant lesions associated with local organ invasion and metastasis.
10.2.5 Adrenal Vein Sampling
Adrenal vein blood sampling is done almost exclusively in patients with primary hyperaldosteronism to determine whether autonomous overproduction of aldosterone is unilateral or bilateral. The adrenal veins are catheterized through a transvenous, inguinal approach under imaging guidance. Aldosterone and cortisol in the adrenal venous blood are compared with levels in peripheral blood drawn from the inguinal sheath, for example. The left adrenal vein opens into the left renal vein. The right adrenal vein opens directly into the inferior vena cava and is therefore more difficult to catheterize (see ▶ Fig. 10.9b, c). Technical details can be found in the relevant literature. 6

Fig. 10.9 Arterial hypertension in primary hyperaldosteronism. CT findings (a) do not permit a definite management decision, so selective adrenal vein sampling is performed (b, c). The ratio of aldosterone to cortisol is 22 for the right adrenal gland, 393 for the left adrenal gland, and 27 for peripheral blood. The test shows a massive increase on the left side and suppression on the right side with a selectivity index greater than 6 for the right adrenal vein. This means that left adrenalectomy is indicated for an aldosterone-producing adenoma on the left side. Left adrenalectomy was subsequently performed and was followed by clinical recovery with a normalization of laboratory values. (a) CT demonstrates a right adrenal adenoma measuring 24 mm × 11 mm and a left adrenal adenoma measuring 28 mm × 21 mm. (b) Venous blood sampling from the right adrenal vein. (c) Venous blood sampling from the left adrenal vein.
10.3 Diseases
10.3.1 Incidentalomas
Brief definition An incidentaloma of the adrenal gland is a clinically silent adrenal mass more than 1 cm in diameter that is detected incidentally in an imaging examination. 7 The incidence of these lesions is approximately 1% in abdominal CT examinations.
Imaging signs The term “incidentaloma” is a tentative working diagnosis that is replaced by a definitive diagnosis once a suitable work-up has been completed. Laboratory tests are done first to exclude subclinical hypercortisolism, pheochromocytoma, and primary hyperaldosteronism. Once subclinical hormonal dysfunction has been excluded, an oncologic work-up should begin. This includes measuring the size of the incidentaloma and determining whether its imaging features are consistent with adenoma. Both criteria are used to estimate the likelihood that the incidentaloma is an adrenocortical carcinoma. 8 Adrenocortical carcinomas smaller than 4 cm are extremely rare. If a lesion of this size has imaging features typical of adenoma, the finding is sufficient to exclude adrenocortical carcinoma. Most adrenocortical carcinomas are larger than 6 cm. Approximately 25% of adrenal masses of this size are adrenocortical carcinomas. Consequently, incidentalomas of this size are always surgically removed, regardless of their imaging features. Even with incidentalomas in the 4 to 6 cm size range that have adenoma-type imaging features, there is still a significant risk of adrenocortical carcinoma, and adrenalectomy is indicated. It is more difficult to find evidence-based criteria for managing incidentalomas smaller than 4 cm with adenoma-type imaging features, and for incidentalomas in the 4 to 6 cm range with adenoma-type features. In both cases the lesions are most likely adenomas, but there is a small degree of residual uncertainty. Because there are no current study data on the most effective way to resolve this uncertainty, management decisions should be made case by case. Yearly biochemical follow-ups for a 5-years are recommended for unresected tumors (▶ Fig. 10.10).

Fig. 10.10 Algorithm for the management of incidentalomas.
Pitfalls
Occasionally the term “incidentaloma” is used synonymously with “benign adrenal mass.” This is inaccurate. Incidentaloma refers only to an adrenal mass that has been detected incidentally: by definition, it is uncertain whether the lesion is benign or malignant. Algorithms have been developed specifically for making this determination.
The most common radiological error is to describe the incidentaloma without investigating it further. The necessary endocrine work-up is very often omitted, and it is equally common to omit differentiating studies such as histogram analysis and chemical shift imaging. Thus the lesion remains unidentified, even though its identity could often be established with a proper work-up.
The differential diagnosis of incidentaloma is usually limited to a possible metastasis. The question of greatest interest, however, is whether the incidentaloma could be adrenocortical carcinoma, since patients could benefit from the resection of that lesion but not from the resection of a metastasis.
Incidentalomas smaller than 4 cm that have adenoma-type imaging features are commonly resected. This is a mistake, because nonfunctioning adenomas have no pathologic significance.
Key points Incidentalomas are incidentally detected adrenal masses. Algorithms are available for their endocrinologic and oncologic investigation. “Incidentaloma” is unacceptable as a definitive diagnosis.
10.3.2 Functional Disorders
Hypercortisolism
Brief definition Endogenous hypercortisolism is caused in 20% of cases by the overproduction of cortisol (ACTH-independent Cushing’s syndrome) and in 80% of cases by the overproduction of adrenocorticotropic hormone (ACTH-dependent Cushing’s syndrome). ACTH-independent Cushing’s syndrome is caused by a cortisol-producing adrenal adenoma in two-thirds of cases and by an adrenocortical carcinoma in one-third of cases. Besides these unilateral forms of ACTH-independent Cushing’s syndrome, there are very rare bilateral forms: micronodular ACTH-independent adrenal hyperplasia and macronodular ACTH-independent adrenal hyperplasia.
Selection of modalities Because many adrenocortical carcinomas have already metastasized at the time of diagnosis, CT has significant advantages over MRI as a staging examination. At the same time, a cortisol-producing adenoma can be elegantly demonstrated by MRI. In the very rare cases of bilateral hypersecretion, both CT and MRI should be employed.
Imaging signs Cortisol-producing adenomas average 3.5 cm in diameter (2.0–7.0 cm) and are lipid-rich with an unenhanced CT attenuation less than 10 HU. 9 Cortisol-producing carcinomas, in contrast, average 14.5 cm in size (7.5–21.0 cm) and are lipid-poor; their solid portions have an unenhanced CT attenuation greater than 10 HU. Approximately 90% of carcinomas contain necrotic areas. With micronodular hyperplasia, the adrenal glands are not generally enlarged but exhibit nodules no larger than 4 mm that are well defined because the adrenal gland between the nodules is thin due to the down-regulation of ACTH. The nodules are hypointense on T1W and T2W images because of their pigment content. With macronodular hyperplasia, the nodules are larger than 5 mm and the adrenal glands have the same appearance as in bilateral hyperplasia. The bilateral forms show loss of signal intensity in opposed-phase images; this is a strong diagnostic indicator in patients with ACTH-independent hypercortisolism.
Clinical features The clinical symptoms of hypercortisolism are caused by the metabolic effects of the increased cortisol. Typical manifestations are obesity, moon facies, glucose intolerance, muscle weakness, hypertension, altered mental status, hirsutism, impotence, and fractures.
Hyperaldosteronism
Brief definition This condition results from excessive aldosterone secretion due to an aldosterone-producing adrenal adenoma or bilateral hyperplasia of the adrenal glands. Although it was once thought that 80% of cases were due to adenoma and 20% to bilateral hyperplasia, today it is believed that these percentages are reversed.
Selection of modalities
Note
Related posts:
Stay updated, free articles. Join our Telegram channel

Full access? Get Clinical Tree


