Imaging
Ultrasound
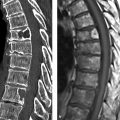
Ultrasound imaging is widely used for examining the kidneys and urinary tract, especially in the emergency work-up of hydronephrosis (▶ Fig. 11.1) and its prevention. The advent of contrast-enhanced ultrasound imaging has significantly increased the sensitivity of this modality in the evaluation of renal masses. 1
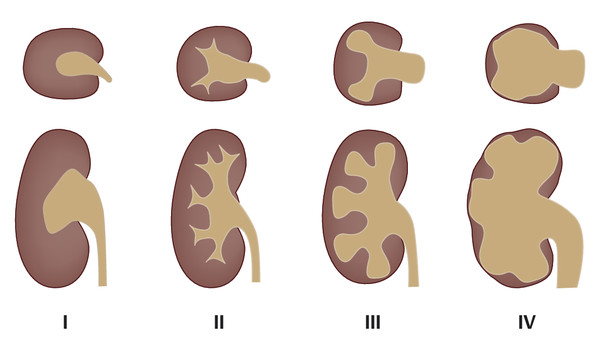
Fig. 11.1 Radiological grades of hydronephrosis. Grade I: dilatation of the renal pelvis without dilatation of the calyces; no parenchymal atrophy. Grade II: dilatation of the renal pelvis and calyces; papillary tips are preserved, no blunting of the fornices, no parenchymal atrophy. Grade III: marked dilatation of the renal pelvis and calyces; signs of parenchymal atrophy (flattening of papillae and blunting of fornices). Grade IV: gross dilatation of the pelvicalyceal system with loss of borders between the renal pelvis and calyces; almost complete atrophy of the renal parenchyma (“hydronephrotic sac”).
Radiography
The sectional imaging modalities, CT and MRI, have increasingly replaced conventional radiography in recent years because they can provide detailed views that are not obscured by superimposed structures. Today the use of conventional radiography and fluoroscopy is limited to selected applications such as evaluation of the urethra, especially in male patients.
Voiding Cystourethrography
Voiding cystourethrography is an excellent study for investigating reflux in the pediatric age group.
Computed Tomography
Computed tomography (CT) is the modality of choice for imaging the kidneys, investigating masses, and numerous other applications. The imaging protocol varies considerably depending on the indication.
Following the publication by Smith et al. in 1996, the excretory urogram, which had been the mainstay for the diagnostic investigation of urolithiasis up to that time, was increasingly replaced by modern low-dose CT. When used in a low-dose protocol, CT provides a sensitivity of 96%, specificity of 99%, and diagnostic accuracy of 98% in the detection of urinary stones. 2, 3 A modern low-dose CT protocol employs a tube voltage in the range of 100 to 140 kV. Because the CT imaging of urinary stones involves the detection of high-contrast structures, radiation dose reduction is achieved principally by reducing the tube current, time product which ranges from approximately 20 to 40 mAs.
The size, shape, location, and even the composition of urinary stones can be evaluated with CT. 2 In patients with known radiopaque stones, follow-up examinations based on a combination of plain radiographs and ultrasound scans can provide sensitivity of 58 to 100% and specificity of 37 to 100%. 4, 5, 6, 7
The introduction of dual-energy technology has taken us beyond simple stone detection to characterization of stones in terms of chemical composition. This is particularly important with regard to further management, in as much as uric acid stones (15% of all stones) are treated medically whereas magnesium ammonium phosphate stones (struvite stones, infection stones; 11% of total) are often treatable by extracorporeal shockwave lithotripsy. On the other hand, calcium phosphate stones (9% of total) and cysteine stones (1% of total) are relatively resistant to treatment by shockwave lithotripsy. Dual-energy CT technology can differentiate uric acid stones from non–uric acid stones with high accuracy on the basis of differences in their X-ray attenuation at different tube voltages. 10, 11 Several studies have also shown that dual-energy CT can differentiate cysteine stones from magnesium ammonium phosphate stones. 12, 13, 14 Dual-energy CT acquires two data sets from the same anatomical region at different X-ray energies (80 and 140 kV or 100 and 150 kV). Stone discrimination is based on the principle that the attenuation properties of different tissue components of high atomic number [and hence high nuclear charge] differ from each other as a function of the applied tube voltage. In multiphase examinations of the kidneys with contrast medium, the voltage-dependent differentiation of calcium and iodine also enables us to omit the acquisition of an unenhanced phase because a “virtual unenhanced series” can be generated from the dual-energy CT data sets.
Another advantage of CT over excretory urography is the ability to image the renal parenchyma and ureters in a single examination. In patients with abdominal trauma, CT permits a rapid diagnostic evaluation for hemorrhage and ureteral injury. The main disadvantages of CT relate to cumulative radiation exposure from multiphase protocols and the use of iodinated contrast medium in patients with impaired renal function. However, further technical advances in CT with regard to detector technology and iterative reconstruction techniques that provide diagnostic images despite lower doses of contrast medium and lower radiation dose will eliminate most of these limitations in the years ahead.
A multiphase protocol should be used in the investigation of renal masses. An unenhanced spiral acquisition permits accurate evaluation of enhancement in postcontrast acquisitions, since renal masses may already be hyperdense on precontrast scans. The same tube voltage and current should be used in all phases to ensure that later measurements of attenuation values will not be distorted and unevaluable due to a different signal-to-noise ratios. Assuming that constant scan parameters are maintained, an attenuation increase of 10 HU is considered the threshold value for contrast enhancement.
In contrast-enhanced imaging of the kidneys, various phases are distinguished in both CT and MRI:
Corticomedullary (arterial) phase: This phase begins approximately 20 to 30 seconds after injection of contrast medium, depending on the cardiac stroke volume. The arteries are clearly depicted in this phase, and veins are also defined owing to the high volume of renal blood flow. Malignant tumors such as renal cell carcinoma are hyperperfused, and most are clearly visualized in the arterial phase.
Venous phase: This phase begins approximately 50 seconds after injection of contrast medium. The late venous phase begins at approximately 90 seconds.
Parenchymal (nephrographic) phase: This phase is reached approximately 100 seconds after injection of contrast medium. The parenchymal phase is best for detecting malignant tumors, as hypervascular tumors appear hypodense at this time. Consequently, this is the only mandatory phase that is stipulated in current recommendations.
Urographic phase: This delayed phase, characterized by the renal excretion of contrast medium, begins approximately 5 minutes after injection of contrast medium. Contrast medium fills the renal pelvis at this time, allowing urographic phase imaging.
Note
In CT the urographic phase can be combined with the nephrographic phase to reduce radiation exposure. This is done by injecting an initial contrast bolus of approximately 40 mL immediately after the unenhanced series. A second bolus with the rest of the contrast dose is injected 5 minutes later. Spiral acquisition is started after a delay of 100 seconds and displays the nephrographic phase for the renal parenchyma, while the renal pelvis and ureter are already opacified from the first bolus.
Magnetic Resonance Imaging
A standard magnetic resonance imaging (MRI) protocol for the kidney and urinary tract should consist of the following sequences:
T2W sequences: Coronal T2W sequences can detect inflammatory changes such as a psoas abscess in the retroperitoneum. Axial T2W sequences, with their black-blood information, are particularly useful for excluding a possible tumor thrombus in the renal vein secondary to advanced renal cell carcinoma. Additionally, T2W sequences can supply key diagnostic information on pheochromocytoma and renal cysts owing to their specific signal characteristics. They are also excellent for the visualization of lymph nodes.
T1W sequences: In-phase and opposed-phase GRE sequences are useful for the detection of cytoplasmic lipid (not always grossly visible) and thus for the evaluation of lesions such as ▶ adrenal adenoma. In these sequences, images are acquired at two different points in time—once when the lipid and water protons are in phase (in-phase image) and once when they are out of phase (opposed-phase image). Newer 3D GRE techniques such as VIBE (volume-interpolated breath-hold examination) or LAVA (liver acquisition with volume acceleration) make it possible to cover a large imaging volume, such as the entire kidneys in the arterial or nephrographic/urographic phase during one acquisition of less than 30 seconds’ duration. These techniques also permit the sequential acquisition of a complete dynamic series (unenhanced, arterial phase, nephrographic phase, late venous phase, and urographic phase). Three-dimensional volumes can be acquired for multiplanar reconstructions, which are very helpful for identifying normal variants. A 3-T scanner can achieve slice thicknesses of 2 mm owing to the higher intrinsic signal intensities in the higher field. A 1.5-T scanner can achieve a slice thickness of 3 mm with a good signal-to-noise ratio.
Diffusion-weighted imaging (DWI): DWI employs two additional diffusion gradients for the measurement of brownian molecular motion. This supplies information on tissue cellularity, i.e., the density of cells in a particular tissue entity or mass. Various authors have shown that determination of the apparent diffusion coefficient (ADC) in DWI can discriminate among different tissue entities based on differences in their cellularity. 15, 16 The ADC has become a useful indicator in oncologic and other routine settings, especially in the diagnosis of pyelonephritis and the exclusion of renal abscess. 15, 17
11.1.2 Anatomy and Congenital Variants
Anatomy
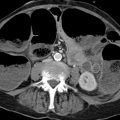
The kidneys are retroperitoneal organs located adjacent to the spinal column in the lumbar recess. They are encapsulated by Gerota’s fascia. This renal fascia is open medially and encloses the perirenal space, which is occupied by perirenal fat. The space outside Gerota’s fascia is called the pararenal space. Gerota’s fascia acts as a barrier to the spread of pathologic processes such as collections of extrapancreatic fluid due to pancreatitis or the spread of hematoma due to renal hemorrhage (▶ Fig. 11.2). The renal hilum is normally rotated slightly forward. The ureters descend on the psoas muscle (a useful imaging landmark) into the pelvis, cross over the common iliac artery and vein, and open at the trigone in the bladder fundus. The bladder trigone is a triangular region in the bladder wall located between the ureteral orifices and the origin of the urethra. The wall structure prevents any creasing of the bladder wall in this region, which keeps the orifices patent even in an empty bladder and maintain urinary drainage.
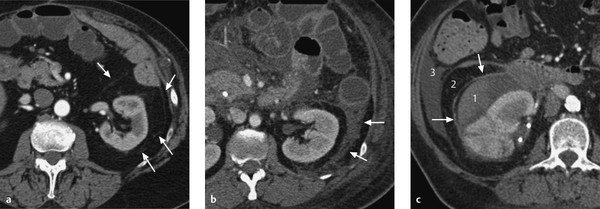
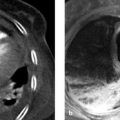
Fig. 11.2 Gerota’s fascia. (a) Normal anatomy of the kidney. The renal axis is rotated slightly posteriorly, with the hilum facing somewhat medially. The Gerota’s fascia is visible as an extremely fine line (arrows). The fascia almost completely envelopes the kidney and is open on the medial side. The Gerota’s fascia encloses the perirenal space, which is occupied by perirenal fat. Outside the fascia is the pararenal space, which is occupied by pararenal fat. (b) Acute necrotizing pancreatitis. Extrapancreatic fluid collections surround the Gerota’s fascia (arrows) without penetrating it. (c) Renal hemorrhage. The hematoma fills the perirenal space within the Gerota’s fascia. Some blood has spilled from the medial fascial opening, through which the renal hilum also emerges. The hematoma does not fill the pararenal space (arrows). 1, perirenal space within the Gerota’s fascia; 2, retroperitoneal pararenal space outside the Gerota’s fascia; 3, peritoneal cavity.
Caution
Note that the twelfth rib crosses the kidneys at a 45° angle, and that the left kidney is usually 1 to 2 cm higher than the right kidney and is 1 cm longer. Because of this, close attention should be paid to the posterior costodiaphragmatic recess during percutaneous renal biopsy so as to avoid accidental puncture of the pleura.
Generally the renal parenchyma is approximately 1.5 cm thick. The cortex and medulla are clearly differentiated from each other after IV administration of contrast medium (see ▶ Fig. 11.2). The renal cortex contains the glomeruli, tubules, and vessels, while the medulla (pyramids) contains the collecting ducts and is less vascular. Cortical extensions, called the renal columns, pass between the pyramids to the renal pelvis. Prominent renal columns may be mistaken for masses, especially on ultrasound scans. They can be identified by tracing them back to their origin and noting their continuity with the renal cortex. 18
Congenital Variants
We can better understand possible variants in the anatomy and position of the kidneys by considering their development during the embryonic period. 18 An important factor in renal development is the nephrogenic cord, which arises from the intermediate mesoderm and subdivides into cervical, thoracic, lumbar, and sacral segments. The nephrogenic cord undergoes three developmental phases, which proceed successively in a craniocaudal direction:
Pronephros: The cervical segment of the nephrogenic cord develops into the pronephros, which is nonfunctioning and normally regresses with further development.
Mesonephros: The pronephros is succeeded by the mesonephros, which forms in the thoracic and upper lumbar region. The mesonephros fuses with the pronephros to form the wolffian (mesonephric) duct. The wolffian duct develops an outpouching, the ureteral bud, from which the ureter, pyelocalyceal system, and collecting ducts are formed. The stalk of the ureteral bud later becomes the ureter.
Metanephros: The actual kidney is formed by the fusion of the metanephrogenic blastema (which is the lower lumbar and sacral portion of the nephrogenic cord) with the ureteral bud. The ureteral bud divides and stimulates the proliferation and differentiation of the metanephrogenic blastema.
Renal Agenesis
Renal agenesis, or congenital absence of the kidney, occurs when the ureteral bud fails to interact with the metanephrogenic blastema, eliminating the normal inductive effect of the ureteral bud. Renal agenesis is commonly associated with other genital anomalies.
Bifid Ureter and Duplex Ureter
Premature branching or division of the ureteral bud—before the ureteral bud reaches the metanephrogenic blastema—may lead to duplication of the ureter. In the case of a bifid ureter, the two ureters unite before draining into the bladder through a common orifice. The formation of two ureteral buds from the wolffian duct leads to a duplex ureter. In this case the duplicated ureters drain into the bladder through separate orifices. The upper (extra) ureteral bud induces formation of the upper renal pole while the lower (normal) ureteral bud induces formation of the lower pole. If the wolffian duct is incorporated into the bladder floor as far as the origin of the lower ureteral bud, the upper bud will continue to migrate caudally with the rest of the wolffian duct. This leads to a crossing of the ureters, and the extra upper ureter may terminate at an abnormally low level, inserting, for example, into the urethra, vagina, or vas deferens. In the great majority of cases, however, both ureters open into the bladder.
Note
The crossed position of duplicated ureters is known as the Weigert–Meyer law: the upper-pole ureter always inserts into the bladder below the lower-pole ureter.
Positional Variants
The metanephros ascends from the pelvic region to the lumbar region during embryonic development. The metanephros also rotates during its ascent. The renal pelvis moves from an anterior to a medial orientation. Failure of the metanephros to ascend normally may lead to alterations of renal position ranging from pelvic kidneys to malrotated kidneys with the renal hilum directed anteriorly.
Horseshoe Kidney
Horseshoe kidney results from the fusion of the two kidneys at their lower poles (▶ Fig. 11.3, ▶ Fig. 11.4). The fused area may consist purely of connective tissue or of functional renal parenchyma.
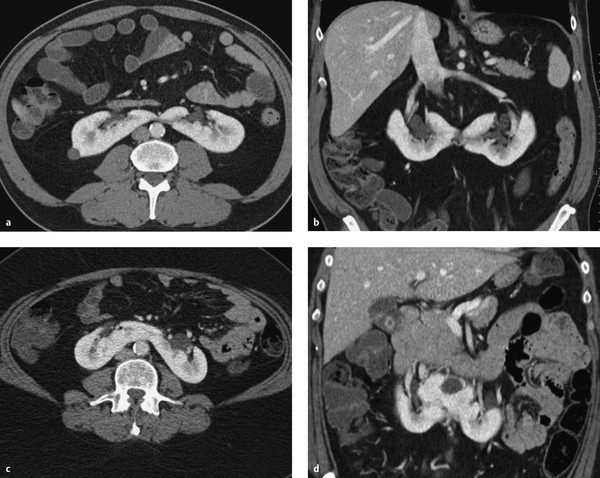
Fig. 11.3 Horseshoe kidneys in two patients. The renal pelvis is rotated anteriorly in both patients. (a) Horseshoe kidney with a connective tissue isthmus (axial CT). (b) Horseshoe kidney with a connective tissue isthmus (coronal reformatted image). (c) Horseshoe kidney with a parenchymal isthmus (axial CT). (d) Horseshoe kidney with a parenchymal isthmus (coronal reformatted image).
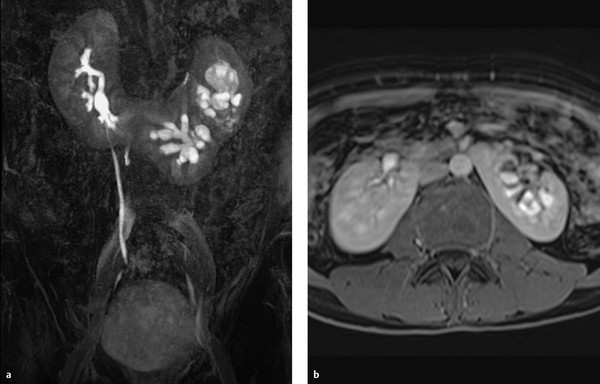
Fig. 11.4 Horseshoe kidney. Patient with a horseshoe kidney and duplicated left pelvicalyceal system. (a) Coronal maximum intensity projection. (b) Axial T1W sequence after IV administration of contrast medium displays the inferior mesenteric artery, which has obstructed the ascent of the embryonic kidneys.
Accessory Renal Arteries
As the kidney ascends to the lumbar level, its vascular supply also changes. It is supplied initially by branches of the iliac artery, then by segmental branches of the lower aorta, and it finally receives its definitive supply from segmental branches at the level of the second lumbar segment. The persistence of one or more precursor vessels leads to the presence of accessory renal arteries (e.g., an accessory lower-pole artery, ▶ Fig. 11.5). The renal artery divides at the hilum into segmental arteries. As a rule, four segmental arteries run anterior to the renal pelvis and one posterior (▶ Fig. 11.6). The interlobar arteries that arise from the segmental arteries enter the kidney through the renal columns, run lateral to the pyramids, and branch first into arcuate arteries and then into interlobular arteries. A knowledge of this branching pattern is helpful in performing a percutaneous nephrostomy or renal biopsy. The safest route for placing a nephrostomy tube is to pass the catheter through the papillary tips into the renal pelvis.
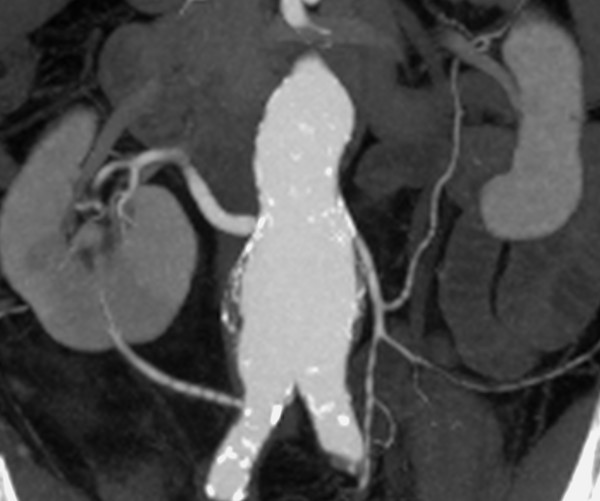
Fig. 11.5 Accessory lower pole artery in a 60-year-old man with an infrarenal aortic aneurysm. An accessory lower-pole artery arises from the right common iliac artery due to abnormal renal ascent.
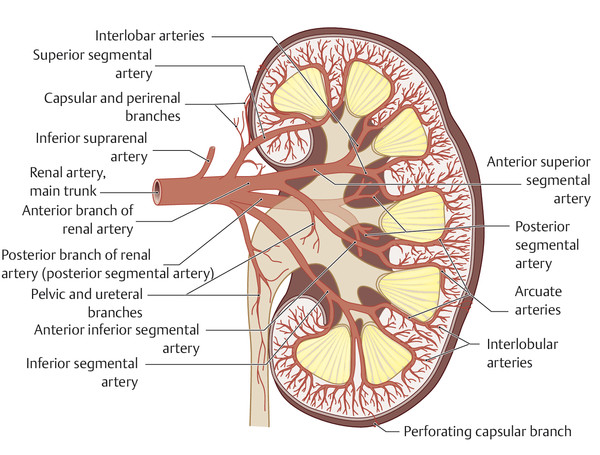
Fig. 11.6 Arterial anatomy of the kidney. In most cases there are four segmental arteries anterior to the renal pelvis and one posterior. The papillary apices are avascular and provide good access sites for the introduction of a nephrostomy catheter.
11.1.3 Diseases
Masses
Cystic Renal Masses
Brief definition Cysts are the most common renal changes detectable by imaging. Simple renal cysts are fluid-filled spaces with a fibrous wall. They may be solitary, multiple, unilateral, or bilateral and may be symptomatic or have no pathologic significance. At least one renal cyst can be found in approximately 50% of the population over 50 years of age. 19 Renal cysts may also show intralesional hemorrhage or internal septa, in which case they are classified as complex cysts. A crucial differentiation is between renal cysts and renal cell carcinoma, which often has a cystic appearance. The Bosniak classification, 20 introduced in 1986, is helpful for characterizing renal cysts in terms of their malignancy risk, or the possible presence of renal cell carcinoma, and thus for standardizing their clinical management.
Caution
The use of high-resolution MRI sequences in a 3-T field, such as a 3D GRE sequence with fat suppression after IV administration of contrast medium, may improve the detection of hypervascular septa at a maximum resolution of 2 mm. This makes MRI particularly useful for monitoring lesions with a potential for malignant change.
Imaging signs Simple renal cysts appear sonographically as well-circumscribed, echo-free lesions with posterior acoustic enhancement. Inspissated proteinaceous or hemorrhagic contents can produce internal echoes of variable amplitude. Ultrasound may also show variable internal septa or polypoid masses. The different Bosniak categories are associated with the following imaging findings:
Bosniak type 1 cysts: Type 1 cysts are isodense to water on CT, with attenuation values in the range 0 to 20 HU. They have a thin (<1 mm), nonenhancing capsule (▶ Fig. 11.7). On MRI they are hypointense in T1W sequences and homogeneously hyperintense in T2W sequences (▶ Fig. 11.8). As on CT, contrast enhancement is not observed. Bosniak type 1 cysts have no malignant potential and therefore do not require follow-up or surgical removal.
Bosniak type 2 cysts: These cysts have relatively high CT attenuation (>20 HU) compared with type 1 cysts. They contain thin septa (<1 mm). They may exhibit fine mural or septal calcifications but are minimally complex and nonenhancing. They may be hypointense or hyperintense in T1W MRI sequences, depending on the presence of intracystic hemorrhage (cyst diameter <3 cm). Their T2W signal intensity is also variable, depending on the same factors. Type 2 cysts do not enhance (▶ Fig. 11.9) and have no risk of malignant transformation.
Bosniak type 2F cysts: These are cystic lesions with a thickened, irregular cyst wall and septa. Nodular calcifications may be present but have no soft-tissue elements and do not enhance (▶ Fig. 11.10, ▶ Fig. 11.11). Cysts with hemorrhagic contents larger than 3 cm in diameter are also classified as Bosniak type 2F. The malignancy risk is 0 to 10%. Patients with a type 2F cyst should be followed (the “F” stands for “follow up”). Currently there are no uniform standards for setting follow-up intervals. O’Malley et al. recommend an initial follow-up at 6 months and, if there has been no change, two subsequent 1-year follow-ups and a final follow-up at 2 years. 22
Bosniak type 3 cysts: Both imaging modalities show a thickened, irregular wall with septa (▶ Fig. 11.12) Irregular mural calcifications may also be present. There is contrast enhancement that exceeds 15 HU on CT relative to unenhanced images. The malignancy risk is approximately 50%, and therefore surgical removal is advised.
Bosniak type 4 cysts: Cysts in this category are clearly malignant cystic lesions with solid components and contrast enhancement (▶ Fig. 11.13, ▶ Fig. 11.14). The risk of malignancy is 100% and surgical removal is indicated.
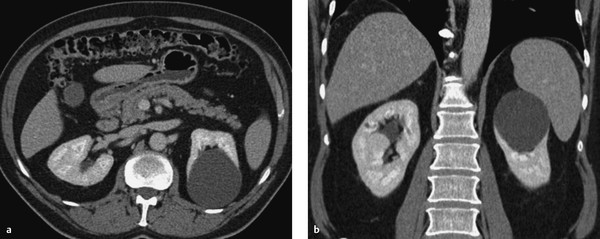
Fig. 11.7 Simple renal cyst without calcifications or septa (Bosniak type 1). CT, nephrographic phase. (a) Axial image. (b) Coronal image.
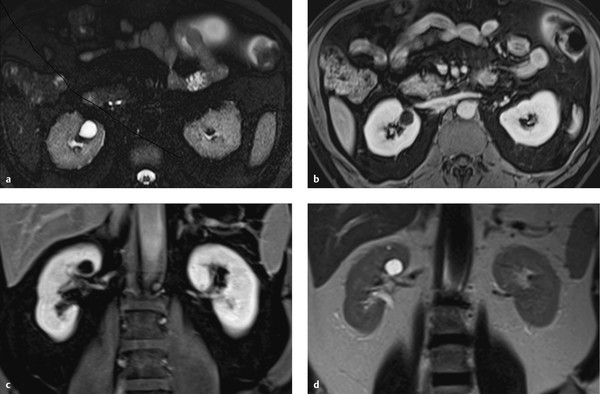
Fig. 11.8 Bosniak type 1 cyst in a 57-year-old man. Characteristic cystic mass in the upper pole of the right kidney is hyperintense in the T2W sequence and hypointense in the T1W sequence. The absence of septa and enhancement positively identifies the cyst as Bosniak type 1. (a) Axial T2W image. (b) Axial T1W image, venous phase. (c) Coronal T1W image, venous phase. (d) Coronal T2W image.
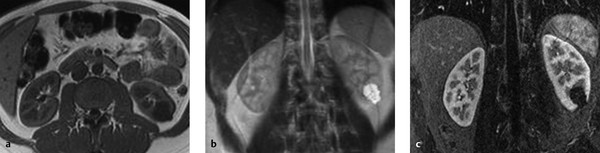
Fig. 11.9 Bosniak type 2 cyst in a 46-year-old woman. (a) Unenhanced T1W sequence shows a hypointense cystic mass with fine septa in the lower pole of the left kidney. (b) The mass appears hyperintense in the T2W sequence. (c) T1W sequence after administration of contrast medium. The septa do not enhance.
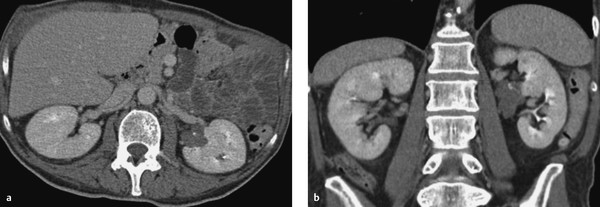
Fig. 11.10 Septated renal cyst with calcifications (Bosniak type 2F). CT, urographic phase. Left renal cyst shows absence of enhancement. (a) Axial image. (b) Coronal image.
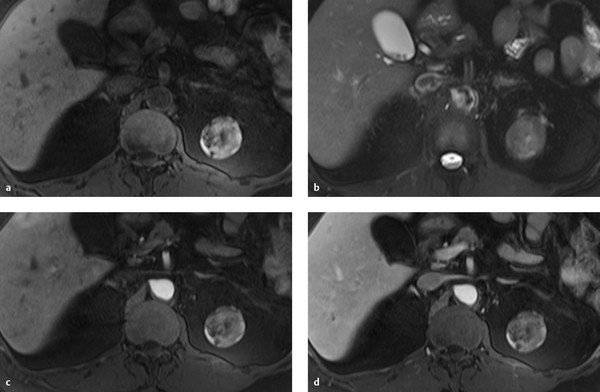
Fig. 11.11 Bosniak type 2F cyst in a 66-year-old woman with a nonenhancing mass in the upper pole of the left kidney. The mass is heterogeneously hyperintense in the unenhanced T1W sequence and heterogeneously hypointense in the T2W sequence. (a) Unenhanced T1W image. (b) T2W image. (c) T1W image after administration of contrast medium, early arterial phase. (d) T1W image after administration of contrast medium, venous phase.
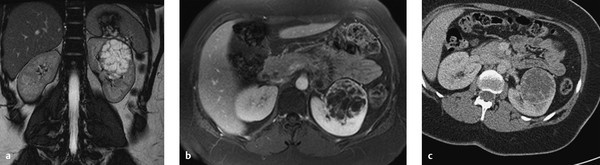
Fig. 11.12 Bosniak type 3 cyst. A cystic mass with multiple internal septa and irregular septal thickening is detected in the left kidney of a 68-year-old man. The mass has high T2W signal intensity and enhances after IV administration of contrast medium. (a) T2W sequence. (b) T1W sequence after administration of contrast medium. (c) Axial CT (portal venous phase).
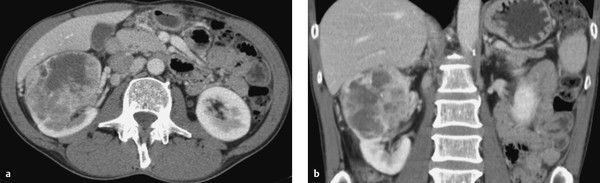
Fig. 11.13 Cystic renal mass with enhancing solid components (Bosniak type 4). CT, nephrographic phase. (a) Axial image. (b) Coronal image.
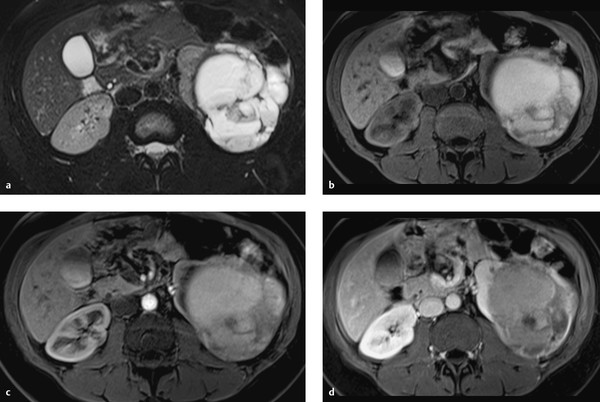
Fig. 11.14 Bosniak type 4 cyst. An irregular cystic mass with solid components is detected in a 74-year-old man. The mass is predominantly hyperintense in the T2W and T1W sequences, consistent with intracystic hemorrhage. The T1W sequence after administration of contrast medium shows heterogeneous enhancement. (a) Axial T2W sequence. (b) Axial unenhanced T1W sequence. (c) Axial T1W sequence, early arterial phase. (d) Axial T1W sequence, venous phase.
Clinical features Uncomplicated renal cysts are usually asymptomatic and are detected incidentally during a routine ultrasound examination, for example. Large renal cysts may cause flank pain due to renal displacement.
Differential diagnosis Congenital renal cysts, which are classified as Potter type I to IV, require differentiation from the renal cysts described above.
Cystic Renal Diseases
Cystic renal diseases include a number of genetically mediated diseases that have different manifestations:
Autosomal recessive polycystic kidney disease (ARPKD).
Autosomal dominant polycystic kidney disease (ADPKD).
Medullary cystic disease or juvenile nephronophthisis.
Medullary sponge kidney.
Congenital nephrotic syndrome.
Familial hypoplastic glomerulocystic disease.
Malformation syndromes such as von Hippel–Lindau syndrome or tuberous sclerosis.
Multicystic renal dysplasia.
Sporadic glomerulocystic renal disease.
The Potter classification is based on histological examination of the site of cyst origin.
Polycystic Kidney Disease (Infantile Form)
ARPKD is further differentiated by the affected gene locus, each of which loci is associated with a different clinical presentation:
Neonatal form: Even prenatally, both kidneys are greatly enlarged and echogenic due to myriad tiny cysts that are too small to be resolved with ultrasound. There is oligohydramnios due to intrauterine renal failure, and the decreased amniotic fluid volume leads to pulmonary hypoplasia. Oligohydramnios may also lead to clubbing of the feet and cranial deformities.
Intermediate form: Renal failure and renal hypertension develop during the first year of life.
Juvenile form: The dominant clinical finding is hepatic fibrosis leading to portal hypertension with esophageal varices. The kidneys are echogenic and slightly enlarged due to the presence of multiple small cysts.
Polycystic Kidney Disease (Adult Form, Potter Type III)
Brief definition Autosomal dominant polycystic kidney disease (ADPKD; Potter type III) is an autosomal dominant disease characterized by prominent cysts in one or both kidneys. Cysts are also present in the pancreas, spleen, or liver. An association with cerebral berry aneurysms is also found in ADPKD patients. The cystic renal degeneration is often marked by a combination of simple and complex cysts. In contrast to acquired polycystic kidney disease (e.g., in dialysis patients), the risk of malignant transformation is not significantly increased.
Imaging signs The kidneys are permeated by multiple cysts (▶ Fig. 11.15), making it difficult or impossible to detect residual, original renal parenchyma. The kidneys are markedly enlarged due to the presence of numerous cysts. It is common to find simple cysts coexisting with partially complex cysts with hemorrhagic changes (▶ Fig. 11.16). The cysts themselves are radiologically indistinguishable from acquired simple cysts and benign cysts. Bilateral multicystic permeation of the kidneys is characteristic. Because ADPKD is a systemic disease, other organs are also affected. In addition to renal cysts, multiple cysts are most commonly found in the liver but may also occur in the pancreas and spleen.
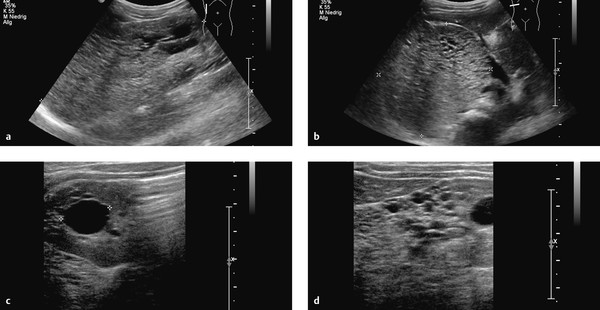
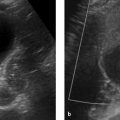
Fig. 11.15 Cystic renal degeneration in a 4-year-old girl with histologically confirmed cystic kidney disease. Ultrasound shows an inhomogeneous region in the upper pole of the right kidney (a) with multiple small, echo-free cysts (c, d) coexisting with larger cysts (b). (a) Longitudinal scan from the posterior side (curved array transducer). (b) Transverse scan from the posterior side (curved array transducer). (c) Transverse scan from the posterior side (linear transducer). (d) Longitudinal scan from the posterior side (linear transducer).
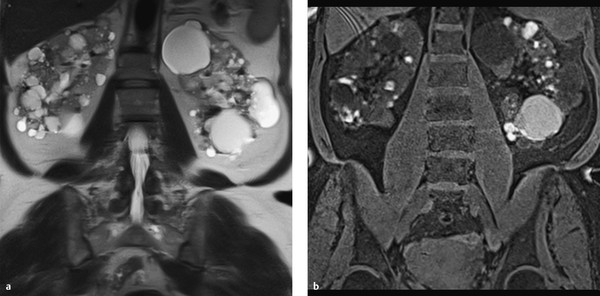
Fig. 11.16 Polycystic kidneys. Bilateral polycystic kidneys with areas of intracystic hemorrhage in a 74-year-old woman. The cysts appear hypo- and isointense in the T2W sequence (a) and hyperintense in the T1W sequence (b).
Clinical features ADPKD usually becomes symptomatic in adulthood. Complaints include hematuria (usually due to self-limiting intracystic hemorrhage), recurrent urinary tract infections, microalbuminuria, hypertension, progressive impairment of renal function, nonspecific abdominal complaints or back pain, and a possible increase in abdominal circumference. Progressive renal failure and uremia usually develop after 40 years of age. Some patients with cystic kidneys remain asymptomatic until renal failure supervenes, leading to delays in diagnosis and genetic counseling.
Differential diagnosis
Acquired renal cysts.
Complex renal cysts.
Medullary Sponge Kidney
Medullary sponge kidney is caused by cystic dilatation of the collecting ducts in the medullary pyramids; the cortex is unaffected. The findings may be confined to one pyramid or one segment. Initial manifestations of the disease appear in adolescence and consist of recurrent pyelonephritis, hematuria, or flank pain due to urolithiasis.
Medullary Cystic Kidney Disease
This disease is divided into a juvenile form (also called juvenile nephronophthisis, autosomal recessive) and an adult form (autosomal dominant). The medullary cysts are accompanied by renal atrophy culminating in renal failure.
Solid Renal Masses
Solid renal masses can be divided into two groups according to their origin:
Epithelial tumors: adenoma, oncocytoma, renal cell carcinoma.
Mesenchymal tumors: angiomyolipoma, medullary fibroma, liposarcoma, leiomyosarcoma, hemangiopericytoma.
Oncocytoma
Brief definition Oncocytoma is a benign, very slow-growing solid renal tumor 24, 25 that arises from the epithelium of the renal collecting ducts and contains eosinophilic cells. The peak incidence is in the fifth through seventh decades, with a 2:1 ratio of males to females. Average tumor size at the time of diagnosis is approximately 6 cm. From 3 to 7% of all renal tumors are oncocytomas.
Imaging signs Oncocytoma appears on CT as a homogeneously enhancing mass. Often it contains a central stellate or spoked-wheel nonenhancing scar that suggests a diagnosis of oncocytoma ( ▶ Fig. 11.17). A corresponding pattern can be seen on MRI ( ▶ Fig. 11.18).
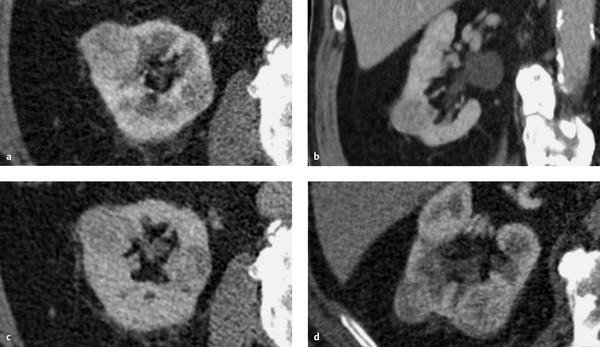
Fig. 11.17 Multiple oncocytomas in an 87-year-old man. The largest of the lesions shows a classic, nonenhancing central scar that contrasts with the surrounding enhancing portion of the mass. (a) CT, arterial phase. (b) CT, coronal reformatted image. (c) CT, nephrographic phase. (d) CT, excretory phase.
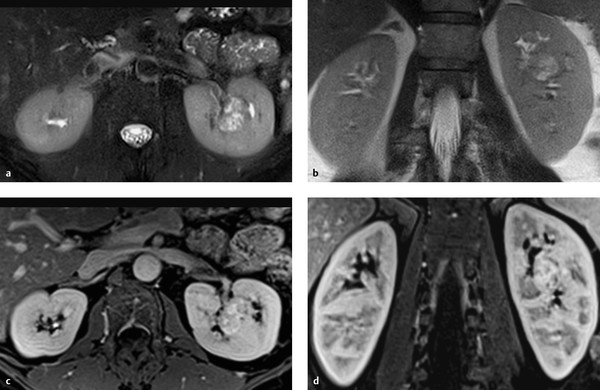
Fig. 11.18 Renal oncocytoma in a 42-year-old man with a T2-hyperintense mass in the midportion of the left kidney. The mass enhances in the T1W sequence and has a central nonenhancing scar. (a) Axial T2W sequence. (b) Coronal T2W sequence. (c) Axial fat-suppressed T1W sequence, venous phase. (d) Coronal fat-suppressed T1W sequence, venous phase.
Clinical features Oncocytomas are usually asymptomatic, and most are detected incidentally by imaging during a work-up for other conditions. Large oncocytomas may become symptomatic due to organ displacement, presenting with nonspecific abdominal or flank pain. The clinical presentation is indistinguishable from that of renal cell carcinoma.
Differential diagnosis Oncocytoma closely resembles renal cell carcinoma in its imaging features. Even biopsy cannot always differentiate these entities.
Note
A solitary, homogeneous mass with a central spoked-wheel structure is an indication for partial (or complete) nephrectomy due to the problem of differentiating oncocytoma from renal cell carcinoma.
Angiomyolipoma
Brief definition Angiomyolipomas are benign hamartomas composed of mature fat, smooth muscle, and thick-walled vessels. They originate from perivascular cells. The peak age of incidence is in the fifth and sixth decades. Females predominate over males by approximately 4:1. Patients with tuberous sclerosis are at increased risk for angiomyolipoma (present in 80% of cases), and frequently both kidneys are affected. Both sexes are represented equally in this group, and the peak age of incidence is 30 years. Approximately 80% of angiomyolipomas occur sporadically, however. The risk of intratumoral hemorrhage increases with tumor size (past 4 cm). Spontaneous retroperitoneal hemorrhage occurring in association with angiomyolipoma is known as Wunderlich’s syndrome (▶ Fig. 11.19, ▶ Fig. 11.20). The growth of angiomyolipomas is presumed to be hormone-dependent, and the risk of rupture is increased in pregnancy. Prophylactic excision, ablation, or embolization is generally recommended for tumors 4 cm or more in diameter. Tumors smaller than 4 cm can be managed by yearly imaging follow-up. The growth rate of sporadic angiomyolipomas is 5% per year. Tumors in patients with tuberous sclerosis have a 20% annual growth rate.
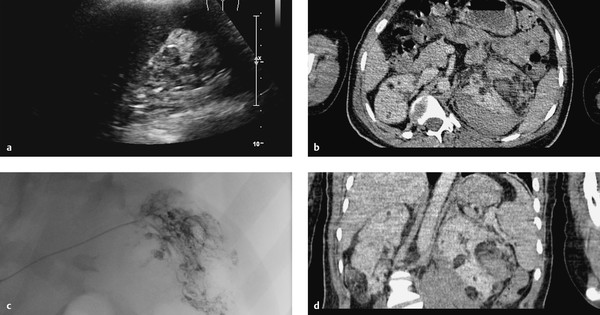
Fig. 11.19 Renal angiomyolipoma and Wunderlich’s syndrome in a 21-year-old man with known tuberous sclerosis. His hemoglobin level fell from 14 to 7 mg/dL. (a) Ultrasound scan shows an inhomogeneous kidney with loss of corticomedullary differentiation and an echogenic hemorrhage with some degree of perirenal spread. (b) Axial CT shows bilateral renal masses, some with fat attenuation, with a left perirenal hematoma. (c) Left renal angiogram demonstrates multiple corkscrewlike feeder vessels to the angiomyolipoma with active bleeding from one feeder. (d) Coronal CT.
Related posts:
Stay updated, free articles. Join our Telegram channel

Full access? Get Clinical Tree


