Anatomy
Location and divisions The mediastinum extends from the thoracic inlet to the diaphragm and is bounded laterally by mediastinal pleura. The mediastinum constitutes a single, coherent space that has no natural (fascial) barriers to the spread of tumors or inflammation. Nevertheless, it is useful conceptually to divide the mediastinum into parts because various diseases tend to occur at specific sites within the mediastinum, and the location of a pathologic process can be helpful in narrowing the diagnosis. The mediastinum is divided into anterior, middle, and posterior parts (▶ Fig. 1.1). The cervical fasciae communicate freely with the mediastinum, allowing inflammatory processes to spread contiguously from the neck into the mediastinum.

Fig. 1.1 Divisions of the mediastinum. (a) The divisions outlined in an axial CT scan. (b) The divisions outlined in a sagittal reformatted CT image. White indicates the anterior mediastinum (thymus, lymph nodes, and fatty tissue); yellow indicates the middle mediastinum (heart, aortic arch, pulmonary artery trunks, vena cava, trachea); light blue indicates the posterior mediastinum (descending aorta, esophagus, azygos and hemiazygos veins, thoracic duct); horizontal darker blue lines indicate the superior mediastinum (space above the pericardial reflection).
Note
The anterior mediastinum contains the thymus, lymph nodes, and fat. Its upper portion extends from the chest wall to the ascending aorta and superior vena cava, its lower portion from the retrosternal surface to the pericardium.
The largest of the three compartments, the middle mediastinum, contains the heart, trachea, and large vessels arising from the aortic arch.
The posterior mediastinum contains the esophagus, descending aorta, azygos and hemiazygos veins, and thoracic duct.
The mediastinum is further subdivided into the superior mediastinum and inferior mediastinum. The superior mediastinum extends downward from the thoracic inlet to the pericardium.
Radiographic landmarks ▶ Fig. 1.2 shows the mediastinal landmarks that appear on a standard chest radiograph.

Fig. 1.2 Landmarks for mediastinal structures on chest radiographs. (a) PA view: the right mediastinal borders are formed by the superior vena cava (SVC), the pulmonary arteries in the hilum, and the right atrium (RA). The aortic contour is prominent on the left side. The left atrial appendage and left ventricle form the cardiac borders. The paravertebral line (black) is an edge-on projection of the pleura and immediate paravertebral soft tissues. (b) Lateral view: the left pulmonary artery (LPA) forms a cane-shaped figure that arches over the left main bronchus (L). The right pulmonary artery (RPA) runs for some distance across the mediastinum and appears end-on in the lateral view, creating an elliptical figure. The right main bronchus (R) runs just above it. The left main bronchus is projected below the right main bronchus. The aortopulmonary window is the gap between the left pulmonary artery and the aorta visible in the lateral projection.
Caution
The pericardial reflection extends far in a cranial direction anteriorly and encloses almost the entire ascending aorta as far as the horizontal segment of the aortic arch.
CT landmarks (▶ Fig. 1.3)
The sternum and ascending aorta provide landmarks for the thymic bed, which is located between those structures.
The most important landmarks in the superior mediastinum are the supra-aortic branch vessels. From right to left they are the brachiocephalic trunk, which branches into the right subclavian artery and common carotid artery; the left carotid artery; and the left subclavian artery (see ▶ Fig. 1.3a). The next vessel to the right is the superior vena cava. The trachea is located behind those vessels and is just anterior to the esophagus.
The thoracic duct ascends to the right of the aorta and opens into the junction of the left subclavian vein and left jugular vein. It collects lymphatic fluid from the lower extremities and abdominal organs in the upper left half of the body except for the left lower lobe of the lung. Its maximum diameter in the mediastinum is approximately 5 mm. The remaining areas on the right side are drained by the smaller right lymphatic duct.
The vagus nerve descends with the major vessels in the neck, entering the chest through the thoracic inlet. Below the level of the aortic arch it accompanies the esophagus in its descent through the mediastinum.
The right recurrent laryngeal nerve leaves the vagus nerve at the level of the subclavian artery, winds around that vessel, and ascends to the neck in the groove between the trachea and esophagus. The left recurrent laryngeal nerve is longer; it leaves the vagus nerve at the level of the aortic arch, passes behind the ductus arteriosus and around the aorta, and runs cephalad between the trachea and esophagus (▶ Fig. 1.4). Compression or infiltration of the nerve by a tumor leads to hoarseness.
The phrenic nerve arises from the C3–C5 nerve roots, leaves the brachial plexus, and accompanies the subclavian artery and vein through the thoracic inlet. It descends in the middle mediastinum along the pericardium to the diaphragm. Infiltration of the phrenic nerve by a mass leads to unilateral elevation of the diaphragm (▶ Fig. 1.5).

Fig. 1.3 Landmarks for mediastinal structures on axial CT. (a) Superior mediastinum, supra-aortic branches. Just posterior to the sternum is the left brachiocephalic vein (LBV). Just to the left of it are the vessels arising from the aortic arch, the brachiocephalic trunk (1), left common carotid artery (2), and left subclavian artery (3), which run anterior to the trachea (T). Just posterior to the trachea is the esophagus (E), whose small lumen can be traced through all the slices down to its passage through the diaphragm at the esophageal hiatus. The superior vena cava (C) can be traced through all slices from the union of both brachiocephalic veins to the right atrium. It occupies a right anterolateral position relative to the trachea and borders the brachiocephalic trunk on the right side. (b) At the level of the aortic arch (A), the azygos vein (AV) curves around the right main bronchus and opens into the superior vena cava (C). Additional landmarks for identifying the vessel are the spinal column and trachea (T). The azygos vein follows a right prevertebral path. (c) Below the aortic arch are the main trunk of the pulmonary artery and its division into the right and left pulmonary arteries, which forms a typical Y-shaped structure (PA). The left and right internal thoracic artery and vein, which arise from the subclavian artery and drain into the subclavian vein, respectively, follow a parasternal path on the inner chest wall. 1, ascending aorta; 2, descending aorta; C, superior vena cava; E, esophagus; IT, internal thoracic artery; AV, azygos vein. (d) The ascending aorta (1) arises from the middle of the heart. The descending aorta (2) occupies a left anterolateral position relative to the spinal column. E, esophagus. (e) The inferior vena cava (IVC) is identified at this level. 2, descending aorta; E, esophagus. (f) The hemiazygos vein ascends in a left prevertebral path to approximately the level of the T7 vertebral body, where it empties into the azygos vein (AV). 2, descending aorta; E, esophagus; IVC, inferior vena cava.

Fig. 1.4 The course of the vagus nerve and the recurrent laryngeal nerve. Axial scans demonstrate the course of the right vagus nerve (RNV) and left vagus nerve (LVN) and the right and left recurrent laryngeal nerve (RRN, LRN). The vagus nerve emerges from the skull base through the jugular foramen and runs behind the carotid artery in the carotid sheath. (a) The right recurrent laryngeal nerve leaves the vagus nerve at the level of the subclavian artery origin, loops around the vessel, and ascends to the larynx between the trachea and esophagus. (b) The left recurrent laryngeal nerve leaves the vagus nerve at the level of the aortic arch and runs below the aortic arch between the trachea and esophagus, where it ascends toward the head.

Fig. 1.5 Infiltration of the right phrenic nerve by a mediastinal metastasis (asterisk in [b]) has led to elevation of the diaphragm on the affected side. The location of the phrenic nerve (PN) is indicated in image (a). (a) Axial CT after IV injection of contrast medium. (b) Coronal reformatted image.
Selection of modalities The most common mediastinal diseases are masses. These present clinically with nonspecific complaints caused by the compression of surrounding structures. Typical presenting complaints are dyspnea, foreign-body sensation, and dysphagia. Chest radiographs in two planes are the imaging study of first choice in these cases; they can further narrow the diagnosis and may indicate a need for sectional imaging by CT or MRI. When mediastinal imaging is required in patients with a known disease entity or in cases where the history and symptoms are suspicious for a particular disease, CT is the modality of choice for defining the location and extent of the changes and for tumor staging. MRI should be added in selected cases where CT alone cannot detect or exclude conditions such as tumor infiltration of the pericardium or invasion of the spinal canal through the neural foramina. Ultrasound imaging has a minor role and may have limited applications in the anterior superior mediastinum. Transesophageal ultasonography is needed to access the posterior mediastinum with ultrasound.
1.2 Evaluation of the Mediastinum on Conventional Radiographs
1.2.1 Silhouette Sign
When seen on conventional radiographs, soft tissues such as muscles, organs, and fluid are indistinguishable from one another in terms of their radiographic density. The radiographic phenomenon termed the silhouette sign may be helpful in determining the location of a mass.
When organs of equal density border directly on one another, they form a composite silhouette of uniform density when viewed on a projection radiograph. This image resembles a paper cutout (the original “silhouette”) with one continuous outline and no internal gradations of shading or color (▶ Fig. 1.6).
When two structures of equal density are located at different depths in the chest and are separated by a third structure of lower density, the two structures will appear sharply outlined relative to each other (▶ Fig. 1.7). They do not exhibit the silhouette sign.

Fig. 1.6 Positive silhouette sign of a thymoma. (a) AP chest radiograph: the right mediastinal border is widened by a mass (arrows) abutting the heart and hilum. The mass and heart appear to have the same density in this frontal projection, so the boundary between them is indistinct (negative silhouette sign). (b) The lateral view confirms the anterior location of the tumor (asterisk; arrows indicate the tumor margins). (c) Axial CT demonstrates the enhancing mass (asterisk) in the anterior and middle mediastinum.

Fig. 1.7 Negative silhouette sign of neuroblastoma. (a) In the PA chest radiograph, a sharp line separates the cardiac border (arrows) from the mass (asterisk). This sign proves that a structure of different density—in this case aerated lung—is located between the cardiac border and mass and that both are in different planes. This radiographic sign is called a “negative silhouette sign” . (b) Lateral view: the tumor (asterisk; arrows indicate the tumor margins) is posterior to the heart and is not in direct contact with it. (c) Axial CT confirms the location of the mass (asterisk) in the posterior mediastinum. The arrow indicates lung tissue that is interposed between the heart and mass and is responsible for the positive silhouette sign.
1.2.2 Edge-on Effect
In conventional radiography, the edge-on effect describes the visualization of a very thin structure, such as the pleura, when several centimeters of that structure occupy a plane that is oriented “edge-on” relative to the detector. Another common example of this effect is the visualization of the pulmonary interlobar fissures in a lateral chest radiograph.
When the mediastinum is viewed in a PA chest radiograph, multiple lines can be seen due to the edge-on effect as well as the density difference between the soft tissues and lung. Lines visible in the anterior and middle mediastinum include the right paraesophageal line, the anterior pleural interface line, and the paracaval line (▶ Fig. 1.8). Lines visible in the posterior mediastinum include the paravertebral and para-aortic lines. The close proximity of masses or inflammatory processes may disrupt these lines (e.g., obliteration of the right paravertebral line (see ▶ Fig. 1.7).

Fig. 1.8 Boundary lines in the anterior and middle mediastinum that are visible in the chest radiograph, with corresponding CT scans.
Note
It is important to realize that lines produced by an edge-on projection are visible in healthy subjects only if the structures in question are aligned in the plane of the detector. It is very rare for all the lines to be visualized in a healthy individual.
1.3 Diffuse Mediastinal Diseases
1.3.1 Acute Mediastinitis
Brief definition Acute mediastinitis is a bacterial infection of the mediastinal fat and connective tissue that may be a mixed infection (type I) or may be caused by group A beta-hemolytic streptococci (type II). It may develop as a postoperative complication, after trauma including esophageal perforation, or in the form of descending necrotizing mediastinitis secondary to a deep soft tissue infection in the neck. 1 The majority of cases result from an esophageal perforation. The negative intrathoracic pressure generated by each inspiration promotes the contiguous spread of infectious organisms from the cervical soft tissues to the mediastinal connective tissue. This leads to a high tissue concentration of bacterial toxins, resulting in tissue necrosis. Predisposing factors are diabetes mellitus, obesity, and alcohol and nicotine abuse. If untreated, the necrotizing mediastinitis will lead to generalized sepsis and death. In recent decades the mortality rate of this disease has declined from 49% in the early 1900s to the current level of 11 to 15% as a result of prompt imaging evaluation combined with aggressive surgical and interventional therapy (excision of the necrotic tissue and drain insertion). 2
Imaging signs
The chest radiograph shows widening of the mediastinum as a nonspecific sign. CT after IV administration of contrast medium is the modality of choice for confirming the diagnosis and planning treatment.
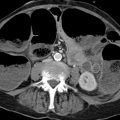
Mediastinitis may present as a diffuse, suppurative inflammation of the mediastinal fat and connective tissue, or may lead to the formation of necrotic tracks and abscesses in the mediastinum. In diffuse mediastinitis, the mediastinal fat initially shows streaky infiltration followed later by homogeneous, diffusely increased density with positive attenuation values (▶ Fig. 1.9). Reactive lymphadenopathy is often present.
If the mediastinitis results from an esophageal perforation, imaging may reveal small air inclusions or larger collections including mediastinal emphysema.
Fluid collections are found in mediastinitis with abscess formation. Like abscesses elsewhere in the body, a mediastinal abscess may display an enhancing rim formed by inflammatory cells. This rim is not always initially defined in early acute cases, however, so the absence of enhancement in the tissue surrounding a fluid collection does not exclude mediastinitis.
In very pronounced cases, mediastinitis may spread into the lung through the hila. This creates a streaky pattern of perihilar density.
Mediastinal abscess may be complicated by perforation of the abscess into the esophagus or trachea.

Fig. 1.9 Mediastinitis. The mediastinal fat (dashed arrow) shows increased density and contains air inclusions (solid arrow).
Clinical features Acute mediastinitis presents as a highly acute, severe illness of sudden onset with rapid debilitation, fever, chills, elevated ESR, left shift, and elevated C-reactive protein. The history may suggest the correct diagnosis, for example:
Previous esophageal perforation (either iatrogenic or due to vomiting as in Boerhaave syndrome).
Previous endoscopy.
Esophageal carcinoma (perforation).
Sinusitis.
Tonsillitis.
Dental root infection.
Retropharyngeal abscess.
Differential diagnosis Postoperative air inclusions, postoperative hematomas, and chronic mediastinitis with increased mediastinal density and pruning of vessels should be considered in the differential diagnosis.
Pitfalls Mediastinitis is difficult to diagnose in the early postoperative period. Mediastinal air inclusions may persist for up to 3 weeks after surgery. Postoperative hematomas may lead to increased density of mediastinal fat and persist for up to 2 months after surgery. They are difficult to distinguish from mediastinitis by their imaging appearance, as the changes are similar. The clinical presentation is the decisive factor.
Key points Acute mediastinitis has a high mortality rate without treatment. Cardinal CT features are increased density of the mediastinal fat, fluid collections, and air inclusions. In patients who have just undergone surgery, these features require differentiation from postoperative changes that may display the same imaging characteristics. Laboratory values and clinical symptoms aid differentiation.
1.3.2 Chronic Mediastinitis and Multifocal Fibrosclerosis
Brief definition
Chronic mediastinitis is a fibrosing inflammation that may have a variety of causes such as infection (e.g., Actinomyces israelii or Aspergillus species), prior radiotherapy, or autoimmune processes.
Multifocal fibrosclerosis is a disorder characterized by the occurrence of fibrous lesions at various sites. The fibrosis may be retroperitoneal (Ormond’s disease), intraorbital, or may occur in the form of a Riedel goiter. 3 To date, fewer than 50 cases of multifocal fibrosclerosis with mediastinal involvement have been described in the literature. The disease is characterized histologically by the presence of lymphocytes and plasma cells. Leukocytes are absent, so the disease is interpreted as an autoimmune inflammation. The extracellular collagen proliferation and fibrosis are attributed to cell mediators from eosinophilic granulocytes. 4 No causative organism has been isolated in any case of multifocal fibrosclerosis described to date. The current treatment of choice is anti-inflammatory steroid therapy.
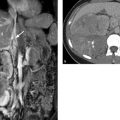
Imaging signs Increased density is noted in the mediastinal fat (▶ Fig. 1.10). CT and MRI frequently show narrowing of the mediastinal vessels.

Fig. 1.10 Mediastinal fibrosis. (a) CT shows increased density in the mediastinum with connective tissue proliferation (asterisks). The superior vena cava is occluded (arrow), giving rise to collateral flow through the azygos vein (dashed arrow) and hemiazygos vein into the inferior vena cava. The right pulmonary artery (P) is narrowed. The mediastinal fat and perivascular areas provide useful landmarks for image interpretation. (b) MR angiography shows the decreased perfusion of the right upper lobe (arrow) due to stenosis of the anterior trunk (upper lobar artery).
Clinical features Symptom onset is insidious, occurring gradually over a period of time. Inflammatory markers are only slightly elevated. The most common signs and symptoms relate to compression of the superior vena cava with “superior vena cava syndrome” (swelling of the neck and face, bluish discoloration of the face, distended veins in the face and neck, headache, vision problems). Other common findings are narrowing of the trachea (stridor) and stenosis of the pulmonary arteries with decreased lung perfusion and dyspnea. The stenosing processes are responsible for the mortality in chronic mediastinitis, and the stenoses should be treated surgically or by interventional radiology in accordance with the symptoms.
Differential diagnosis Unlike acute mediastinitis, chronic mediastinitis is not associated with the presence of fluid collections.
Key points Chronic mediastinitis is a rare disorder. Dominant clinical findings relate to the stenosis of blood vessels or the trachea. Inflammatory markers are not elevated. On imaging, increased density is noted on CT and fibrotic tissue is found on MRI. Fluid collections do not occur.
1.4 Mediastinal Masses
Mediastinal masses caused by malignant tumors may manifest clinically through B symptoms or symptoms relating to the compression or invasion of neighboring structures:
Narrowing of the trachea leads to dyspnea, while obstruction of the superior vena cava by the mass leads to superior vena cava syndrome. Sudden onset of clinical complaints requiring emergency diagnosis may result from a fast-growing tumor or from decompensated stenosis due to a slower-growing tumor. When vascular narrowing occurs gradually, circulation can be maintained by the development of collaterals, and superior vena cava syndrome does not occur.
If the recurrent laryngeal nerve is damaged by compression or infiltrated by a mass, the result is unilateral vocal cord paralysis with hoarseness. Persistent hoarseness may be the only symptom of a small tumor impinging on the recurrent laryngeal nerve.
Note
In patients with longstanding hoarseness and no associated cold symptoms, exclusion of a tumor involving the recurrent laryngeal nerve is necessary.
Selection of modalities The initial imaging study is often a plain chest radiograph, which can demonstrate the location and extent of a mediastinal tumor. The radiographic signs described earlier are helpful in determining the location of a mass. Sectional imaging can then accurately define the extent of the lesion while also revealing the compression or possible infiltration of adjacent organs. CT is most commonly used for this purpose, as it can display structures in high resolution while scanning the entire chest for any metastases that may already be present. MRI, on the other hand, is more time-consuming and usually does not add new information. It should be reserved for specific questions that could not be answered by CT.
Important considerations:
The location of mediastinal tumors will often suggest the correct diagnosis.
Morphological imaging criteria such as the distribution of enhancement within a mass and the morphological appearance of the tissue (homogeneity, necrosis, calcifications, fat content, relationship to neighboring structures with possible displacement, invasion, or cystic components) can further narrow the diagnosis. Cystic masses can be differentiated from solid tumors.
The correlation of imaging findings with the clinical presentation, including patient age and gender, is sufficient for making a differential diagnosis and may even allow characterization of the lesion in many cases. The presumptive diagnosis is then confirmed histologically by CT-guided percutaneous biopsy or excision.
Note
In the reporting of mediastinal masses, it is important to describe the exact size, location, and relationship of the mass to neighboring structures.
1.4.1 Anterior Mediastinum
The most common masses in the anterior mediastinum are goiters with intrathoracic extension, thymoma and thymic carcinoma, extragonadal germ cell tumors (usually the benign variant of teratoma but occasionally malignant teratomas, seminomas, embryonic cell carcinomas, and other germ cell tumors).
Intrathoracic Goiter
Brief definition Iodine deficiency leads to enlargement of the thyroid gland in patients with a euthyroid or hypothyroid metabolic state. Approximately 15 to 30% of all adults, depending on eating habits, have an enlarged thyroid gland. If more than 50% of the enlarged gland extends into the chest, the patient is said to have an intrathoracic (or retrosternal) goiter. Intrathoracic goiter is a common incidental finding on chest radiographs, CT, and MRI in iodine-deficient geographic regions.
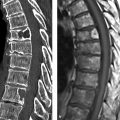
Imaging signs When viewed on chest radiographs, an intrathoracic goiter appears as a sharply circumscribed density in the superior mediastinum that displaces the trachea laterally at the level of the thoracic inlet in the PA view (▶ Fig. 1.11) and displaces it anteriorly in the lateral view. This feature is useful in distinguishing goiters from other diseases in the superior mediastinum, since other tumors as well as mediastinal widening due to other causes will rarely cause tracheal displacement. If tracheomalacia (pressure injury to the cartilage leading to tracheal instability during respiration) is suspected on clinical grounds, a standard tracheal radiograph should be obtained during a Valsalva maneuver (bearing down against a closed glottis to raise the intrathoracic pressure) and a Müller maneuver (inspiring against a closed glottis with the nostrils held shut to increase the negative intrathoracic pressure). If the luminal width changes by more than 50% during these maneuvers, tracheomalacia is present (▶ Fig. 1.12). A sectional imaging diagnosis of intrathoracic goiter relies on two main criteria:
The mediastinal mass is in continuity with the thyroid gland.
The tissue has the same density (CT) or signal intensity (MRI) as the thyroid gland.

Fig. 1.11 Multinodular goiter. (a) Chest radiograph demonstrates mediastinal widening (arrow). The trachea is markedly displaced to the left (dashed arrow). (b) Axial CT: the thyroid parenchyma appears inhomogeneous after IV injection of contrast medium. (c) Coronal reformatted image shows continuity of the goiter from the cervical to intrathoracic level.

Fig. 1.12 Tracheomalacia due to extrinsic compression by a goiter. In tracheal spot views, the luminal width of the trachea changes by more than 50% (arrows) in response to Valsalva maneuver (a) and a Müller maneuver (b).
Both the thyroid gland and ectopic thyroid tissue are markedly hyperdense to muscle on plain CT scans due to their high iodine content. Their unenhanced attenuation values are in the range of 65 to 120 HU. Thyroid tissue shows intense contrast enhancement owing to its rich blood supply. Large goiters generally contain calcifications. Most extend into the anterior mediastinum, and some may even extend as far as the middle or posterior mediastinum. Because most goiters are multinodular and contain colloid cysts, intrathoracic goiters often have a heterogeneous CT appearance and include areas that enhance less than the surrounding thyroid tissue.
Clinical features Patients usually present clinically with visible enlargement of the thyroid gland, typically located at a supraclavicular level in the midline. The goiter may become symptomatic due to tracheal displacement, and large goiters may cause tracheomalacia with cough, dyspnea, and inspiratory stridor.
Differential diagnosis
Enlargement of the thyroid gland may be a result of thyroiditis or thyroid carcinoma. CT scans of thyroid carcinoma may show only indirect signs such as extraglandular growth or the invasion of adjacent structures. Small carcinomas in the thyroid gland are indistinguishable from regressive nodules or thyroid adenomas by ultrasound or CT. Thyroid carcinoma may also contain calcifications, so the presence of calcifications is not a useful criterion for benign/malignant differentiation. Iodine 123 (123I) (or iodine 131 [131I) thyroid scintigraphy can detect nodules that do not concentrate iodine. Suspicious nodules are then evaluated by ultrasound-guided fine needle aspiration biopsy to exclude thyroid carcinoma.
Ectopic thyroid tissue in the mediastinum is rare. It has smooth margins and its enhancement characteristics are identical to those of thyroid tissue. With an ectopic thyroid gland in the mediastinum, the compartment normally occupied by the thyroid gland will be empty.
Key points Intrathoracic goiter is a common incidental radiological finding in iodine-deficient geographic regions. In imaging, the intrathoracic tissue is continuous with the thyroid gland and has the same attenuation values on CT and same signal intensity on MRI.
Thymic Hyperplasia
Brief definition The thymus originates from the third pharyngeal pouch, and during embryogenesis it ascends from the level of the pharynx into the anterior mediastinum in front of the aortic arch. Thymic cysts may form anywhere along this path. The imaging appearance of the thymus varies with age. In newborns, the thymus may be larger than the heart (▶ Fig. 1.13). It begins to atrophy at puberty, continues to regress with aging, and by age 40 years is visible on CT scans in only about 5 to 17% of the population. Reactive thymic hyperplasia, known also as rebound hyperplasia, may occur as a result of chemotherapy, chemoradiotherapy, or severe illness and characterizes recovery of the immune system. During this period the thymus may grow up to 50% larger than its original size. On average, reactive thymic hyperplasia occurs 6 months after the cessation of chemotherapy in children and 9 months after in adults, but intervals from 2 months to 5 years have been reported in the literature. 5 Rebound hyperplasia may occur in just 2 to 3 weeks in children who discontinue steroid therapy, taking somewhat longer in adults. Thymic hyperplasia also occurs in response to thyrotoxicosis, lupus erythematosus, Behçet’s syndrome, Addison’s disease, and Hashimoto’s thyroiditis.

Fig. 1.13 Normal thymus in three patients. (a) Chest radiograph of an 8-week-old infant. The superior mediastinum is markedly widened by the thymus (arrows). (b) CT scan in a 6-year-old girl. The thymus (T) shows homogeneous contrast enhancement. The sternum (S) and aorta (A) serve as landmarks, as the thymus is located between them. (c) Coronal T2W MR image in a 6-week-old infant. The thymus (T) extends well beyond the heart.
Imaging signs Viewed in axial images, the thymus in adults usually presents a triangular shape with the apex pointing toward the sternum. Severe diseases, chemotherapy, and steroid therapy elicits rapid atrophy of the thymus, which later recovers to a state of reactive hyperplasia. The hyperplastic thymus may abut blood vessels but never displaces them, whereas actual tumors of the thymus will cause vascular displacement. Another criterion for the diagnosis of reactive hyperplasia is the arrowhead shape that is typical of the thymus.
Clinical features Thymic hyperplasia has no clinical manifestations.
Differential diagnosis An important differential diagnosis is a thymoma, which usually has an oval shape unlike that of a normal or hyperplastic thymus. Recurrent lymphoma also requires differentiation from reactive hyperplasia, especially if there has been previous thymic involvement by lymphoma. It may be difficult in any given case to distinguish a recurrence from reactive thymic hyperplasia after the cessation of chemotherapy.
Key points The thymus slowly atrophies after puberty. This atrophy may occur rapidly after severe illness or chemotherapy, followed by rebound enlargement of the gland after recovery from the disease or the withdrawal of chemotherapy. This reactive hyperplasia requires differentiation from recurrent lymphoma, especially if there was primary involvement of the thymus.
Thymoma and Thymic Carcinoma
Brief definition Thymoma is a tumor originating from the epithelial cells of the thymus that are responsible for the maturation of T lymphocytes. Often the thymus is also found to contain collections of abnormal T cells that have been influenced by the excessive proliferation of altered epithelial cells. These cells form autoantibodies that may cause myasthenia gravis by blocking acetylcholine receptors at the motor end plates of striated muscle. Approximately 15% of patients with myasthenia gravis have a thymoma. By the same token, the thymus is not always enlarged in patients with a clinical diagnosis of myasthenia gravis. Histology in these patients shows a lymphoid reaction with an increased number of T lymphocytes in the thymus, which does not correlate with imaging abnormalities. Thymoma is most commonly diagnosed in the fourth to sixth decades and accounts for approximately 20% of all masses in the anterior mediastinum. As a general rule, thymomas have a smooth round or oval shape and enhance markedly after administration of contrast medium. Thymomas are typically located in the anterior superior mediastinum (▶ Fig. 1.14, see also ▶ Fig. 1.6), but 10% are found in the posterior mediastinum. Thymomas may contain cysts or calcifications. Numerous classifications were used for thymoma until 1999, when the WHO proposed a uniform classification that is often used today in its 2004 modification. This histological classification is based on the presence and number of cellular atypias. Types A, AB, and B1 are low-risk thymomas, types B2 and B3 are high-risk thymomas; and type C is thymic carcinoma. 6 All thymomas, even type A, may be locally invasive and may give rise to distant metastases, leading many authors to question the validity of the WHO classification. The incidence of thymoma and thymic carcinoma in the United States and Europe is 1 per 1 million population.

Fig. 1.14 Thymoma. (a) On axial CT the tumor (arrow) displays cystic and solid components. Its solid portions enhance faintly after administration of contrast medium. (b) T2W/T1W TrueFISP MRI sequence demonstrates the multiple cysts (arrow). (TrueFISP, true fast imaging with steady precession).
Imaging signs Thymomas have soft tissue attenuation on CT and enhance markedly with administration of intravenous contrast medium. They may contain cysts. Thymic carcinoma frequently invades blood vessels, with associated intravascular extension into the heart (▶ Fig. 1.15). If the tumor does not transgress the boundaries of the thymus, only histology can distinguish between thymoma and thymic carcinoma and provide an accurate classification. Recent studies suggest that thymic carcinoma has a higher standardized flurodeoxyglucose (FDG) uptake value on PET/CT than low- and high-risk thymomas. 7 On MRI, thymomas are hyperintense in T2WT2W images, are isointense to muscle on unenhanced T1WT1W images, and enhance intensely after administration of contrast medium. If thymoma is suspected, the entire chest and upper abdomen should be evaluated by CT, as 15% of patients will be found to have drop metastases along the pleura, and intra-abdominal metastasis may occur through the physiologic apertures in the diaphragm.

Fig. 1.15 Thymic carcinoma (asterisk). The tumor has invaded the left brachiocephalic vein (arrow).
Clinical features One-third of all thymomas lead to myasthenia gravis, with presenting symptoms of muscle weakness, fatigue, and ptosis. Another one-third of thymomas present with signs and symptoms attributable to local tumor growth. These include chest pain, superior vena cava syndrome, and a visible and palpable cervical mass with tumors that have grown up through the thoracic inlet. Another one-third of thymomas are detected incidentally by imaging done for a different indication. Given the difficulty of distinguishing benign thymoma from thymic carcinoma, all lesions should be resected.
Differential diagnosis Enlargement of the thymus in adults may also result from its involvement by Hodgkin’s disease, non-Hodgkin’s lymphoma, or acute lymphocytic leukemia. It is important to be aware of the presence or otherwise of these diseases in making a differential diagnosis.
Key points Thymoma and thymic carcinoma are distinguishable by imaging only if the invasion of surrounding structures can be demonstrated.
Thymic Cysts
Brief definition Cysts of the thymus may be congenital or acquired. The thymus originates from the third pharyngeal pouch, and cysts may develop along the path by which it descends from the level of the pharynx to the anterior mediastinum at the level of the aortic arch. The peak incidence is from 3 to 15 years of age.
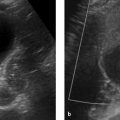
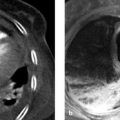
Imaging signs Thymic cysts display CT features that are characteristic of cysts: an enhancing wall with contents that are isodense to water, or hyperdense if intracystic hemorrhage has occurred (▶ Fig. 1.16). MRI shows the high T2W signal intensity and low T1W signal intensity that are typical of cysts. Thymic cysts may form outside or inside the thymus.

Fig. 1.16 Thymic cyst. CT scan demonstrates the thin-walled cyst anterior to the aortic arch.
Related posts:
Stay updated, free articles. Join our Telegram channel

Full access? Get Clinical Tree


