Anatomy
Cardiac Borders
During embryogenesis, the heart initially forms as a symmetrical midline organ in the chest and subsequently undergoes a rotation in which the cardiac apex is slightly raised and rotated to the left. This process moves the right ventricle to a position directly behind the sternum. Approximately two-thirds of the heart is to the left of the midline and one-third is to the right. The left atrium rotates posteriorly; a blind pouch in its wall, the left atrial appendage, contains stretch receptors and forms atrial natriuretic peptide (ANP) in response to atrial wall distension.
Selection of modalities Chest radiography is the imaging modality of first choice for examining patients with unexplained cardiac disease. It is also useful in the follow-up of patients with known heart disease. CT is used for risk stratification and for imaging the coronary arteries in patients with an intermediate pretest probability. In evaluation of transcatheter aortic valve implantation (TAVI), CT is used to measure the dimensions of the aortic annulus and the distance between the origins of the coronary arteries. MRI is the gold standard for the quantification of regional and global cardiac function. For this the ventricles are covered with contiguous slices and their volumes are measured. This differs from echocardiography, in which the chamber volumes are not measured directly but derived from geometric assumptions based on short-axis and long-axis scans. As a result, the determination of functional parameters by echocardiography is imprecise, especially in diseased hearts with changes in ventricular shape. When it comes to perfusion imaging, MRI is superior to single-photon emission computed tomography (SPECT) in its sensitivity and specificity, and its use for detecting perfusion defects is already recommended in professional guidelines. 1 MRI is used for the assessment of myocardial viability after heart attacks. Additionally, MRI has become well established for the characterization of cardiomyopathies, the examination of patients with cardiac tumors, and the examination of patients with congenital heart disease based on its ability to measure flow and also to quantify cardiac function.
Radiographic landmarks
PA radiograph (standard projection for radiographs in the standing position):
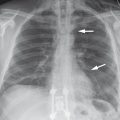
The right atrium forms the right border of the cardiac silhouette. It forms a convex bulge toward the lung and is continuous superiorly with the superior vena cava (▶ Fig. 2.1).
The left ventricle forms the left border of the cardiac silhouette. Just above it is a small portion of the left atrial appendage and the left pulmonary trunk, followed by the aorta (see ▶ Fig. 2.1).
Lateral radiograph:
The right ventricle forms the retrosternal border of the cardiac silhouette. It is continuous superiorly with its outflow tract, the pulmonary trunk.
The left atrium forms the posterior border (see ▶ Fig. 2.1) The inferior vena cava is visible inferiorly as a small triangle.

Fig. 2.1 Radiographic borders of the heart and great vessels. (a) PA chest radiograph. (b) Lateral radiograph. (c) Coronal image reformatted from a CT data set. (d) Sagittal image reformatted from a CT data set. LA, left atrium, LPA, left pulmonary artery, LV, left ventricle, RA, right atrium, RPA, right pulmonary artery, RV, right ventricle, RVO, right ventricular outflow tract, IVC, inferior vena cava, SVC, superior vena cava.
Cardiac Chambers (▶ Fig. 2.2)

Fig. 2.2 Cardiac chambers and great vessels on axial CT scans. (a) Pulmonary trunk (Tr), ascending aorta (AA), descending aorta (DA), and superior vena cava (SVC). (b) Right coronary artery (RH). (c) Left coronary artery (LH) and right ventricular outflow tract (RVO). (d) Left atrium (LA). (e) Left ventricle (LV). (f) Right ventricle (RV) and right atrium (RA).
The left ventricle is conical in shape. In a healthy heart, imaging of the left ventricle in slices directed at 90° to its long axis yields a series of circular cross sections of the chamber (▶ Fig. 2.3). Called “short-axis views” of the left ventricle, they represent the standard slice orientation for cardiac imaging by MRI, echocardiography, and CT. Volume measurements are easily performed in this slice orientation by scanning the left ventricle from the apex to the base (valvular plane) in contiguous slices and then summing the areas of the slices. The maximum wall thickness measured in the septum during diastole should not exceed 12 mm (▶ Fig. 2.4). The left ventricle contains the two papillary muscles (anterior and posterior papillary muscles). The muscles are connected to the mitral valve by fine tendons called the chordae tendineae. The left ventricle is less trabeculated than the right ventricle. This difference is grounded in embryogenesis: The myocardium of both ventricles initially has a spongy structure and is composed of very heavily trabeculated muscle tissue. The outer portions of each ventricle subsequently fuse to form a compact wall. This process is more pronounced on the left side than on the right, with the result that the left ventricle is less trabeculated but has a thicker wall.

Fig. 2.3 Standard slice orientations for cardiac imaging. (a) The two-chamber view displays the left atrium and left ventricle. (b) The four-chamber view displays both atria and ventricles. (c) The three-chamber view shows the left atrium, left ventricle, and left outflow tract. (d) The image plane can be angled, as indicated in (a) and (b), to obtain short-axis slices of the left ventricle. A series of these slices can provide complete coverage of the left ventricle.

Fig. 2.4 Four-chamber view. (a) Solid arrow: anterior papillary muscle; open arrow: chordae tendineae. The right ventricle (RV) is more trabeculated than the left ventricle. (b) To check for myocardial hypertrophy in the left ventricle, the septum is measured as shown (line 1) in an end-diastolic view. The diameter should not exceed 12 mm. To check for right ventricular hypertrophy, the diameter of the free wall (line 2) is measured. It should not exceed the normal value of 4.5 mm. With a value of 6 mm or more, hypertrophy is present.
Note
The maximum wall thickness of the left ventricle should not exceed 12 mm (measured in the septum during diastole). The maximum wall thickness of the right ventricle in a healthy individual is generally less than 6 mm, measured in the free wall of the right ventricle (see ▶ Fig. 2.4). Measurements that exceed those values indicate hypertrophy of the chamber in question. This hypertrophy may result from a chronic pressure increase due, for example, to pulmonary or aortic valve stenosis, arterial hypertension, or pulmonary hypertension. It may also result from a chronic (obstructive) hypertrophic cardiomyopathy due to a genetic cause.
Imaging landmarks A uniform slice orientation must be used in comparing different imaging modalities such as echocardiography or SPECT with MRI. The slice orientations in MRI are referred to the axes of the left ventricle, as in echocardiography, so as to obtain reproducible imaging planes (see ▶ Fig. 2.3). The position of the diaphragm, which is influenced by the volume of intra-abdominal fat, contributes to positional variants such as a heart that is broadly apposed to the diaphragm or one that is narrower and more upright. The orientation of the slices must accordingly be individually adapted. To aid location description for the pathologist, the left ventricle is divided into a basal portion (valvular third), a midventricular portion (middle third), and an apical portion (apical third; ▶ Fig. 2.5). It is also customary to further subdivide the left ventricle into 17 segments based on a system first adopted for echocardiography in the late 1980s and later applied to MRI. Each third is systematically divided into segments that are designated with the appropriate descriptors. The anterior wall has one segment at each of at the basal, midventricular, and apical levels, and each segment is designated by its level and the word “anterior”—thus, basal anterior, midventricular anterior, and apical anterior. The same is done with the posterior wall, using the designation “inferior” (basal inferior, and so on). The septum and lateral wall are each divided into a basal and midventricular segment (inferoseptal and inferolateral, anteroseptal and anterolateral). This segmentation scheme is illustrated in ▶ Fig. 2.6. The anterior and inferior attachments of the right ventricle serve as landmarks for determining the position of the septal segments. The segments in the lateral wall are designated accordingly (basal inferolateral, and so on).

Fig. 2.5 The ventricles are divided into a basal (valvular) third, midcavity third, and apical third.

Fig. 2.6 Segmentation of the left ventricle. (a) Basal third. 1, basal anterior; 2, basal anteroseptal; 3, basal inferoseptal; 4, basal inferior; 5, basal inferolateral; 6, basal anterolateral. (b) Midventricular third. 7, midanterior; 8, midanteroseptal; 9, midinferoseptal; 10, midinferolateral; 12, midanterolateral. (c) Apical third. 13, apical anterior; 14, apical septal; 15, apical inferior; 16, apical lateral. (d) Apex (17).
Note
In patients with ischemic heart disease, the location of the ischemic region helps to identify the affected coronary vessel. If the coronary circulation is “balanced,” the anterior and anterolateral segments are supplied by the anterior interventricular branch of the left coronary artery, the inferolateral and anterolateral segments by the circumflex branch of the left coronary artery, and the inferoseptal and inferior segments by the right coronary artery. The segmental distribution pattern is different in hearts with a right-dominant or left-dominant coronary circulation.
The PA chest radiograph is taken with the patient standing upright and the X-ray source placed 2 meters from the detector (▶ Fig. 2.7a). Because the heart occupies a retrosternal position and is close to the detector, it is projected in approximately its true size. For the same reason, the lateral radiograph is taken with the patient lying on his or her left side. The situation is different with an AP radiograph taken in a supine position. In this case the X-ray tube is positioned closer to the cassette, while the heart is farther away. This causes the heart to be projected larger than its actual size (▶ Fig. 2.7b).

Fig. 2.7 Magnification effect of cardiac projections on chest radiographs. Diagrammatic representation. W, actual heart size, P, projected heart size. (a) The magnification effect is minimal in the upright PA radiograph owing to the proximity of the heart to the detector. (b) With a supine AP radiograph, the heart is projected considerably larger than its true size.
Note
In an upright chest radiograph taken at full inspiration, the transverse cardiac diameter should not exceed 50% of the transverse thoracic diameter (▶ Fig. 2.8). In a supine radiograph, it should not exceed 60% of the transverse thoracic diameter.
When the heart decompensates in response to a chronic pressure load or volume load, the result is cardiac enlargement.

Fig. 2.8 Cardiothoracic ratio. The thoracic diameter T is determined between the inner rib margins at the level of the left hemidiaphragm. The transverse diameter on each side is measured at right angles from the midline to the outermost point of the cardiac silhouette (HL and HR) and the values are summed. The normal cardiothoracic ratio is less than 0.5 when measured in the upright radiograph and less than 0.6 in the supine radiograph.
2.1.2 Diseases
Heart Failure
Brief definition Heart failure develops as a result of myocardial damage, which can have many potential causes. With heart failure due to coronary disease, an acute infarction and, in certain cases of myocarditis, pulmonary congestion develop as a result of backward failure. This congestion can be recognized from typical radiographic signs. In patients with right ventricular failure, on the other hand, the principal effect is a damming back of blood in the systemic circulation, with associated lower leg edema and nocturia. Frequently both chambers are affected, resulting in mixed symptoms. In these cases, however, minimal changes may be noted in the chest radiograph if the inability of the left ventricle to deliver adequate blood to the systemic circulation is balanced by an absence of congestion in the pulmonary circulation due to right ventricular failure.
Caution
An acute pressure load on the heart, due for example to acute fulminant pulmonary embolism, leads to cardiac dilatation in the acute stage. In contrast, a chronic pressure load on the heart due to aortic or pulmonary valve stenosis, arterial hypertension, or pulmonary arterial hypertension leads to cardiac hypertrophy. This hypertrophy leads to wall thickening with no increase in outer diameter (concentric hypertrophy) and is not detectable on chest radiographs (▶ Fig. 2.9).

Fig. 2.9 Concentric hypertrophy of the left ventricle in a patient with aortic stenosis. The septum has a wall thickness of 18 mm at end diastole. The heart is not enlarged.
Imaging signs Standard chest radiographs will usually provide an acceptable initial imaging work-up. If the cause of heart failure is still unknown and must be established, MRI is the modality of choice in patients with suspected myocarditis or cardiomyopathy. The imaging signs of pulmonary congestion due to acute left ventricular failure are:
Upper lobe diversion: The first and most sensitive sign is the redistribution of blood to the upper lobes in the standing patient. In a normal chest radiograph, the vessels in the lower lung zones are more prominent than the vessels in the upper zones due to the hydrostatic pressure gradient. In patients with left heart failure, the upper lobe vessels are prominent (passively dilated) due to the increased blood volume in the pulmonary circulation (▶ Fig. 2.10).
Fluid accumulation in bronchial walls and vessels: As the intravascular pressure in the pulmonary veins continues to rise, fluid leaks into the interstitium. The interstitial fluid accumulates around bronchi and causes thickening of the bronchial walls. Vessels become indistinct due to edema in the perivascular connective tissue.
Thickening of interlobular septa: The edema also causes thickening of the fibrous interlobular septa (▶ Fig. 2.11), which appear as lines at sites where they are orthogonal to the X-ray beam. These septal lines are called Kerley lines (after Sir Peter Kerley, who first described them). On the PA radiograph, Kerley lines most commonly appear at the lung base close to the cardiophrenic angle. Lines at that location are called Kerley B lines (▶ Fig. 2.12). Kerley A lines extend radially from the hila to the periphery. Kerley C lines are short lines distributed in a reticular pattern over the lung parenchyma. Kerley A and C lines are rarely visible.
Alveolar edema: A further pressure rise in the pulmonary veins causes fluid leakage into the alveoli. Auscultation at this time may detect audible rales. The chest radiograph shows pulmonary edema and congestive infiltrates (see ▶ Fig. 2.12). The lung opacities may show a butterfly pattern that initially spares the periphery.
Pleural effusion: The additional development of right heart failure leads to dilatation of the superior vena cava and azygos vein and to pleural effusion. The pleural effusion may be limited to one side.
Caution
Congestive infiltrates are sometimes difficult to distinguish from pneumonic infiltrates. In doubtful cases the radiographic findings should be correlated with clinical symptoms. Pulmonary edema and congestive infiltrates, unlike pneumonic infiltrates, will improve within a few hours when the patient is treated for heart failure.
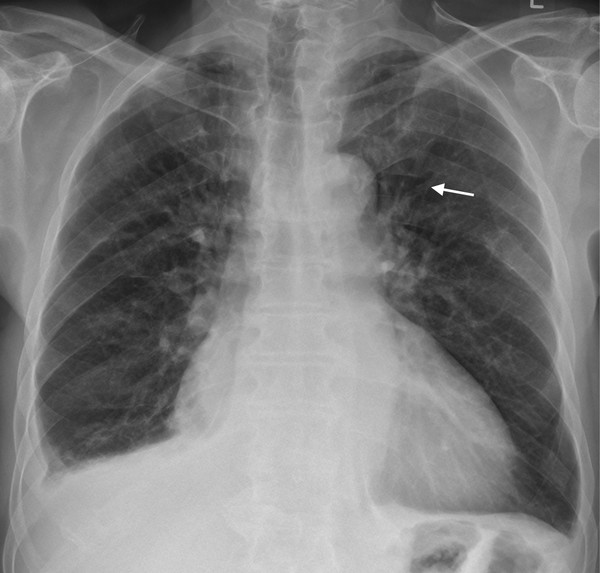
Fig. 2.10 Upper lobe blood diversion. The upper lobe vessels are markedly dilated (arrow) compared with the vessels in the lower zones. The heart is enlarged, and a right-sided pleural effusion is present.

Fig. 2.11 Thickening of the interlobular septa due to pulmonary venous congestion. The arrows point to the interlobular septa. The bronchial walls are thickened.

Fig. 2.12 Acute pulmonary venous congestion, grade IV. Note the Kerley A lines (dotted arrow), Kerley B lines (arrow), bronchial wall thickening (arrowhead), and alveolar edema.
Differential diagnosis With a unilateral pleural effusion and no other abnormalities (no infiltrates, normal cardiac size, no other signs of pulmonary congestion), tuberculosis should be considered in the differential diagnosis. A malignant pleural effusion due to pleural carcinomatosis may also be limited to one side. In this case the history is usually helpful in narrowing the diagnosis.
Pitfalls Overhydration, which may result from rapid IV volume infusion or a positive fluid balance in renal failure, has to be differentiated from heart failure.
Key points Acute heart failure may have diverse causes. The initial imaging study is the chest radiograph. CT and MRI are available for further evaluation, depending on the cause.
Coronary Heart Disease and Myocardial Infarction
Brief definition Coronary heart disease refers to myocardial ischemia resulting from atherosclerosis of the coronary arteries that has led to coronary stenosis or occlusion. An acute occlusion may cause myocardial infarction. With its predominantly aerobic metabolism, the myocardium has a high oxygen demand even at rest. Oxygen saturation is depleted to approximately 20% by the time the blood has passed through the myocardium and reached the venous vessels. With stress or exercise, the myocardial oxygen demand may increase 4- to 6-fold. The increased demand is met by dilation of the coronary arteries; this mechanism increases blood flow without changing the blood volume in the tissue. Blood flow increases from approximately 1.2 mL/min/g to approximately 4.0 to 6.7 mL/min/g during exercise. The pathophysiology of coronary stenosis and occlusion is as follows:
Stenosis: The oxygen demand of myocardium supplied by a stenotic vessel is met by dilation of that vessel. As a result, luminal narrowing by up to 85% will not cause a reduction of myocardial perfusion at rest. With stress or exercise, however, adequate blood flow cannot be maintained because the vessel has already exhausted its potential for dilation. Stenoses of approximately 50% or more become hemodynamically significant during exercise. Moreover, a “steal effect” occurs as exercise induces dilatation of the nonstenotic vessels, thereby increasing blood flow to regions supplied by those vessels at the expense of the area supplied by the stenosed vessel. The pressure falls in the area beyond the stenosis, and blood flow declines significantly compared with myocardium supplied by nonstenotic vessels and also with the affected area at rest. The tissue becomes hypoperfused, and an ischemic cascade begins (▶ Fig. 2.13). The earliest manifestation of this process is a perfusion defect that is detectable by MRI. The decreased oxygen supply in the area supplied by the stenosed coronary artery initially leads to a reduction in the activity of the respiratory chain as an aerobic metabolic pathway. The synthesis of creatine phosphate and adenosine triphosphate (ATP) is diminished. Initially this leads only to diastolic dysfunction, but this is followed later by systolic dysfunction. As the duration and severity of the ischemia increase, changes begin to appear in the electrocardiogram (ECG). Further progression of the ischemic changes is manifested by anginal symptoms. The maintenance metabolism of the cells is still intact, however, so that even a high-grade stenosis, unlike occlusion, will usually not precipitate an infarction.
Occlusion: After the acute occlusion of a coronary artery the respiratory chain is almost completely disrupted within 10 seconds. The intracellular levels of creatine phosphate and ATP show a steady decline. Meanwhile, the myocytes redirect their metabolism to anaerobic pathways, leading to lactic acidosis and the formation of free radicals. After an ischemic period of 20 to 30 minutes, the membrane potential of the myocytes can no longer be maintained. Calcium and potassium ions flow into the cell, and this electrolyte shift leads to cellular edema. Eventually the cellular edema and free radicals cause a loss of cell membrane integrity, resulting in cellular necrosis. The necrosis and interstitial edema in an acute infarction increase the distribution volume for extracellular contrast media that are routinely used in clinical imaging. When an acute myocardial infarction occurs, the myocytes in the area supplied by the occluded vessel do not all die simultaneously. Necrosis begins at the subendocardial level. As the duration of the ischemia increases, the necrosis spreads like a wavefront from the subendocardial zone across the central wall layers to the epicardial wall layers. 2 The lateral boundaries of the necrosis depend on the size of the area supplied by the occluded vascular branch. The transmural extent of necrosis depends on the duration of ischemia. If the infarcted area is large, acute heart failure with pulmonary venous congestion may develop. If the vessel remains occluded for more than 2 hours, percutaneous vascular recanalization will not consistently restore blood flow to the capillaries because the swelling of endothelial cells, capillary microthrombi, and arteriolar spasms lead to microvascular obstruction, with a failure of reperfusion at the tissue level. Microvascular obstruction is defined as an absence of myocardial perfusion following successful recanalization of the coronary supply artery. Morbidity and mortality are increased in patients with microvascular obstruction. During the first 72 hours after an infarction, depending on the extent of the infarcted myocardium and on the preload and afterload, thinning of the necrotic tissue occurs due to the decreased strength of the affected tissue and its lack of stabilization by scarring, which has yet to occur. The thinning causes an apparent enlargement of the infarcted area. In extreme cases these changes may lead to ventricular rupture. Over a period of approximately 6 weeks, the necrotic myocardium is replaced by scar tissue. Its wall is markedly thinner compared with noninfarcted tissue. The remodeling processes are not limited to the infarcted area, however, but involve the entire heart. The increased wall tension leads to hypertrophy of the myocytes and enlargement of the left ventricular cavity.

Fig. 2.13 Ischemic cascade. Diagrammatic representation of the pathophysiologic events associated with increasing stenosis of a coronary vessel (right half of diagram) and an occlusion of increasing duration (left half of diagram). MRI can detect a perfusion defect before any other changes appear. As a result, diastolic dysfunction is present even before ECG changes are visible or the patient develops anginal complaints. With the occlusion of a coronary vessel, infarction spreads from the subendocardial to subepicardial level over a period of approximately 20 minutes. By approximately 2 hours the infarction is transmural.
Clinical features Coronary heart disease with hemodynamically significant coronary stenosis presents clinically with stable angina pectoris, which is characterized by exertional dyspnea and chest pain or discomfort in response to stress or exercise. The complaints are relieved within minutes by rest. Patients with an acute infarction experience crushing chest pain radiating to the left arm and neck as well as dyspnea.
Selection of modalities The appropriate imaging modality depends on the clinical question and is selected as follows:
Asymptomatic patients: These patients first undergo a risk assessment based on the risk factors identified in the Framingham Study. 3 In patients with an intermediate risk of 10 to 20% of experiencing a cardiovascular event within the next 10 years, risk assessment can be improved by CT quantification of coronary artery calcium to obtain an Agatston score. This test uses unenhanced, ECG-gated/triggered cardiac CT to determine the calcium volume in the coronary vessels.
Symptomatic patients with stable angina pectoris and intermediate pretest probability: Initial evaluation of these patients consists of an MRI perfusion study and CT angiography (CTA) of the coronary arteries to avoid invasive testing.
Patients with unstable angina pectoris and no ECG or laboratory changes: When clinically stabilized, these patients can undergo an MRI perfusion study to exclude hemodynamically significant stenoses.
Patients with non–ST segment elevation myocardial infarction (NSTEMI): CTA is performed in these patients to exclude coronary stenoses. MRI can be performed to rule out suspected myocarditis or takotsubo cardiomyopathy.
Patients with ST segment elevation myocardial infarction (STEMI): In this case MRI can define the infarcted area and detect the presence of microvascular obstruction as a basis for making a prognosis and planning further treatment.
Imaging signs
CT: An unenhanced, ECG-gated data set (▶ Fig. 2.14) is acquired and computer-analyzed to determine the calcium load of the coronary arteries and obtain an Agatston score (named for Arthur Agatston, who developed this technique in the mid-1980s). First, the maximum plaque density is determined in 3-mm-thick image slices. Based on this value, a weighting factor is assigned (130–199 HU, weighting factor = 1; 200–299 HU, weighting factor = 2; 300–399 HU, weighting factor = 3; 400 HU or more, weighting factor = 4). Next, the area of all calcified plaques in the entire data set is determined. The measured area in square millimeters is multiplied by the weighting factor to give the Agatston score (▶ Table 2.1). This score, when correlated with age and gender, supplies information on the probability of an infarction. Stenoses in the coronary vessels can be visualized by ECG-gated CT after IV injection of contrast medium. Landmarks on CT are the left and right coronary arteries, which arise respectively from the right and left aortic sinuses (see ▶ Fig. 2.2). The left coronary artery branches almost at once into the anterior interventricular branch and the circumflex branch. The anterior interventricular branch runs on the anterior surface of the heart in the sulcus between the ventricles. The circumflex branch runs on the posterior surface of the heart. The coronary arteries can be visualized by multiplanar reformatting of CT data (▶ Fig. 2.15), which can differentiate soft plaques from calcified plaques (▶ Fig. 2.16). The degree of stenosis is quantified by comparing the vascular diameters proximal and distal to the stenosis with the vascular diameter at the stenosis.
MRI: For assessment of viability, regional and global myocardial function are quantified and the scarred area is visualized with IV contrast medium for direction of treatment planning or forming a prognosis. Perfusion imaging can be added to the protocol to determine the presence or significance of coronary artery stenoses.
Assessment of regional function: Regional function is evaluated with an ECG-gated TrueFISP (true fast imaging with steady precession) sequence (▶ Fig. 2.14) or, less commonly, with a GRE sequence. At least 30 image frames are acquired to document the cardiac cycle. Data acquisition is done sequentially so that the k-space lines of a single frame are acquired during several consecutive heartbeats (▶ Fig. 2.17), and the cine sequence for a given slice is acquired over several R–R cycles. This leads to poor image quality in patients with an arrhythmia. For functional analysis, individual slices are acquired in the two-, three-, and four-chamber views, producing a stack of slices that cover the left ventricle from base to apex. In this way each segment is imaged in two planes. Areas of regional dysfunction in the left ventricle are described with regard to their location and extent. Regional function is defined as follows:
Normokinesis: normal contractile function.
Hypokinesis: reduced contractile function.
Akinesis: contractile function is absent, or at most the affected areas move passively with the motion of adjacent unaffected regions.
Dyskinesis: paradoxical outward motion of the affected wall segments during systole.
Assessment of global function: Global cardiac function is evaluated by the Simpson disk method. At a workstation, end systole and end diastole are first determined in short-axis slices, then the endocardial and epicardial myocardial borders are outlined in the slices. The area is multiplied by the slice thickness, including the interslice gap, and these values are added together to give the end-diastolic and end-systolic volumes. The stroke volume is the difference between the end-diastolic and end-systolic volumes. The ejection fraction is calculated by dividing the stroke volume by the end-diastolic volume. Multiplying the stroke volume by the heart rate gives the cardiac output. Myocardial mass can be determined by also outlining the epicardial boundary of the ventricle so that the specific weight (1.05 g/mL) can be multiplied by that volume. Myocardial mass is an independent predictor of cardiac mortality. The myocardial mass can be normalized to body surface area to improve the comparability of the data. The Dubois method can be used to determine body surface area.
Assessment of perfusion: Perfusion imaging may employ a fast GRE sequence, TrueFISP sequence, or hybrid GRE-EPI sequence. Stress perfusion imaging should precede imaging at rest. The left ventricle is scanned with a minimum of three slices. These slices are acquired in short-axis planes and are individually positioned for each patient by spacing the slices so that the apical, midventricular, and basal portions of the ventricle are each imaged with one slice. Unlike the cine sequences, each slice is acquired during one R–R interval to image the passage of the contrast bolus with acceptable temporal resolution (▶ Fig. 2.18).
Delayed enhancement: In most protocols, perfusion imaging is followed by a heavily T1-weighted GRE sequence to evaluate delayed enhancement (▶ Fig. 2.19). In patients with an old myocardial infarction, capillary density is decreased in the scarred myocardium, resulting in a perfusion defect at rest and stress that coincides with the infarcted area. This is called a “fixed perfusion defect” (▶ Fig. 2.20). If imaging shows a perfusion defect without a myocardial infarction on delayed enhancement imaging, this indicates a stenosis in the vessel supplying the affected area (▶ Fig. 2.21). The distribution volume for extracellular contrast medium is increased in acutely infarcted myocardium due to edema and cellular necrosis because contrast medium can also enter the necrotic cells as a result of loss of cell membrane integrity. With an old infarction, the enlarged extracellular matrix again provides a greater distribution volume for extracellular contrast medium (▶ Fig. 2.22). The location and transmural extent of delayed enhancement is a very useful indicator for prognosis and treatment planning (▶ Fig. 2.23, ▶ Fig. 2.24). When the myocardium in the area supplied by a stenosed vessel is viable, revascularization offers a significantly better prognosis for morbidity and mortality than that with conservative drug therapy. Conversely, the risk of arrhythmia after revascularization is increased in patients found to have nonviable tissue.

Fig. 2.14 Calcification in the right coronary artery. Single frame from an unenhanced ECG-gated CT data set.

Fig. 2.15 Visualization of the coronary arteries in multiplanar reformatted images. (a) Right coronary artery. (b) Circumflex branch of the left coronary artery. (c) Anterior interventricular branch of the left coronary artery.
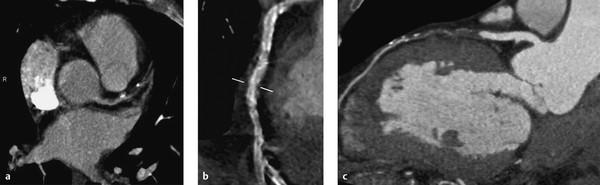
Fig. 2.16 Soft plaque and calcified plaques in coronary arteries. CT, axial scan and multiplanar reformatted images. (a) Soft plaque causing a high-grade stenosis in the right coronary artery. (b) Chronic complete occlusion of the left coronary artery. (c) Short segmental occlusion of the anterior interventricular branch.

Fig. 2.17 The cardiac cycle imaged in cine mode with segmented data acquisition. Several phases of the cardiac cycle are imaged in single frames, which are composited to form a video sequence. Acquisition is continued for several heartbeats (R–R intervals). Multiple k-space cells are acquired in each frame per cardiac cycle until the k-space for a single image is filled with data from multiple heartbeats.

Fig. 2.18 Myocardial perfusion study. Single frames from a perfusion sequence. Image acquisition is started before injection of contrast medium to image the first pass of the contrast bolus through the heart. Generally at least three slices can be acquired within the allotted timeframe.

Fig. 2.19 Schematic representation of a typical protocol for a myocardial viability study that includes perfusion imaging.

Fig. 2.20 Fixed perfusion defect. (a) Midinferior perfusion defect. (b) T1W inversion recovery GRE sequence to show delayed enhancement. Transmural infarction corresponds to the perfusion defect in (a).

Fig. 2.21 Perfusion defect without myocardial infarction. (a) Septal perfusion defect. (b) T1W inversion recovery GRE sequence to show delayed enhancement. Absence of a visible infarction confirms viability of the myocardium supplied by the stenotic artery.

Fig. 2.22 Diagrammatic representation of the distribution volume of extracellular contrast medium in the myocardium. Distribution volume in healthy myocardium (intravascular space and interstitium, total of 18 to 22%), in acutely infarcted myocardium (up to 100%), and chronically infarcted myocardium (variable due to varying cellularity of the scar, but markedly higher than in healthy myocardium).

Fig. 2.23 Diagram of delayed enhancement in the myocardium. T1W inversion recovery GRE sequence. The initial 180° pulse inverts all the spins, which then return to their original position in accordance with their T1 time. The excitation pulse (α) is applied at the null point of healthy myocardium in order to null the signal from that tissue. Mz = magnetization.

Fig. 2.24 Acute transmural myocardial infarction with microvascular obstruction in the septum. (a) T2W image shows edema in the septum. (b) T1W inversion recovery GRE sequence shows delayed enhancement consistent with transmural infarction. The absence of subendocardial enhancement indicates microvascular obstruction. (c) Cine image at end diastole. (d) Cine image at end systole. The infarcted area is akinetic.
Table 2.1 The Agatston score for evaluating the calcium load in coronary arteries
Agatston score
Interpretation
0
No calcification
1–10
Minimal coronary calcification
11–100
Mild coronary calcification
101–400
Moderate coronary calcification
401 or more
Severe coronary calcification
Note
Viable myocardium—including “hibernating” myocardium (hypoperfused tissue that is functionally suppressed due to coronary stenosis but is not necrotic) and “stunned” myocardium (tissue that is functionally suppressed following an ischemic insult)—does not show delayed enhancement.
With regard to prognosis, regional function may recover if the infarction involves less than 50% of the wall thickness. If more than 75% of the wall thickness is affected, functional recovery can no longer occur.
Wall thickness in the peri-infarct zone—noninfarcted myocardium bordering the infarction—can be used to evaluate ventricular remodeling. If it is more than 4.5 mm in diastole, it is reasonable to predict a recovery of contractile function.
Cardiomyopathies
In 2006 the American Heart Association (AHA) published a classification of cardiomyopathies that defines “primary cardiomyopathies” as those that are confined to the heart muscle. 3 They are further classified by etiology as genetic, acquired, or mixed genetic and nongenetic. “Secondary cardiomyopathies” are those that occur in the setting of systemic diseases.
Myocarditis
Brief definition Myocarditis is an inflammatory disease of the myocardium due to various causes. On the basis of the 1995 WHO classification, which is the most up-to-date classification at the time of writing (2017), myocarditis is classified as a “specific (inflammatory) cardiomyopathy.” 4 The 2006 definition of the AHA classifies it as a “primary cardiomyopathy” in the acquired subgroup. 3 The gold standard for diagnosis is myocardial biopsy. Histological evaluation is based on the Dallas criteria for myocarditis, which require the presence of inflammatory infiltrate and associated myocyte necrosis. Most cases of myocarditis have a viral etiology. The most common viral pathogens are enteroviruses, parvoviruses, Coxsackie B virus, HIV, and hepatitis C virus. If the inflammatory process involves the pericardium, the condition is called “perimyocarditis.” The incidence is estimated at 10 per 100,000 population per year but is not precisely known due to the large number of asymptomatic cases.
Clinical features Acute myocarditis is clinically silent in a great many cases or is associated with flulike symptoms such as fatigue, aching limbs, and dyspnea. Arrhythmias are sometimes present at rest or during exercise, however, and may even lead to sudden cardiac death. Additionally, acute myocarditis may produce ischemic complaints with chest pain. Sepsis may develop in some cases, especially those with a bacterial etiology. Acute myocarditis usually resolves without sequelae, but 10% of patients will develop dilated cardiomyopathy.
Imaging signs The diagnostic algorithm includes clinical examination, blood work, ECG (which may show extrasystoles and ST elevation), and echocardiography (for heart size, function, possible pericardial effusion). The chest radiograph may be normal, given the variable presentation of myocarditis, but patients with left ventricular dysfunction may show signs of pulmonary venous congestion or ventricular dilatation (▶ Fig. 2.25). The modality of choice is MRI, which is particularly useful in differentiating myocarditis from myocardial infarction in patients with ischemic symptoms. A comprehensive protocol should be followed in patients with suspected myocarditis. 5 Cine sequences are acquired in standard planes to evaluate regional and global function. Guidelines recommend fat-suppressed T2W imaging of the left ventricle in short-axis and long-axis planes. This will reveal circumscribed edema in many patients with acute myocarditis (▶ Fig. 2.26). Diffuse involvement or persistent viral replication may lead to generalized myocardial edema with increased signal intensity throughout the myocardium. 6 Generalized edema is not apparent on visual assessment. Instead, the signal intensity of the myocardium should be measured and divided by the signal intensity of the skeletal muscle. The resulting value, called the edema ratio, is less than 1.9 in healthy subjects. A higher value is predictive of myocarditis with a sensitivity of 76% and a specificity of 95.5%. 5 Next, T1W (T)SE images are acquired before IV injection of contrast medium and in the equilibrium phase 9 to 12 min after injection of contrast medium (0.2 mmol/kg BW of a gadolinium-based extracellular contrast medium). This sequence is obtained to determine early enhancement. As in the determination of edema ratio, global relative enhancement is calculated from the signal intensity of the myocardium and skeletal muscle using the following formula:

where
gRE = global relative enhancement.
SImyocardium postc = signal intensity of myocardium after administration of contrast medium.
SImyocardium prec = signal intensity of myocardium before administration of contrast medium.
SImuscle postc = signal intensity of skeletal muscle after administration of contrast medium.
SImuscle prec = signal intensity of skeletal muscle before administration of contrast medium.

Fig. 2.25 Myocarditis in a 6-year-old boy. (a) Chest radiograph shows enlargement of the heart. (b) Postcontrast image shows slight patchy enhancement (arrow). (c) Four-chamber view, TrueFISP sequence. The left ventricle is markedly dilated.
The cutoff value for healthy myocardium is <4. The early-enhancement phase of the examination is followed by the delayed-enhancement protocol. This may show patchy enhancement, which differs from the enhancement seen in ischemic disease in that it does not follow a subendocardial pattern (see ▶ Fig. 2.26). Depending on the extent of necrosis and edema, this enhancement pattern may regress with healing or may persist if confluent necrotic areas are present and scars have formed.

Fig. 2.26 Myocarditis. (a) T2W short-axis view shows patchy subendocardial edema. (b) Area of delayed enhancement (short axis) corresponds to the edema. (c) Delayed enhancement (three-chamber view).
Caution
Contrary to former belief, the distribution of edema and delayed enhancement in the myocardium is not helpful in identifying the causative agent of myocarditis. Different causative agents do not have specific sites of predilection in the myocardium.
Key points MRI is the imaging modality of choice for myocarditis. It can detect myocardial edema and can quantify edema and early enhancement.
Dilated Cardiomyopathy
Brief definition Dilated cardiomyopathy is characterized by dilatation of the cardiac chambers accompanied by severe systolic and diastolic dysfunction. It is usually secondary to an underlying systemic cause. Causative agents may include toxins (chemotherapy drugs), alcohol, prior myocarditis that triggered an autoimmune response, or hemochromatosis. No cause can be identified in one-half of patients. In 30% of patients the disease is familial with an autosomal dominant mode of inheritance. . Dilated cardiomyopathy is the second most common cause of heart failure and the most frequent reason for heart transplantation, as the disease is progressive regardless of its cause and is associated with an annual mortality rate as high as 14%.
Clinical features The severity of heart failure determines the clinical presentation.
Imaging signs The chest radiograph shows global cardiac enlargement. Echocardiography, MRI, and CT show a dilated ventricular chamber with normal wall thickness but decreased stroke volume. On MRI, 30% of patients show midmural delayed enhancement (▶ Fig. 2.27). 7

Fig. 2.27 Dilated cardiomyopathy. Delayed enhancement. Global cardiac enlargement is present. Slight midmural enhancement is noted in the lateral wall (arrows).
Related posts:
Stay updated, free articles. Join our Telegram channel

Full access? Get Clinical Tree


