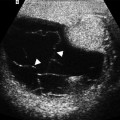
Fig. 11.1
Adrenal adenoma. Color flow Doppler ultrasound demonstrates a hypoechoic mass (arrow) with no vascularity
Adenomas may occasionally have a heterogeneous echotexture and scalloped borders.
Color flow Doppler ultrasound may reveal scant vascularity in the adenoma.
Functionality of adrenal adenomas cannot be determined by ultrasound.
Computed Tomography
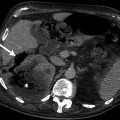
Unenhanced CT examination demonstrates well-defined masses with low attenuation (Fig. 11.2a). Hemorrhage in an adenoma can increase its attenuation value.
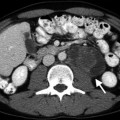
Fig. 11.2
Washout phenomena in adrenal adenoma. (a) Axial unenhanced CT demonstrates a hypodense left adrenal lesion (arrow) with attenuation of 4 HU. (b) Lesion (arrow) enhances in the portal venous phase and attenuation value is 54 HU. (c) CT at 10 min delay after intravenous contrast administration reveals contrast washout in the lesion (arrow) and density value is 23 HU. Absolute washout value is 62 %, suggesting adenoma
A density value of −10 to +10 HU is considered diagnostic of adrenal adenoma.
Average density of lipid-poor adrenal adenoma ranges between 20 and 25 HU.
Adrenal adenomas show rapid washout regardless of lipid content on contrast-enhanced CT examination (Fig. 11.2b, c).
Contrast washout characteristics of adrenal solid masses can be determined by absolute percentage washout (APW) and relative percentage washout (RPW) parameters.
APW of an adrenal mass is calculated as 1 – (attenuation value of mass after contrast enhancement on early phase (75 s) – initial attenuation value on unenhanced CT/attenuation value of mass on delayed phase (10 min) − initial attenuation value on unenhanced CT).
RPW is calculated as 1 (attenuation value of mass after contrast enhancement on early phase/attenuation value of mass on delayed phase).
A threshold value of 60 % for APW and 40 % for RPW was reported to have 100 and 97 % sensitivity with 83 and 100 % specificity values, respectively, in the diagnosis of lipid-poor adrenal adenomas.
CT histogram provides objective assessment of adrenal solid masses in terms of presence of lipid content. In CT histogram, displayed density values of adrenal solid masses enable radiologists to detect negative attenuations that represent fat content of the lesion (Fig. 11.3a, b).
Fig. 11.3
CT histogram of adrenal adenoma. Average density value of adrenal adenoma (a) and metastasis (b) on CT histograms are −0.2 and 26 HU, respectively
Bae et al. proposed using a threshold of at least 10 % negative pixels for diagnosis of an adenoma because 9.8 % was the lowest percentage of negative pixels in masses with a mean attenuation of less than 10 HU.
When a threshold of 10 % negative pixels is applied, a sensitivity of 84 % and specificity of 100 % can be achieved for adenomas.
Magnetic Resonance Imaging
Adrenal adenomas appear isointense to liver parenchyma on T1-weighted images.
On T2-weighted images, adrenal adenomas are isointense to slightly hyperintense compared to liver parenchyma.
Chemical shift imaging on MRI can detect the lipid content of a solid mass which can be helpful in differentiating adenomas from metastases (Fig. 11.4a, b).
Fig. 11.4
Adrenal adenoma. (a) In-phase image demonstrates a well-defined right adrenal gland mass (arrow). (b) Out-of-phase image reveals marked signal drop (arrow) suggestive of adenoma
Chemical shift imaging relies on the different resonance frequency rates of protons in fat and water. Protons in fat are more protected than in water; consequently, they experience less external magnetic field and therefore resonate at a lesser frequency. Signal drop occurs in adrenal adenomas on opposed-phase chemical shift imaging.
Amount of signal drop is proportional to the fat content.
Signal loss of adrenal adenomas on opposed-phase imaging can be evaluated by two parameters:
Signal loss in lesion >20 % on opposed-phase imaging in comparison to in-phase imaging.
Adrenal lesion to spleen ratio (ASR): ASR reflects the signal loss within the adrenal lesion on out-of-phase images by comparing signal intensities of adrenal lesion and spleen. ASR is calculated as [SI lesion (out of phase)/SI spleen (out of phase)]/[SI lesion (in phase)/SI spleen (in phase)] × 100. A cutoff ASR value of 70 or less was found to be 78 % sensitive and 100 % specific for the diagnosis of adrenal adenoma.
Signal intensity index refers to signal intensity in phase – signal intensity out of phase/signal intensity on in phase ×100.
Signal intensity index of adenoma is >5 %.
Signal intensity index of metastatic tumors and pheochromocytomas is <5 %.
Adrenal adenomas have rapid washout characteristics on dynamic MRI as on dynamic CT.
Apparent diffusion coefficient values obtained at diffusion-weighted MR imaging were not found useful in distinguishing adrenal adenomas from metastases.
Threshold values of 1.20 for the choline–creatine ratio (92 % sensitivity, 96 % specificity), 0.38 for the choline–lipid ratio (92 % sensitivity, 90 % specificity), and 2.10 for the lipid–creatine ratio (45 % sensitivity, 100 % specificity) enable adenomas and pheochromocytomas to be distinguished from carcinomas and metastases.
Pathology
Adrenal cortical adenoma is usually unilateral and solitary. It more commonly affects women. It is most commonly yellow, due to composition with lipid-laden cells (zona fasciculata) (Figs. 11.5 and 11.6). It may or may not have a capsule. Some contain the pigments lipofuscin and/or neuromelanin, which can impart a black color to the adenoma (“black adenoma”) (Figs. 11.7 and 11.8).
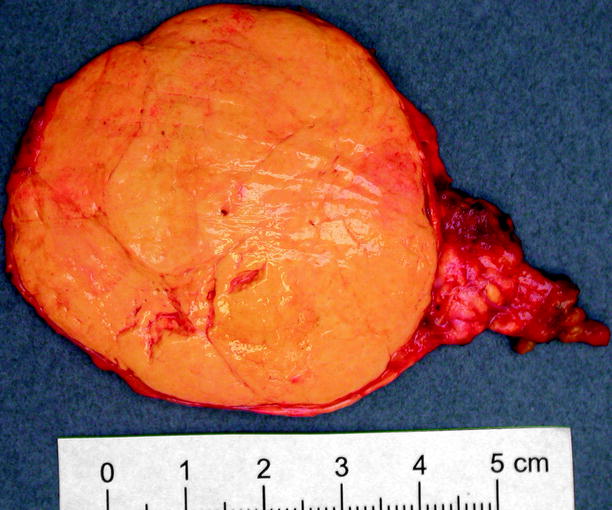
Fig. 11.5
Adrenal cortical adenoma. Most are less than 6 cm in diameter (average 3.6 cm) and weigh less than 40 g. Adenomas are usually yellow or golden yellow and are circumscribed but unencapsulated. Some show small areas of hemorrhage, fibrosis, or cystic degeneration
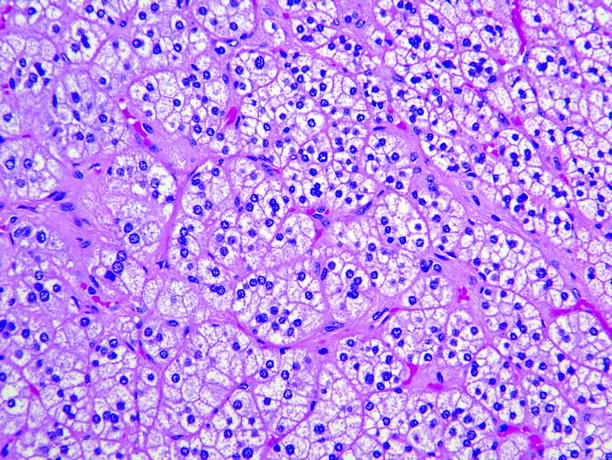
Fig. 11.6
Adrenal cortical adenoma. Tumor cells are arranged in nests or short cords, and most contain abundant lipid and are pale-staining. Minor components of smaller cells with dense eosinophilic cytoplasm are usually present, and in some adenomas, large pale “balloon cells” or clusters of spindle cells are seen. Cell nuclei are fairly uniform, and nucleoli are inconspicuous. Mitotic figures are rare, and necrosis is unusual
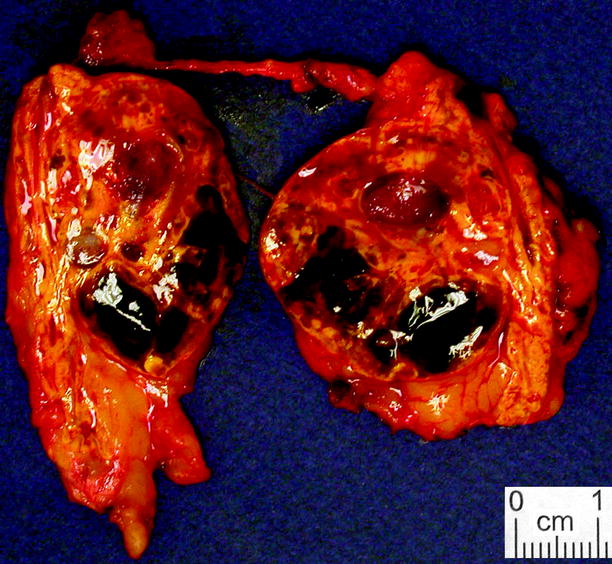
Fig. 11.7
Adrenal cortical adenoma, pigmented. Cortical adenomas sometimes exhibit widespread brown or black discoloration, to the extent that they sometimes merit the term “black adenoma” (From MacLennan and Cheng (2011), with permission)
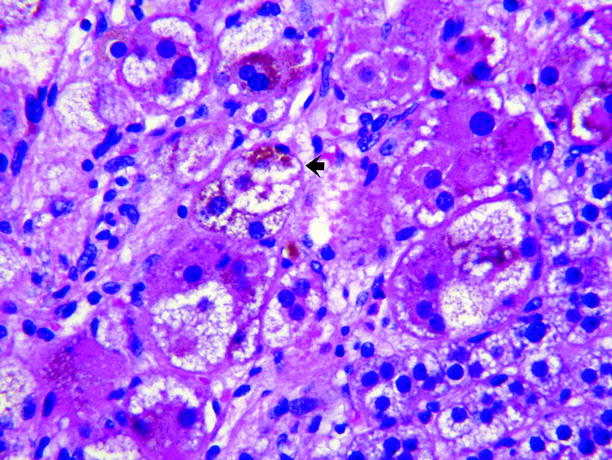
Fig. 11.8
Adrenal cortical adenoma, pigmented. The adenoma shown in Fig. 11.7 contained abundant large lipid-poor cells with dark eosinophilic cytoplasm containing abundant brown pigment, believed to be lipofuscin (arrow), which imparts the dark color of the tumor
Adrenal Myelolipoma
General Information
Adrenal myelolipomas constitute 2 % of all adrenal masses.
They are composed of mature adipose tissue admixed with hematopoietic cells (myeloid and erythroid cells and megakaryocytes).
Adrenal myelolipomas are hormonally nonfunctional benign tumors.
Unilateral myelolipomas are more likely to involve the right adrenal (68–78 % predominance).
Calcification can be observed in up to 20 % of adrenal myelolipomas.
Presence of macroscopic fat in an adrenal mass is pathognomonic for myelolipoma. Nonfatty components represent bone marrow.
Myelolipomas are usually identified incidentally, but they can present as large abdominal masses resulting in abdominal discomfort. Hemorrhage, which is the main complication of adrenal myelolipoma, may cause pain, nausea, vomiting, or hypotension.
Cases that cannot be definitively diagnosed radiologically, due to their fat content, require histopathological evaluation.
A large myelolipoma may be difficult to distinguish from other retroperitoneal tumors, such as liposarcoma.
Imaging
Ultrasound
Adrenal myelolipomas appear hyperechoic on ultrasound secondary to lipid content of the tumor (Fig. 11.9).
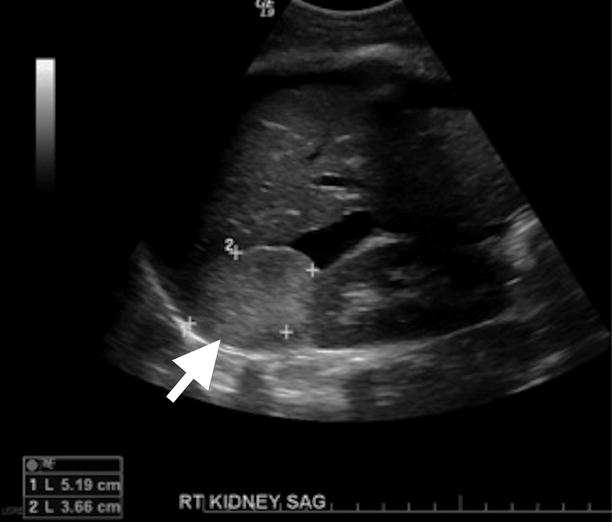
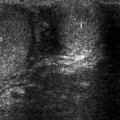
Fig. 11.9
Adrenal myelolipoma. Grayscale ultrasound demonstrates hyperechoic solid mass (arrow) originating from right adrenal gland
The prominent vascularity of the hematopoietic tissue enables the detection of blood flow by color flow Doppler ultrasound.
Computed Tomography
CT usually demonstrates a well-defined solid mass with a fatty component.
Detection of fat density on unenhanced CT is virtually diagnostic (−30 to −100 HU) (Fig. 11.10a).
Fig. 11.10
Adrenal myelolipoma. (a) Axial unenhanced CT reveals left adrenal gland lesion with soft tissue (arrow) and lipid content (arrowhead). (b) Contrast-enhanced CT demonstrates contrast enhancement in the soft tissue component of the mass
Mild internal enhancement occurs in adrenal myelolipomas after administration of intravenous contrast material on CT (Fig. 11.10b).
Coronal and sagittal images should be evaluated in addition to axial images in order to distinguish adrenal myelolipomas from renal angiomyolipomas arising from upper pole of the kidney and retroperitoneal liposarcomas.
Myelolipomas occasionally have no radiologically recognizable fat, which precludes the diagnosis.
Magnetic Resonance Imaging
T1- and T2-weighted images demonstrate hyperintense adrenal mass.
Fat-saturated images reveal loss of signal in the adrenal mass. Out-of-phase images do not reveal significant signal loss since the fat component of adrenal myelolipoma is macroscopic; therefore, frequency fat suppression is a better option than chemical shift imaging. The use of chemical shift imaging should be confined to the evaluation of fat in adenomas.
The hematopoietic tissue has a low-signal intensity on T1-weighted images and moderate signal intensity on T2-weighted images.
Fat suppression scans may also be helpful as they reveal a loss of signal intensity within the fatty component of the lesion, particularly in cases with poor lipid component.
Pathology
Myelolipoma is usually discovered incidentally; patients become symptomatic if it becomes large or is associated with a concurrent endocrine disorder. Myelolipoma is soft and well-circumscribed, with a thin fibrous capsule (Fig. 11.11). The gross appearance varies according to the relative proportions of hematopoietic elements, which appear red or red-brown, and mature fat, which appears yellow.
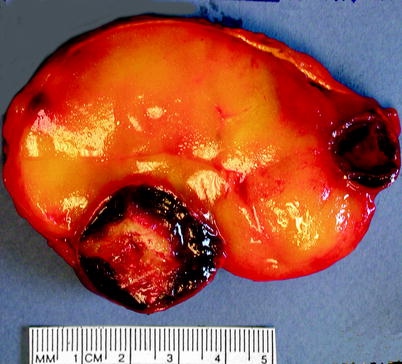
Fig. 11.11
Myelolipoma. Myelolipomas are usually smooth, well circumscribed, and yellow to red-brown, depending upon the amount of adipose or myeloid tissue present. This example was predominantly adipose tissue; areas of dark-red organizing hematoma are also present (Image courtesy of Shams Halat, MD)
Hemorrhage, fibrosis, and bone may be seen. It is composed of mature adipose tissue admixed with hematopoietic cells including megakaryocytes (Fig. 11.12).
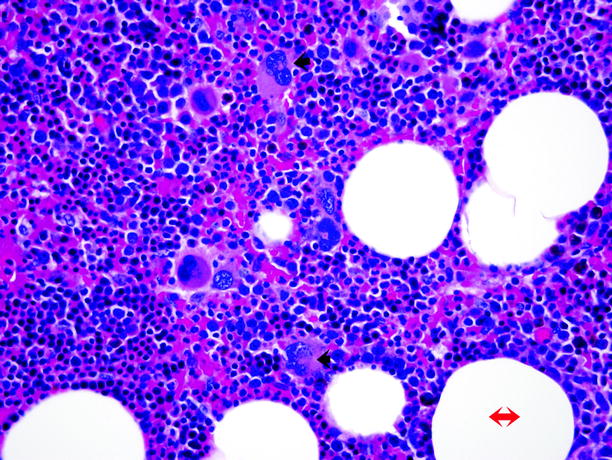
Fig. 11.12
Myelolipoma. Microscopically, myelolipoma consists of mature adipose tissue (adipocytes, red double-headed arrow) admixed with hematopoietic tissue, including myeloid and erythroid cells and megakaryocytes (trilinear hematopoiesis). The diagnosis is facilitated by identification of the multilobed nuclei of megakaryocytes (black arrows)
Neuroblastic Neoplasms
Neuroblastic neoplasms are derivatives of neuroblasts, which are one of the two types of neural crest cells that appear in the adrenal (paraganglionic cells are the other type, and these give rise to adrenal medullary hyperplasia and paragangliomas). Neoplasms derived from neuroblasts include ganglioneuroma, ganglioneuroblastoma, neuroblastoma, schwannoma, malignant peripheral nerve sheath tumor, and neurofibroma. Adrenal involvement by neuronal tumors usually manifests as a mass lesion with well-defined, smooth, or lobulated margins.
Ganglioneuroma
General Information
Ganglioneuroma is an uncommon benign tumor that can arise anywhere along the paravertebral sympathetic plexus and may occasionally arise in the adrenal.
The most common sites of involvement for ganglioneuroma are retroperitoneum and posterior mediastinum. Adrenal is involved in 20–30 % of patients with ganglioneuroma.
Most ganglioneuromas are detected incidentally as they are usually asymptomatic. Secretion of catecholamines, vasoactive intestinal polypeptide, or androgenic hormones can occur less than 30 % of patients and may cause hypertension, diarrhea, and virilization.
Retroperitoneal ganglioneuromas manifest as well-defined masses which may be oval, crescentic, or lobulated. Though a true capsule is unusual, they may appear encapsulated. Although they may surround major blood vessels, they rarely compromise the lumen.
Imaging
Ultrasound
Ultrasound reveals a mass lesion with a heterogeneous solid echotexture.
Computed Tomography
On unenhanced CT it appears as a solid adrenal mass with low, homogeneous soft tissue attenuation which may contain calcification (Fig. 11.13a).
Fig. 11.13
Ganglioneuroma. (a) Axial unenhanced CT image demonstrates a right adrenal gland mass (arrow) with tiny calcification. (b) Axial contrast-enhanced CT image at arterial phase demonstrates enhancement of the mass. (c) Axial contrast-enhanced CT at delayed phase demonstrates increased enhancement of the mass
Contrast-enhanced images reveal slight to moderate enhancement, which may be homogeneous or mildly heterogeneous (Fig. 11.13b, c).
Magnetic Resonance Imaging
On MRI, ganglioneuromas have lower signal intensity compared to liver on T1-weighted images.
A heterogeneously high-signal intensity, varying in degree depending on the ratio of myxoid stroma to cellular and fibrous components, is typical on T2-weighted images. A higher T2 signal intensity corresponds to an increased amount of myxoid stroma, whereas a lower T2 signal intensity corresponds to an increased amount of cellular and fibrous components.
A whorled appearance due to curvilinear bands of low-signal intensity on T2-weighted images has been described for ganglioneuroma.
During contrast-enhanced dynamic MRI, a gradual increase of the enhancement rather than an early enhancement is characteristic for ganglioneuroma, which may be helpful for distinguishing them from ganglioneuroblastoma and neuroblastoma.
Pathology
Ganglioneuroma is the most common tumor of sympathetic origin in adults. It is well-circumscribed with a white and whorled cut surface similar to leiomyoma. (Fig. 11.14). Large tumors may have areas of hemorrhage and cystic degeneration. It consists entirely of an admixture of schwannian cells and ganglion cells. (Fig. 11.15). Neuroblastoma elements are absent.
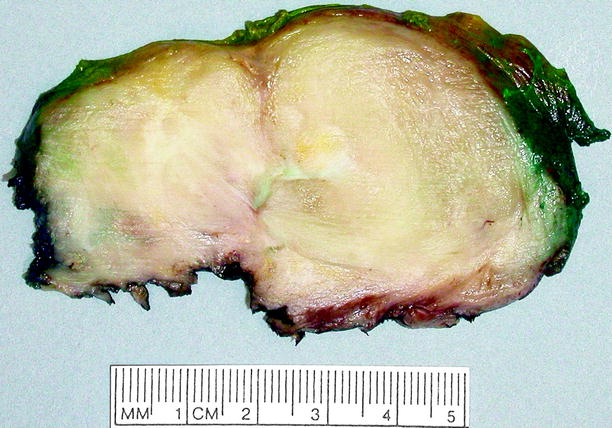
Fig. 11.14
Ganglioneuroma. This tumor can be as large as 18 cm in diameter, but the average diameter is about 8 cm. It is usually smooth, gray-white or tan-yellow, well-circumscribed but nonencapsulated, and rubbery, lacking necrosis, or hemorrhage
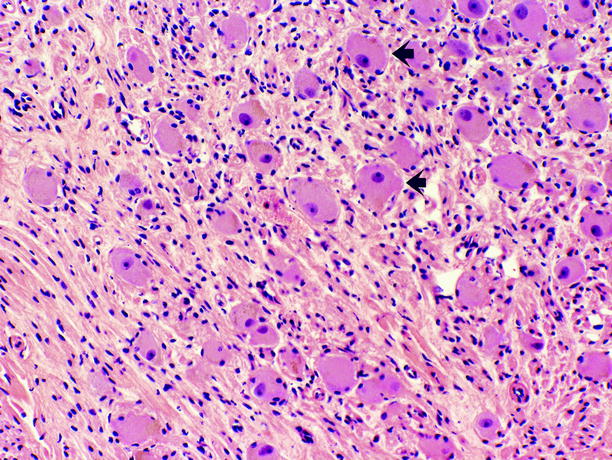
Fig. 11.15
Ganglioneuroma. Tumor is composed of Schwann cells, admixed with ganglion cells in varying proportions. Ganglion cells (arrows) possess abundant eosinophilic cytoplasm, large vesicular nuclei, and prominent nucleoli; they are scattered throughout the tumor, often as small aggregates surrounded by ill-defined fascicles of Schwann cells, which possess scant spindled cytoplasm, wavy dark nuclei, and inconspicuous nucleoli. Necrosis, mitotic figures, and cellular atypia are absent
Ganglioneuroblastoma
General Information
Adrenal medulla is the most common site of occurrence of ganglioneuroblastoma.
Ganglioneuroblastoma is usually encountered in children less than 10 years old.
In contrast to ganglioneuroma, which is composed entirely of mature ganglionic and schwannian cells, ganglioneuroblastoma has an identifiable component of neuroblastoma admixed with mature ganglionic and schwannian cells.
Like neuroblastoma, it tends to have an irregular margin or even invasion into adjacent organs.
Imaging
Ultrasound
Sonographic appearance of ganglioneuroblastoma is not distinguishable from ganglioneuroma.
Computed Tomography
Lesions may appear as predominantly cystic or solid.
Thin strands of solid tissue representing ganglion cells may exist in predominantly cystic mass.
Magnetic Resonance Imaging
MRI reveals a low to intermediate signal intensity on T1-weighted images and high-signal intensity on T2-weighted images (Fig. 11.16a).
Fig. 11.16
Ganglioneuroblastoma. (a) Axial T2-weighted image demonstrates hyperintense large retroperitoneal mass (arrows) with encasement of vessels. Retroperitoneal mass demonstrates mild enhancement in the arterial phase (b) and intense enhancement at the delayed phase (c)
Ganglioneuroblastomas demonstrate contrast enhancement increasing at delayed phase (Fig. 11.16b, c).
Pathology
Ganglioneuroblastoma presents as an ovoid or multinodular adrenal mass. It displays the histologic features of neuroblastoma, but in addition, it contains ganglion cells with eccentrically located large nuclei, prominent nucleoli and copious dark eosinophilic cytoplasm, and cells with schwannian differentiation (Figs. 11.17, 11.18, and 11.19).
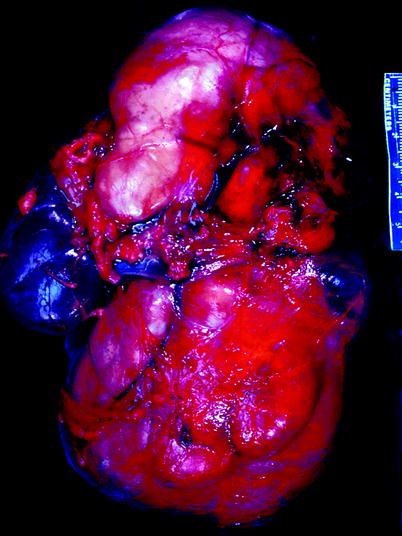
Fig. 11.17
Ganglioneuroblastoma. Tumor forms a very large multinodular mass that impinges upon and dwarfs the kidney, which is seen at the left center of the image (From MacLennan et al. (2003), with permission)
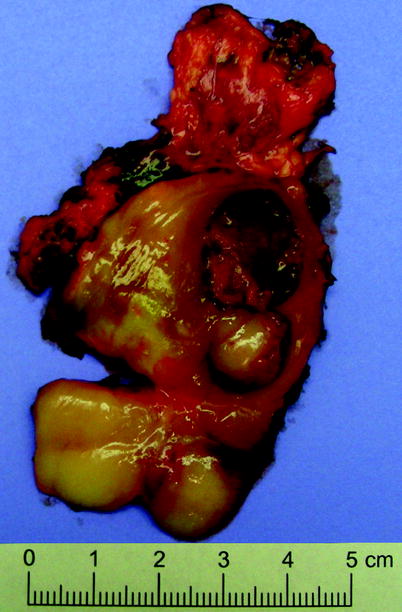
Fig. 11.18
Ganglioneuroblastoma. Cut surface is variegated, with areas of fibrosis and areas of hemorrhage and necrosis
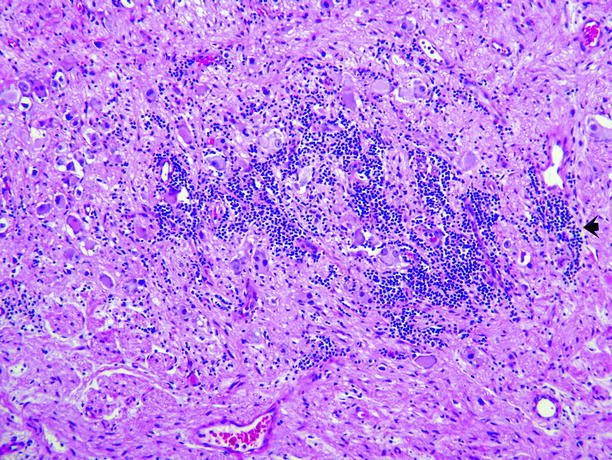
Fig. 11.19
Ganglioneuroblastoma. Ganglion cells and Schwann cells comprise the great majority of this tumor, but the tumor also has a small component of clustered small dark-blue cells of the type typically seen in neuroblastoma (arrow)
Neuroblastoma
General Information
Neuroblastoma arises from neuroblastic cells of the neural crest in the adrenal medulla or along the sympathetic chain.
Neuroblastoma and ganglioneuroblastoma collectively comprise the fourth most common malignancy in childhood. Most occur in patients less than 4 years old (median age 2 years), and they are rare in patients more than 10 years old. Males and females are equally affected. The adrenal is the commonest site of origin (38 %), followed by extra-adrenal abdominal sites (30 %), and a small number (3.4 %) originate in the pelvis. “In situ neuroblastoma” in the adrenal is common in infancy, but most of these lesions (and a small number of fully developed neuroblastomas) regress or mature spontaneously.
Neuroblastoma is rare in adults and its imaging features are nonspecific.
Imaging
Ultrasound
Ultrasound demonstrates solid calcified poorly defined suprarenal mass.
Both encasement and displacement of vessels may be visualized.
Computed Tomography
Neuroblastomas exhibit similar CT findings to those of ganglioneuroblastomas (Fig. 11.20a, b).
Fig. 11.20
Neuroblastoma. Axial (a) and coronal (b) contrast-enhanced CT images demonstrate contrast-enhanced solid mass arising from right adrenal gland
Calcifications may be visualized on CT (Fig. 11.21).
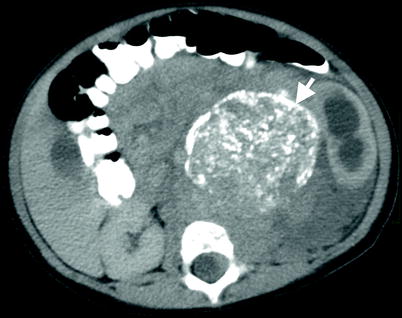
Fig. 11.21
Neuroblastoma. Axial contrast-enhanced CT reveals a solid left adrenal mass (arrow) with calcifications
Magnetic Resonance Imaging
On MRI, neuroblastoma appears as a heterogeneous lesion with mixed low-signal intensity on T1-weighted images and high-signal intensity on T2-weighted images, showing contrast enhancement. Calcification, necrosis, and hemorrhage are common findings.
Pathology
Neuroblastic tumors constitute the second most common solid neoplasm in children (behind central nervous system tumors). This group of tumors represents a continuum from neuroblastoma (most immature), ganglioneuroblastoma, to ganglioneuroma (most mature). They are derived from neural crest cells and as such arise in the adrenal medulla, paravertebral sympathetic ganglion, and sympathetic ganglion.
They most commonly occur in the intra-abdominal region, followed by the intrathoracic, cervical, and pelvic regions.
Neuroblastoma and ganglioneuroblastoma are usually solitary although they may occur as a composite of multiple nodules. They can grow up to 10 cm and have areas of hemorrhage and necrosis (Fig. 11.22).
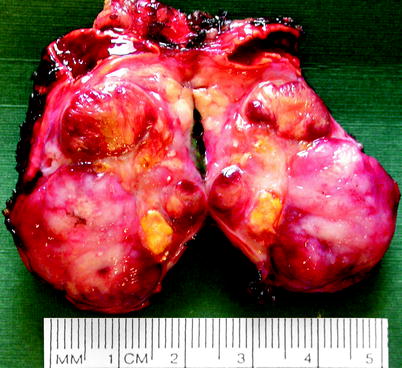
Fig. 11.22
Neuroblastoma. Neuroblastoma usually forms a solitary circumscribed ovoid or multinodular mass, sometimes exceeding 10 cm in diameter and sometimes invading local structures or large veins. It forms a soft, bulging, pink-white, plum-colored, or tan tumor with varying degrees of hemorrhage, necrosis, cystic degeneration, and dystrophic calcification
Neuroblastoma is stratified across three groups including classic or undifferentiated (composed of small round blue cells with features similar to neuroendocrine tumors, no neuropil or schwannian stroma, and 5 % or less of ganglion cells), poorly differentiated (classic pattern but with neuropil), and differentiating (abundant neuropil and 6–49 % of ganglion cells) (Figs. 11.23, 11.24, and 11.25Related posts:
 Retroperitoneal Neoplasms
 Neoplasms of the Spermatic Cord and Testicular Adnexae
 Congenital and Acquired Nonneoplastic Adrenal Diseases
 Congenital and Acquired Nonneoplastic Disorders of the Spermatic Cord and Testicular Adnexae
 Neoplasms of the Testis
 Congenital and Acquired Nonneoplastic Retroperitoneal Disorders

Stay updated, free articles. Join our Telegram channel

Full access? Get Clinical Tree


