Fig. 12.1
Abdominal aortic aneurysm (AAA). Transverse (a) and longitudinal (b) images of gray-scale ultrasound reveal AAA. (c) Color flow Doppler ultrasound demonstrates yin-yang in the lumen mimicking pseudoaneurysm. (d) Spectral flow Doppler reveals turbulent flow pattern in the AAA
The aneurysmal sac should be measured from outer wall to outer wall from a longitudinal image. The transverse diameter should be measured perpendicular to the long axis of the aorta. This is particularly important in ectatic aortas, in which a transverse measurement may give an erroneously high number, because it is actually an oblique rather than true transverse measurement.
Three-dimensional (3D) ultrasound is a useful technique for assessment of AAA, allowing measurements to be made with multiplanar reconstructions from the 3D volume data.
Color flow Doppler ultrasound may demonstrate yin-yang flow pattern in the large aneurysms that results from turbulent flow in the lumen (Fig. 12.1c, d).
Color flow Doppler (CFD) ultrasound may demonstrate an intimal flap in the presence of AAA dissection. CFD may rarely demonstrate actual leak site.
AAA rupture should be considered when free fluid is found in abdominal spaces, such as Morrison’s pouch, the splenorenal space, and subdiaphragmatic and perivesical spaces.
Computed Tomography
Contrast-enhanced CT scanning of the abdomen and pelvis with multiplanar reconstruction and CT angiography is the test of choice for evaluation of AAA.
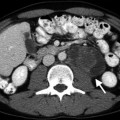
Calcification and thrombus can be visualized on CT (Fig. 12.2a–c).
Fig. 12.2
CT images of AAA. (a) Unenhanced CT demonstrates AAA with calcified wall. (b) Contrast-enhanced CT reveals nonenhancing thrombus within the aneurysm. (c) Volume-rendered image reconfirms AAA
CT is more reliable than ultrasound in detecting leaks and retroperitoneal hematomas.
Volume and extension of the hematoma resulting from rupture of the aneurysm can be determined by CT (Fig. 12.3a).
Fig. 12.3
Abdominal aortic aneurysm in an 82-year-old man. (a) Computed tomography demonstrates a large hematoma (arrow) on the left side of the ruptured aortic aneurysm extending into the retroperitoneal space. The aortic lumen was partially visualized due to the large thrombus (arrowhead). (b) Another scan in the same patient at the level of renal arteries shows that the renal arteries (arrows) are still patent. However, the left kidney is displaced upward by a hematoma in the perirenal space
Location of the renal arteries, length of the aortic neck, condition of the iliac arteries, and anatomic variants can be documented (Fig. 12.3b).
The presence of saccular aneurysm with an irregular lumen, peri-aneurysmal fluid, gas and/or hematoma, osteomyelitis in adjacent vertebral bodies, and disruption of intimal calcification are indicative of infected aneurysms (Fig. 12.4).
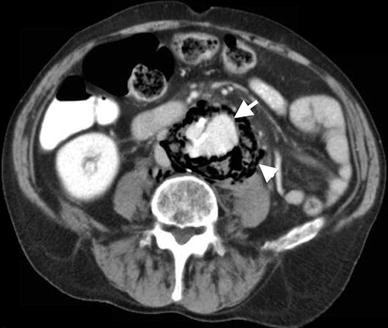
Fig. 12.4
Infected (mycotic) abdominal aortic aneurysm. Contrast-enhanced axial CT demonstrates abdominal aortic aneurysm (arrow) surrounded by air (arrowhead) representing mycotic aneurysm
Magnetic Resonance Imaging
Provides excellent anatomical definition.
3-dimensional assessment is possible.
Angiography
Angiography is the gold standard for the diagnosis of AAA.
It is indicated in the presence of associated renal or visceral involvement, peripheral occlusive disease, or aneurysmal disease.
Angiography is also essential with any renal abnormality.
Pathology
Atherosclerosis is defined by atheromatous plaques, which are raised intimal lesions that protrude into a vascular lumen (Fig. 12.5). The surface of the plaque is a white fibrous cap consisting of smooth muscle cells, macrophages, lymphocytes, collagen, elastin protein matrix, and minute new blood vessels (Fig. 12.6). Beneath the cap is a necrotic soft yellow-white central area composed of lipids (mainly cholesterol and cholesterol esters, often forming crystals), cell debris, and foamy macrophages. Calcium deposits are often present. Beneath the necrotic central core lies the media.
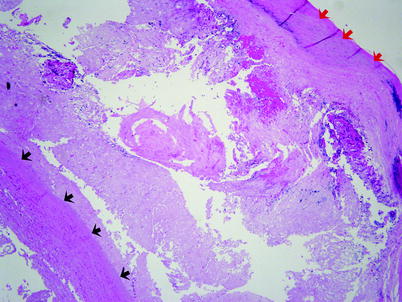
Fig. 12.5
Atherosclerosis. This is a section from the wall of an aortic aneurysm. The red arrows indicate the fibrous cap of a complicated atherosclerotic plaque. The black arrows indicate the thinned smooth muscle of the aortic media. Between the fibrous cap and the aortic media lies the necrotic center of the plaque
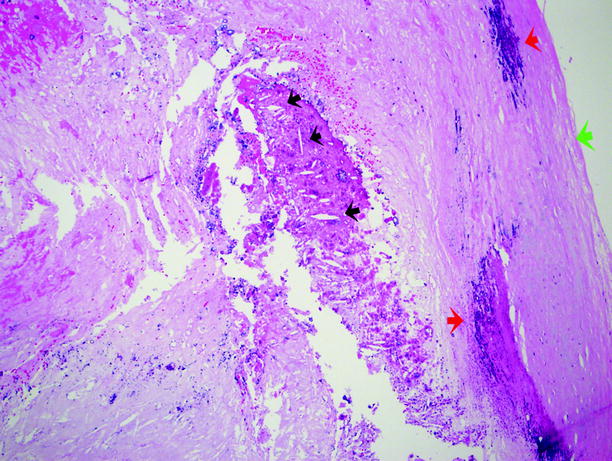
Fig. 12.6
Atherosclerosis. A closer view of the plaque shown in Fig. 12.5. The green arrow is the surface of the fibrous plaque. The plaque is composed of amorphous cellular debris and other material. The red arrows indicate areas of calcium deposition. The black arrows indicate “cholesterol clefts,” which are empty spaces left after histologic processing has removed the cholesterol and cholesterol esters that made up the cholesterol crystals
Plaques can be injurious in many ways. They may cause downstream ischemia by significantly constricting the vessel luminal diameter or by rupturing internally and causing complete vessel thrombosis. They may also result in weakening of the underlying media, which ultimately leads to aneurysm formation.
Abdominal aortic aneurysms typically show severe complicated atherosclerosis with thinning and destruction of the aortic media.
Aortic aneurysms are most often located above the aortic bifurcation and below the renal arteries (Fig. 12.7). They are fusiform or saccular in outline and range up to 25 cm in length and up to 15 cm in diameter.
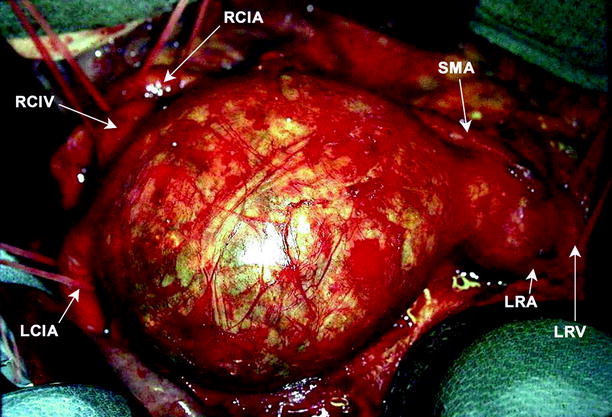
Fig. 12.7
Abdominal aortic aneurysm. Image shows an unruptured large infrarenal aortic aneurysm, immediately prior to repair. Various structures are labeled, including left renal vein and artery, superior mesenteric artery, left and right common iliac arteries, and right common iliac vein (Image courtesy of John Wang, M.D)
A mural thrombus, often laminated, typically fills the aneurysmal cavity (Fig. 12.8).
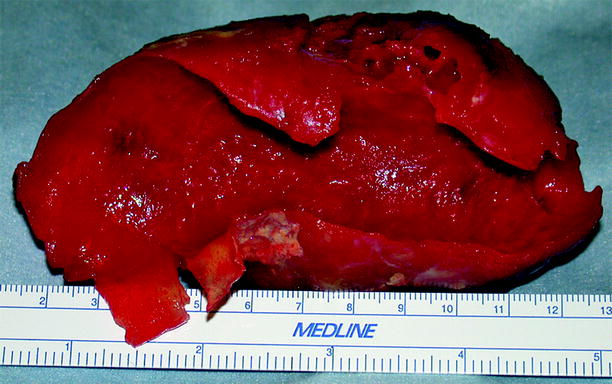
Fig. 12.8
Abdominal aortic aneurysm. Image shows a large mural thrombus removed from the dilated portion of an aortic aneurysm (Image courtesy of John Wang, M.D)
Differential Diagnosis
Retroperitoneal abscess, hematoma, or fluid collections
Retroperitoneal masses
Pearls and Pitfalls
Presence or absence of renal artery involvement in a setting of AAA is critical.
Kidneys should be evaluated at the time of scanning.
The diameter of the aneurysm should be measured at it is widest part.
CT may over or underestimate the size of an aneurysm in an axial plane.
Thrombus of the Inferior Vena Cava (IVC)
General Information
Mostly seen in patients with deep venous thrombosis (DVT).
The frequency of IVC thrombosis in patients with DVT is 4–15 %.
Tumor thrombosis due to intravascular extension of renal cancer is common. Renal cancers invade the renal vein and enter the IVC in up to 10 % of cases of renal carcinoma. Other abdominal cancers commonly associated with large vein extension, including IVC involvement, are adrenal carcinoma and hepatocellular carcinoma.
Imaging
Ultrasound
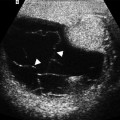
Color flow Doppler ultrasound reveals the lack of venous flow and the thrombosis itself (Fig. 12.9a, b). Tumor thrombus has blood flow within it.
Fig. 12.9
Inferior vena cava (IVC) thrombus. (a) Gray-scale ultrasound demonstrates IVC with hypoechoic intraluminal thrombus (arrow). Attachments of IVC filter appear hyperechoic (arrowhead). (b) Color flow Doppler ultrasound reveals no flow in the IVC; Abdominal aorta (AO)
Visualized dilated collaterals.
Computed Tomography
Hypodense thrombus within the lumen that demonstrates contrast enhancement suggests malignant thrombus; bland thrombus seen in nephritic syndrome commonly does not demonstrate enhancement (Fig. 12.10a, b) (see also Chap. 5 in Genitourinary Radiology: Kidney, Bladder and Urethra, Fig. 5.39).
Fig. 12.10
Thrombosis of the IVC. (a) Axial contrast-enhanced CT demonstrates thrombosed IVC (arrow). (b) Coronal-enhanced CT reveals IVC thrombosis (arrow) and IVC filter which prevents proximal extension of the thrombus
Pseudofilling defects in the IVC at early phase due to circulation should not be thought as thrombus.
Magnetic Resonance Imaging
MRI allows for examination in multiple planes and for estimation of the thrombus age.
Reconstructive imaging technology can generate images similar to those seen with venography.
Helps in determining proximal extent of thrombosis.
Venography
Is the gold standard for diagnosis of DVT and thrombus of IVC.
The caudal extent of clot may be overestimated because of preferential flow into collaterals.
Differential Diagnosis
Pseudothrombosis
Tumor invasion
Pearls and Pitfalls
Pseudothrombosis, particularly of the infrarenal IVC, is generally thought to result from the variable amounts of contrast in the cava above and below the renal veins. It may also result from collapse of the IVC at the diaphragm while patients are supine. Early or late phases of contrast enhancement may show pseudomasses and thrombosis in CT scans.
Psoas Abscess
General Information
Results usually from infection involving the lumbar vertebrae, with extension of infection into the psoas muscle, followed by abscess formation.
The infection is most commonly tuberculous or staphylococcal.
Imaging
Plain Film Radiography
Presence of a soft tissue mass, obliteration of the psoas muscle
Displacement of retroperitoneal organs
Soft tissue gas
Bony destruction of the spine and scoliosis
Ultrasound
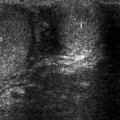
A hypoechogenic cystic mass lesion with posterior acoustic enhancement and heterogeneous inner pattern (Fig. 12.11a).
Fig. 12.11
Psoas muscle abscess in a 42-year-old woman. (a) Color flow Doppler ultrasound examination demonstrates a cystic mass in the retroperitoneum. There is no blood flow within the lesion. (b) Axial breath hold T1-weighted image reveals hypointense abscess (arrow). (c) Same lesion as in (b) is hyperintense on T2-weighted image and confirms the diagnosis of psoas abscess. Axial (d) and coronal (e) breath hold post-contrast T1-weighted image reveals enhancement of abscess wall (arrow)
Amorphous debris with echogenic reflections floating in the abscess may be observed.
Computed Tomography
CT scan can reveal the extent of the mass. The relationship of the abscess with the adjacent structures and organs is clearly assessed.
Only the capsule of the abscess enhances in post-contrast images.
Fat tissue surrounding the abscess is usually heterogeneous.
CT can be helpful in distinguishing abscess from other entities included in the differential diagnosis, such as a malignant tumor.
Magnetic Resonance Imaging
MRI is useful in complicated cases. Edema associated with the abscess and its extent is evaluated better with post-contrast MR images. Abscess itself is hypointense in T1-weighted and hyperintense in T2-weighted images (Fig. 12.11b, c).
The wall of the abscess enhances after intravenous gadolinium administration (Fig. 12.11d, e).
Nuclear Medicine
67Ga scan may facilitate the early diagnosis of insidious infection and assist CT-guided percutaneous drainage of the abscess.
67Ga scanning is superior to CT in demonstrating concomitant infectious foci at other sites.
Bone scanning is a sensitive tool for detecting osteomyelitis, which commonly accompanies psoas abscess.
Differential Diagnosis
Endometriosis
Hematoma
Malignant neoplasm
Pearls and Pitfalls
Uncomplicated abscess has clear margins and the wall thickness of the abscess is homogenous all around the lesion. Chronic phase abscesses may have septations and calcifications.
Retroperitoneal Fibrosis
General Information
Retroperitoneal fibrosis is characterized by the presence of a fibro-inflammatory tissue, which usually surrounds the abdominal aorta and the iliac arteries and extends into the retroperitoneum to envelop neighboring structures—e.g., ureters.
Retroperitoneal fibrosis is a relatively uncommon disease. The estimated annual incidence varies from 1/200,000 to 500,000 population.
Idiopathic retroperitoneal fibrosis has a good prognosis, with little effect on long-term morbidity or mortality. It occurs twice as frequently in males than in females. The peak incidence is in patients aged 40–60 years. The underlying causes of idiopathic retroperitoneal fibrosis are not fully understood currently and are probably multifactorial; postulated underlying causes include autoimmune disorders and viral infections.
Secondary retroperitoneal fibrosis has been attributed to a variety of etiologic agents, as follows: aortic aneurysm, retroperitoneal bleeding, prior retroperitoneal radiation therapy exposure, sarcoidosis, endometriosis, inflammatory bowel disease, and exposure to a number of medications, including methysergide, pergolide, bromocriptine, ergotamine, methyldopa, hydralazine, analgesics, and β-blockers.
The results of routine laboratory tests are consistent with inflammatory disease: high serum levels of acute-phase reactants, such as ESR and CRP, are noted in 80–100 % of patients.
Imaging
Plain Film Radiography
Plain abdominal radiography may show obliteration of the psoas shadow and an enlarged renal outline due to hydronephrosis. Features of ankylosing spondylitis or metastasis may also be visible.
Bowel dilatation due to obstruction and splenomegaly secondary to portal hypertension may be visualized.
Chest radiography may demonstrate pulmonary edema or fibrosis. Mediastinal widening may result from a soft tissue mass associated with mediastinal fibrosis.
Intravenous Pyelography
The classic triad includes delayed excretion of contrast material with unilateral (20 %) or bilateral (70 %) hydronephrosis, medial deviation of the middle third of the ureters, and tapering of the ureter at the level of the L4/L5 vertebrae (Fig. 12.12). This triad is seen in 18–20 % of affected patients.
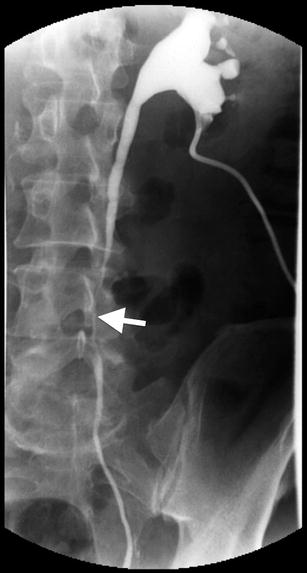
Fig. 12.12
Retroperitoneal fibrosis. Antegrade pyelography demonstrates irregular narrowing of left ureter (arrow) at the level of L4–L5 vertebrae
Retrograde Pyelography
Retrograde pyelography may show findings similar to those noted above. Additionally, it demonstrates the poor distensibility of the ureters.
Very little resistance is encountered during ureteric catheterization despite the extensive fibrosis.
Lymphangiography
Lymphangiography is performed to demonstrate lymphatic compression resulting from retroperitoneal fibrosis.
Lymphangiography may show obstruction of lymphatic flow particularly at the L3/L4 level, opacification of collateral channels, and delay in passage of contrast through the iliac and para-aortic lymphatics.
Ultrasound
In a sonographic examination, retroperitoneal fibrosis appears as a retroperitoneal, well-defined, homogeneous, and hypoechoic mass. Color flow Doppler ultrasound reveals encasement of neighboring vessels by fibrotic tissue (Fig. 12.13a).
Fig. 12.13
Retroperitoneal fibrosis (RPF) in a 37-year-old man. (a) Color flow Doppler ultrasound examination reveals a hypoechoic soft tissue mass (arrows) surrounding the distal abdominal aorta at the level of iliac bifurcation. Arterial flow is normal. (b) Corresponding CT scan demonstrates the soft tissue mass (black arrows) around the aorta. Dilatation of left ureter secondary to the compression effect of the fibrosis is also observed (white arrow). (c) CT image of another patient reveals RPF (arrows) surrounding the iliac arteries at the level of the aortic bifurcation
Hydronephrosis and hydroureter of varying degrees may be seen.
There are no characteristic ultrasound features of retroperitoneal fibrosis that can differentiate it from malignancy.
Computed Tomography
On unenhanced CT scans, retroperitoneal fibrosis appears as a mass that is isodense with muscle and that envelops the main vascular structures between the renal hila and sacral promontory (Fig. 12.13b, c).
The fat plane between the mass and the psoas muscle is usually obliterated.
Retroperitoneal fibrosis does not cause bone destruction.
Retroperitoneal fibrosis usually causes medial deviation of both ureters (Fig. 12.14a–c).
Fig. 12.14
Retroperitoneal fibrosis. (a) Axial contrast-enhanced CT demonstrates dense fibrotic tissue (arrow) involving anterior and lateral parts of the aorta and encircling both ureters (arrowheads). (b) Coronal MIP and volume-rendered (c) images demonstrate bilateral medially deviated ureters and double-J catheters within them
CT scan features that suggest malignancy include lateral displacement of the ureters, anterior displacement of the aorta, local bone destruction, and a large bulky lesion.
Elevation of the aorta from the spine is uncommon in retroperitoneal fibrosis and may be a sign of malignancy.
After contrast injection, the retroperitoneal plaque may show a variable degree of enhancement, depending on the stage of the disease. Enhancement is usually significant in the early active vascular stage.
Imaging features helpful in distinguishing retroperitoneal fibrosis from malignancy are summarized in Table 12.1.
Table 12.1
Imaging features helpful in distinguishing retroperitoneal fibrosis from malignancy
Retroperitoneal fibrosis
Malignancy
Usually no bulky enlargement
Often bulky
Retractile effect tethers aorta and IVC towards spine
Displaces the aorta and IVC anteriorly and ureter laterally from the spine
Predominantly occurs distal to the renal hilum
Random localization with respect to renal hilum
Plaque-like density with peripheral infiltration
Peripheral nodularity and lobulation
Magnetic Resonance Imaging
Retroperitoneal fibrosis presents with low-to-intermediate signal intensity on T1-weighted images. Depending on the age of the fibrosis, the density of T2-weighted images may vary. During the early stage, signal density is high because of high fluid content and hypercellularity.
Inhomogeneity of signal intensity on T2-weighted images may suggest malignancy; however, the specificity is not high enough to make a differentiation. Biopsy is usually required.
Gadolinium enhancement ratios by comparing retroperitoneal fibrosis enhancement with that of psoas muscle in delayed phases has been shown to be helpful in diagnosis. Dynamic studies may be useful in the assessment of disease activity.
Nuclear Medicine
In the acute phase, retroperitoneal fibrosis may take up gallium-67, possibly due to the presence of inflammation.
18F-FDG identifies areas of high-glucose metabolic activity where the inflammatory cells have an increased glucose uptake.
Pathology
Retroperitoneal fibrosis forms pale gray irregular plaques which encase the ureters and blood vessels.Related posts:

Stay updated, free articles. Join our Telegram channel

Full access? Get Clinical Tree