Head and neck cancer remains pervasive and associated with significant morbidity. Clinical examination, biopsy, and conventional imaging may not result in an adequate understanding of disease extent. Advanced imaging techniques including dual energy and perfusion CT, diffusion weighted and perfusion MR imaging, and other techniques may yield additional information related to tumor detection, staging, differentiation, and prognostication. When combined with conventional imaging and when tailored for disease location and type, advanced imaging may significantly increase imaging accuracy.
Key points
-
•
Head and neck cancer may cause significant morphologic changes that may limit sensitivity and specificity of conventional computed tomography (CT) and magnetic resonance imaging (MRI).
-
•
Advanced CT and MRI techniques use additional hardware, more complex imaging protocols, and sophisticated data analysis to yield additional disease parameters.
-
•
Advanced CT and MR imaging techniques, when combined with conventional imaging and when tailored for disease location and type, may significantly increase imaging accuracy.
Abbreviations
| ADC | apparent diffusion coefficient |
| AEF D | arterial enhancement fraction |
| APT | amide protein transfer |
| CE-T1 | contrast-enhanced T1 |
| CT | computed tomography |
| DCE | dynamic contrast enhanced |
| DDC | distributed diffusion coefficient |
| DECT | dual-energy computed tomography |
| DOI | depth of invasion |
| DWI | diffusion-weighted imaging |
| DWIBS | diffusion-weighted imaging with background body signal suppression |
| ECV D | extracellular volume fraction |
| ED | electron density |
| EP | enhancement peak |
| FS-T2 | fat-suppressed-T2 |
| HPV | human papillomavirus |
| HT | Hashimoto’s thyroiditis |
| IAUGG | initial area under the contrast time intensity curve |
| IC | iodine concentration |
| IMT | inflammatory myofibroblastic tumor |
| IP-SCC | inverted papilloma-associated squamous cell carcinoma |
| LN | lymph node |
| MCER | maximum contrast enhancement ration |
| mER | mean enhancement ratio |
| mWI | mean wash-in |
| MS | maximum slice |
| MST | malignant salivary tumors |
| NHL | non-Hodgkin’s lymphoma |
| nIC | normalized iodine concentration |
| NPC | nasopharyngeal cancer |
| nZ eff | normalized effective atomic number |
| ONB | olfactory neuroblastoma |
| OP SCC | oropharyngeal SCC |
| PA | pleomorphic adenomas |
| pCT | perfusion computed tomography |
| PTC | papillary thyroid cancer |
| SAC | spectral attenuation curve |
| SBO | skull base osteomyelitis |
| SCC | squamous cell carcinoma |
| SIP | sinonasal inverted papilloma |
| SRCC | Spearman’s rank correlation coefficient |
| SSS | small solid sample |
| TTP | times to peak |
| VMI | virtual monochromatic image |
| WI | wash-in |
| WO | wash-out |
| WR | washout ratios |
| WT | Warthin’s tumors |
| λ HU | slope of the energy spectrum curve |
| 3D | 3-dimensional |
Introduction
Head and neck cancer remains pervasive and continues to be associated with significant morbidity and mortality. The diagnosis of head and neck cancer typically begins with history, physical examination, and biopsy. However, biopsy may yield false negative results and clinical examination may not reveal the full extent of disease. Conventional computed tomography (CT) and MR imaging often improve disease staging. However, advanced CT and MR imaging techniques offer the potential to give additional clinically useful information related to neoplasm detection, differentiation among tumor types, staging, and prognosis. This article seeks to describe and elaborate on the recent developments in advanced imaging of head and neck tumors.
For CT, the review focuses on dual-energy CT (DECT) and perfusion techniques. For MR imaging, this includes diffusion-weighted imaging (DWI), perfusion imaging, and several other less common techniques. Dynamic susceptibility contrast perfusion MR imaging was not discussed due to susceptibility-related signal loss in head and neck tissues from adjacent bone and air spaces.
Computed tomography
For many head and neck tumors, CT’s speed, availability, and ability to differentiate between deep soft tissue and fat make it the initial imaging modality of choice. However, its limited ability to differentiate between soft tissues of similar density has led to the application of advanced CT techniques.
Dual-Energy Computed Tomography
DECT uses the information derived from 2 X-ray spectra to characterize tissues based on different X-ray attenuations at different energy levels. One way to combine data from high and low energy spectra is to generate virtual monochromatic images (VMI) of predetermined energy levels (varying from high or low). Another way to combine high and low energy spectra is to generate material decomposition maps resulting in images with enhancement or suppression of different materials (eg, virtual noncontrast images or iodine concentration [IC] maps, among others). Finally, comparing attenuations allows calculation of electron density (ED) maps and effective atomic number.
Dual-energy computed tomography: detection
Researchers have applied DECT to the detection of malignancy in the head and neck ( Table 1 for DECT parameter values). Tunlayadechanont and colleagues used DECT to differentiate inverted papilloma from squamous cell carcinoma (SCC) and lymphoma of the sinonasal cavity. The authors found significantly higher IC spectral attenuation curve (SAC) slope in SCC and lymphoma than in inverted papilloma.
Table 1
Dual-energy computed tomography parameter results
| Author | Topic | Parameter | Parameter | Parameter | Parameter |
|---|---|---|---|---|---|
| Tunlayadechanont et al, 2022 | IP from SCC and lymphoma |
IC (mg/mL)
Cut-off: 1.74 (AUROC: 0.903) |
SAC (HU/KeV)
Cut-off: 3.34 (AUROC: 0.901) |
||
| Luo et al, 2023 | Oral SCC to LN |
IC (mg/mL):
0.98 ± 0.42 |
nIC:
0.31 ± 0.11 |
ED (HU):
36.86 ± 8.32 |
λ
HU:
1.30 ± 0.37 |
| Tu et al, 2024 | Laryngeal SCC to LN |
nIC (arterial):
0.30 (0.24–0.40) |
Z
eff
(arterial)
0.78 (0.75–0.76) |
||
| Sun et al, 2022 | Esophageal SCC to LN |
IC (mg/mL, late):
Cut-off: 2.40 (AUC: 0.827) |
nIC (late):
Cut-off: 0.612 (AUC: 0.822) |
Fat fraction (late):
Cut-off: 25.3 (AUC: 0.843) |
|
| Zhou et al, 2022; Zhou et al, 2024 | Papillary thyroid carcinoma to LN |
ECV
D
:
Cut-off: 36.45 (AUC: 0.813) |
AEF
D
:
Cut-off: 0.66 (AUC: 0.867) |
||
| Chen et al, 2024 | Lymphomatous LN |
nIC
0.34 ± 0.14 (AUC: 0.822) |
nZ
eff
0.88 ± 0.04 (AUC: 0.845) |
ECV
20.59 ± 12.41 (AUROC: 0.811) |
|
| H Zhang et al, 2022 | Glottic SCC recurrence-free survival |
nIC (arterial):
Hazard ratio: 4.316 |
nIC (venous):
Hazard ratio: 4.678 |
||
| Yang et al, 2022 | Oral tongue SCC aggression prediction |
nIC (venous):
Odds ratio: 0.39 (CI: 0.24–0.63) |
λ
HU
(venous):
Odds ratio: 0.29 (CI: 0.16, 0.52) |
Abbreviations: AEF D , arterial enhancement fraction; ECV, extracellular volume fraction; ED, electron density; IC, iodine concentration; IP Inverted papilloma; LN, lymph node; nIC, normalized iodine concentration; nZ eff , normalized effective atomic number; SAC, spectral attenuation curve; SCC, squamous cell carcinoma; λ HU , slope of the energy spectrum curve.
Dual-energy computed tomography: staging and grading
DECT has been applied to the diagnosis of SCC metastatic to cervical lymph nodes (LNs), as nodal metastasis directly affect treatment options. Luo and colleagues found that oral SCC metastatic to LNs demonstrated significantly decreased ED, IC, normalized iodine concentration (nIC), slope of the energy spectrum curve ( λ HU ), and dual-energy index compared with nonmetastatic nodes. Tu and colleagues evaluated laryngeal SCC metastatic to nodes and found that arterial phase nIC and normalized effective atomic number (nZ eff ) independently predicted the presence of metastasis. Sun and colleagues examined esophageal cancer metastatic to nodes and found that IC and fat fraction were significantly lower in metastatic LNs.
DECT has also been applied to the diagnosis of LN metastases from other tumor types. Zhou and colleagues applied DECT to the diagnosis of metastatic papillary thyroid cancer (PTC) cervical LN metastasis. Specifically, the authors found that metastatic LNs had significantly higher extracellular volume fraction (ECV D ) and arterial enhancement fraction (AEF D ) than nonmetastatic LNs. , On a related matter, Geng and colleagues investigated whether Hashimoto’s thyroiditis (HT) had any confounding effect on DECT differentiation of metastatic and nonmetastatic PTC LNs. They found that HT resulted in lower values of IC, nIC, and Z eff in diseased LNs and higher values of parameters in nondiseased LNs compared with LNs not affected by HT. Chen and colleagues evaluated lymphoma LNs and found that nIC, nZ eff , normalized ED, and extracellular volume were all significantly elevated in patients with 18 FDG-PET hypermetabolic lymphoma.
An additional study evaluated whether DECT-derived 40 keV VMI provided improved soft tissue contrast compared with 70 keV VMI images (considered to be equivalent to conventional 120 keV single energy CT) in patients with oral, pharyngeal, and laryngeal SCC metastatic to LNs. The authors found significantly higher subjective and objective (Hounsfield units) contrast resolution for solid and necrotic components compared with adjacent sternocleidomastoid muscle.
Dual-energy computed tomography: prognostication
Researchers have investigated the preoperative prediction of SCC aggressiveness. Zhang and colleagues evaluated whether DECT could predict recurrence-free survival in early-stage glottic cancer after larynx-preserving surgery. Although nIC values not otherwise specified were not statistically different between recurrence and nonrecurrence groups, the authors found that nIC limited to arterial and venous phases were significant predictors. Yang and colleagues evaluated whether preoperative DECT parameters were predictive of oral tongue SCC aggressiveness and found that venous phase λ HU and nIC were significantly lower in stage III–IV lesions than in stage I–II lesions.
Perfusion Computed Tomography
Perfusion computed tomography (pCT) may be less commonly used for the evaluation of head and neck tumors than perfusion MR imaging, but both employ similar theories. The simplest technique, qualitative analysis, relies on visual interpretation of the shape of the tissue enhancement curve. Initial slope, peak height, and subsequent slope are typically considered. To achieve greater specificity, components of the tissue concentration curve can be quantified (semiquantitative technique) resulting in parameters such as wash-in rate, time to peak, and wash-out rate.
Perfusion computed tomography: prognostication
Researchers have applied pCT to patients with advanced head and neck cancers who undergo resections with free flap reconstruction. Current techniques to monitor free flap perfusion such as Doppler ultrasound and skin paddle monitors assess superficial but not deep tissue vasculature as pCT could. Ota and colleagues found significantly higher blood flow (17.3 mL/100 mL/min cutoff, AUC 0.96) and blood volume (5.62 mL/100 cutoff, 0.96 AUC) and significantly lower mean transit time (16.1 s cutoff, AUC 0.96) in flaps that remained viable at discharge compared with flaps that later failed (the authors also found significantly higher K trans , V p , and peak enhancement and shorter time to maximum enhancement with DCE perfusion MR imaging).
MR imaging
MR imaging offers improved head and neck soft tissue differentiation compared with CT. While T2-weighted images and precontrast and postcontrast T1-weighted images, with and without fat saturation, form the mainstay of tissue analysis, MR imaging offers the potential for additional tissue characterization metrics through DWI and perfusion imaging, among other techniques ( Figs. 1–3 ).
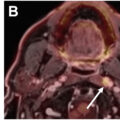
A 71-year-old male with a recurrent mass in the left palate after prior treatment of oral cavity SCC. Axial T2-weighted image at the level of the oral cavity ( A ) demonstrates asymmetric T2 hypointense mass like abnormality in the left buccal space involving adjacent gingival surface of maxilla. Axial postcontrast T1-weighted image at the same level ( B ) confirms the presence of abnormal enhancement. While the conventional imaging features are suspicious for a malignancy, axial diffusion-weighted trace image ( C ) demonstrates restricted diffusion within the lesion ( arrow ) that is further confirmatory of the hypercellularity of the lesion. This image also shows an asymmetrically enlarged right retropharyngeal LN ( dotted arrow ) that is easier to appreciate on the diffusion image but can be seen on the conventional images in retrospect. Biopsy of both sites revealed recurrent malignancy.
A 65-year-old male with biopsy proven recurrent left tongue SCC. Axial postcontrast T1-weighted image ( A ) demonstrates an ill-defined enhancing mass involving the left posterior tongue ( arrow ). Corresponding axial diffusion-weighted trace image ( B ) and apparent diffusion coefficient (ADC) map ( C ) show restricted diffusion with low ADC suggestive of hypercellularity that is typically seen with malignant lesions. Dynamic contrast enhanced MR perfusion derived K-trans ( D ), Vp ( E ), and Ve ( F , G ) maps demonstrate significantly elevated perfusion parameters within the lesion compared with the normal contralateral tongue. In B–G , arrows point to same region as in A.
A 58-year-old male with a history of treated right nasopharyngeal adenoid cystic carcinoma. Fat suppressed axial T2-weighted ( A ) and postcontrast T1-weighted ( B ) images demonstrate asymmetric T2 hyperintense enhancing lesion in the left nasopharyngeal wall ( arrows ). Dynamic contrast enhanced MR perfusion derived K-trans ( C ), Vp ( D ), and Ve ( E ) maps demonstrate moderate elevation of K-trans and Vp and significant elevation of Ve compared with the contralateral side. Biopsy of this site revealed recurrent left adenoid cystic carcinoma. In C–E , arrows point to same region as in A and B .
Related posts:
Stay updated, free articles. Join our Telegram channel

Full access? Get Clinical Tree


