This article describes the potentials and challenges of quantitative analyses of human neonatal brain images using structural magnetic resonance (MR) imaging and diffusion tensor imaging. To maximize the potential of MR imaging for neonatal brain studies, the combination of both contrasts is highly beneficial. Based on the multicontrast data, a neonate brain atlas was created, which allows automated segmentation of neonate brain MR images. The accuracy, advantages, and potential pitfalls of this atlas-based segmentation approach are discussed. The accurate and reproducible MR imaging quantification achieved by this approach could be an initial step toward the successful clinical evaluation of the neonatal brain.
Recent advances in MR imaging techniques enable scanning of the neonatal brain with various techniques. These include structural MR imaging (T1- and T2-weighted images), diffusion tensor imaging (DTI), perfusion MR imaging, functional MR imaging, MR angiography, and MR spectroscopy. However, because of the small size of the neonate brain, limited scan time, and image contrasts that are very different from adult brains, there are unique issues that must be addressed to develop an effective quantitative neonate MR imaging technique. This article focuses on a state-of-the-art quantification method for structural MR imaging and DTI of neonates, which helps to deepen the understanding of human brain development, and the potential for the clinical application of quantitative MR imaging techniques.
Importance of neonatal brain MR imaging analysis
The brain suffers various insults during the prenatal and perinatal period, such as hypoxia–ischemia, infection, and exposure to toxic substances. There are also genetic abnormalities that affect brain development. Preterm birth and low birth weight are also risk factors for brain damage. Severely damaged babies show abnormal symptoms immediately after birth. Mild to moderate damage has been linked to abnormalities later in life. For example, approximately 50% of babies born at very preterm, defined as less than or equal to 32 gestational weeks, are at risk for developing cerebral palsy, epilepsy, impaired academic achievement, and behavioral disorders, including attention-deficit/hyperactivity disorder. However, most neuropsychologic impairments are not obvious during the first year of life. Therefore, a symptom-based diagnosis is extremely difficult for neonates with mild to moderate brain damage. For successful early interventions, an effective evaluation method is needed to detect and characterize brain damage as early as possible. Evaluation of neonatal brain damage using MR imaging has several advantages. First, MR imaging is sensitive for the detection of subtle brain abnormalities compared with other imaging modalities, such as CT and ultrasound. Previous studies using conventional T1- and T2-weighted images indicate that an expert radiologist can detect some abnormality in 70% of MR scans from very preterm infants. Second, the scanning of nonsedated neonates is better for the neonate, and progressively becomes more difficult until the fourth year of life, because of the greater motion and shorter sleep time. Neonates can be scanned during hospitalization, which is another advantage. In addition, MR imaging is now widely available and, once the protocol and image-processing stream are accomplished, they can be performed and implemented on routine clinical scanners.
Features of the neonatal brain MR imaging
Anatomy of the Neonatal Brain
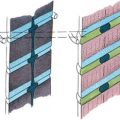
The most striking difference between the neonatal brain and the adult brain is size. The neonatal brain volume is approximately one-third to one-fourth that of the adult brain. Inside the brain, the immature architecture is constantly developing. The cerebral cortex develops sequentially. The most prominent neuronal form in the neonatal brain is the pyramidal cell. Pyramidal cells are guided from the deep part of the brain (subventricular zone) to the cortical area (the subplate, a transient developmental layer of the cortex) during 12 to 20 weeks gestation. After they arrive at the subplate, pyramidal neurons begin to make synapses and elaborate a dendritic tree. The axons and dendrites, along with fine glial processes, make up the neuropil. At term, pyramidal cells dominate the cortex, but the neuropil development is still insufficient. Pyramidal cells have a prominent apical dendrite extending from the top of the cell body to layer I; these large dendrites give a strong radial orientation to the cortex.
Myelination of the human brain begins at approximately 29 weeks of gestation in the telencephalon. The myelin sheath is formed by oligodendrocytes. The oligodendrocyte and its product, myelin, are synergistic with the developing axon (ie, the axonal cytoskeleton does not form properly in the absence of myelin), whereas the amount of myelin formed by the oligodendrocyte is controlled by the rate of expansion of the growing axonal cylinder. Myelination proceeds in a temporally and spatially inhomogeneous manner. Specifically, tracts in the brain myelinate at different rates and times. At term, the axonal network is still developing and the myelination is insufficient in most of the white matter structures, except for some tracts in the brainstem.
Structural MR Imaging of the Neonatal Brain
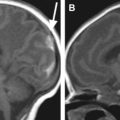
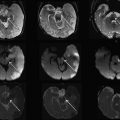
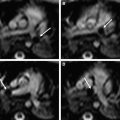
The neonatal brain is immature. On T1-weighted images, the intensity of the white matter is lower than that of the gray matter. On T2-weighted images, the intensity of the white matter is higher than that of the gray matter. These contrasts are the reverse of those seen in adults ( Fig. 1 ). This is caused by incomplete myelination in the white matter of the neonatal brain. Because of the variability of myelination status in different fibers, the contrast between the gray and white matter in some areas is very poor. For example, the anterior limb of the internal capsule is one of the most myelinated areas at term. Consequently, the signal intensity of this structure on T2-weighted images is lower than the other white matter areas and very close to that of the surrounding gray matter structures. Although identification of this area is easy on T2-weighted images in the adult, it is extremely difficult in the neonatal brain ( Fig. 2 ). To quantify the absolute T1 and T2 relaxation time of each brain structure, a quantitative T1 map and T2 maps can be created, in which T1 and T2 relaxation time are measured at each pixel. For example, the T2 map, which is often used to evaluate the myelination status of the brain, can be calculated from dual or multiple echo fast spin echo sequences by fitting the images with different echo times to an exponential model.
From MR imaging studies of normal postnatal brain development, several important time-dependent MR imaging signal changes, such as a shortening of T1 and T2 relaxation times of the gray and white matter, have been described previously. Most of the time-dependent changes are attributed to an increase in lipid concentration caused by the myelination process. Because the white matter appears as hyperintense on newborn T2-weighted images, the rapid shortening of T2 in the white matter results in “contrast inversion” between the white and gray matter during postnatal development ( Fig. 3 ).
Features of the neonatal brain MR imaging
Anatomy of the Neonatal Brain
The most striking difference between the neonatal brain and the adult brain is size. The neonatal brain volume is approximately one-third to one-fourth that of the adult brain. Inside the brain, the immature architecture is constantly developing. The cerebral cortex develops sequentially. The most prominent neuronal form in the neonatal brain is the pyramidal cell. Pyramidal cells are guided from the deep part of the brain (subventricular zone) to the cortical area (the subplate, a transient developmental layer of the cortex) during 12 to 20 weeks gestation. After they arrive at the subplate, pyramidal neurons begin to make synapses and elaborate a dendritic tree. The axons and dendrites, along with fine glial processes, make up the neuropil. At term, pyramidal cells dominate the cortex, but the neuropil development is still insufficient. Pyramidal cells have a prominent apical dendrite extending from the top of the cell body to layer I; these large dendrites give a strong radial orientation to the cortex.
Myelination of the human brain begins at approximately 29 weeks of gestation in the telencephalon. The myelin sheath is formed by oligodendrocytes. The oligodendrocyte and its product, myelin, are synergistic with the developing axon (ie, the axonal cytoskeleton does not form properly in the absence of myelin), whereas the amount of myelin formed by the oligodendrocyte is controlled by the rate of expansion of the growing axonal cylinder. Myelination proceeds in a temporally and spatially inhomogeneous manner. Specifically, tracts in the brain myelinate at different rates and times. At term, the axonal network is still developing and the myelination is insufficient in most of the white matter structures, except for some tracts in the brainstem.
Structural MR Imaging of the Neonatal Brain
The neonatal brain is immature. On T1-weighted images, the intensity of the white matter is lower than that of the gray matter. On T2-weighted images, the intensity of the white matter is higher than that of the gray matter. These contrasts are the reverse of those seen in adults ( Fig. 1 ). This is caused by incomplete myelination in the white matter of the neonatal brain. Because of the variability of myelination status in different fibers, the contrast between the gray and white matter in some areas is very poor. For example, the anterior limb of the internal capsule is one of the most myelinated areas at term. Consequently, the signal intensity of this structure on T2-weighted images is lower than the other white matter areas and very close to that of the surrounding gray matter structures. Although identification of this area is easy on T2-weighted images in the adult, it is extremely difficult in the neonatal brain ( Fig. 2 ). To quantify the absolute T1 and T2 relaxation time of each brain structure, a quantitative T1 map and T2 maps can be created, in which T1 and T2 relaxation time are measured at each pixel. For example, the T2 map, which is often used to evaluate the myelination status of the brain, can be calculated from dual or multiple echo fast spin echo sequences by fitting the images with different echo times to an exponential model.
From MR imaging studies of normal postnatal brain development, several important time-dependent MR imaging signal changes, such as a shortening of T1 and T2 relaxation times of the gray and white matter, have been described previously. Most of the time-dependent changes are attributed to an increase in lipid concentration caused by the myelination process. Because the white matter appears as hyperintense on newborn T2-weighted images, the rapid shortening of T2 in the white matter results in “contrast inversion” between the white and gray matter during postnatal development ( Fig. 3 ).
DTI of the neonatal brain
DTI is a technique that can provide unique image contrasts inside the brain. MR imaging can measure the extent of water diffusion (ie, the random motion of water) along an arbitrary axis. From this measurement, it is often found that water tends to diffuse along a preferential axis, which has been shown to coincide with the orientation of ordered structures, such as fiber tracts. Based on the diffusion orientation of water molecules, this technique can provide several types of new imaging contrasts, such as anisotropy maps and orientation maps, or a combination of the two, which is called a “color-coded orientation map” or simply a “color map” ( Fig. 4 ). One of the most widely used metrics of diffusion anisotropy is fractional anisotropy (FA), in which anisotropy is scaled from 0 (isotropic) to 1 (anisotropic). In the color map, the brightness shows the extent of the anisotropy and the color represents fiber orientation (see Fig. 4 ).
DTI can reveal the detailed white matter anatomy of premyelinated brains. In Fig. 2 , white matter tracts (indicated by white labels) can be clearly identified on the color map, but not on the T2-weighted images of the neonatal brain at 40 postconception weeks. This suggests that the diffusion measurement is sensitive to axonal geometry rather than myelination. It is thus likely that the anisotropy measurements allow the monitoring of axonal injuries. During the postnatal period, the anisotropy of the white matter further increases (see Fig. 3 ). This is likely caused by myelination of the axons, although it could also be caused by an increase in axonal density or axon caliber. The diffusion anisotropy of the neonatal cortex is higher than that of adults, because of neatly aligned large dendrites of the pyramidal cells in the cortex. Anisotropy of the cortex decreases rapidly after birth, suggesting that the development of dendritic arbors in the neuropil destroys the coherent water motion along the columnar organization of the cortex.
Related posts:
 MR Imaging in Inflicted Brain Injury
 Imaging of Perinatal Stroke
 MR Imaging of the Newborn: A Technical Perspective
 Head Ultrasound and MR Imaging in the Evaluation of Neonatal Encephalopathy: Competitive or Complementary Imaging Studies?
 MR Imaging of Neonatal Spinal Dysraphia: What to Consider?
 MR Imaging-Guided Cardiovascular Interventions in Young Children
Stay updated, free articles. Join our Telegram channel

Full access? Get Clinical Tree


