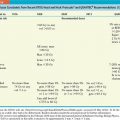
FIGURE 2-1. Non-small cell lung cancer. The only method for GTV delineation in this patient was through the information obtained from an FDG PET/CT, which delineated the tumor, separating it clearly from the rest of the collapsed right lung.
• A drawback of PET-CT is that spatial resolution is 4 to 6 mm versus 1 mm for CT. Also, blurring occurs, particularly around edges. However, a PET scan is performed over a multitude of breathing cycles in free-breathing condition and therefore provides an image of the lesion representing the true time-averaged volume within which the lesion moves during patient respiration. The resulting image ideally shows an increase in lesion size representing the localization of the tumor throughout the whole breathing cycle, which may have additional value in determining the extent of tumor motion during treatment, thus helping to delineate the PTV.3
3. FDG PET/CT PROTOCOL AT COLUMBIA UNIVERSITY/NEW YORK PRESBYTERIAN HOSPITAL
• Patient preparation: NPO for at least 6 hours, including gum, candy, or cough drops.
• Blood glucose level is evaluated, and should be <200 mg/dL.
• Radiopharmaceutical and dose: 12 mCi FDG; 0.14 mCi/kg for pediatric, up to 12 mCi.
• Instrumentation: Siemens Biograph 40 PET-CT scanner or Biograph 64 mCT scanner.
• Procedure:
1. Patient completes questionnaire.
2. The date and time the patient had something to eat or drink is documented.
3. Patient’s height and weight is obtained.
4. Blood glucose level is checked.
5. Intravenous access is obtained and verified with normal saline flush.
6. Proper dose of FDG is administered.
7. IV access is flushed with 10 cc of saline.
8. IV access is removed.
9. Oral contrast is not administered for patients with primary head and neck neoplasms. For all other patients, 1–2 cups of oral contrast (2% barium diluted 1:1 with water) are given after administration of FDG and prior to imaging (the “uptake phase”).
10. Patient is to sit or lie down in a “quiet” uptake room for a period of 60 ± 10 minutes.
11. 30 minutes postinjection, a second cup of oral contrast is given, if indicated/tolerated.
12. Prior to scan, the patient is asked to void urine and remove all metallic objects from the field of view.
13. Patient is positioned on the scan table with arms above the head.
14. Study is acquired from vertex to toes or from canthomeatal line to mid-thigh.
a. Vertex-to-toes scans are acquired for
i. Cutaneous T-cell and B-cell lymphoma
ii. CNS lymphoma
iii. Mycosis Fungoides (common form of CTCL Sezary’s disease)
iv. Melanoma
b. Canthomeatal line to mid-thigh scans are acquired for all other cancer types.
c. Head and neck cancer patients should have additional images from the skull base to the apices with the arms down.
i. Includes only patients with primary head and neck and thyroid cancers, not lymphoma.
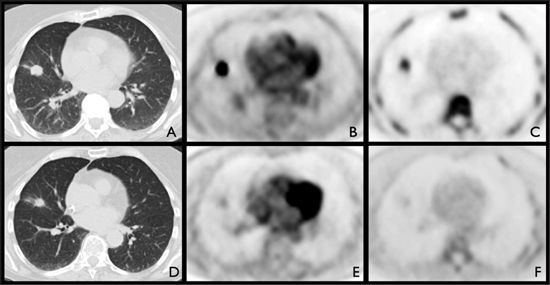
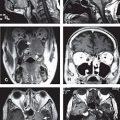
FIGURE 2-2. Pretreatment (A,B,C) and posttreatment (D,E,F) imaging of a 70-year-old woman with adenocarcinoma of the right lung with pathologic confirmation of subcarinal nodal extension on mediastinoscopy. Pretreatment imaging demonstrated a 1.9-cm right middle lobe nodule (A) that was FDG (B) and FLT avid (C). Patient underwent radiation therapy and chemotherapy. Posttherapy imaging showed no change in size (D) but significant decrease in FDG uptake (E), and complete metabolic response by FLT (F).
4. TARGET VOLUME DEFINITION
• In addition to anatomical delineation of gross tumor volume, the “biological tumor volume” can be assessed using PET.
• Various methods have been described to determine the gross tumor volume (GTV) which is defined as the detectable tumor burden.
• The standard uptake value (SUV) method is a popular method to assess the tumor response to treatment.8 The most commonly used definition of SUV is the ratio of lesion activity FDG concentration (mCi/mL) to whole body FDG concentration (injected dose divided by the weight of the patient in grams).9
• Lowe et al. established the absolute-threshold method of SUV, which was defined as 2.5 for lung cancer, and compared it with visual assessment.10 In an analysis of solitary pulmonary nodules (SPNs), they found that PET had an overall sensitivity and specificity for detection of malignant nodules of 92% and 90%, respectively, suggesting that FDG PET can accurately characterize indeterminate SPNs and provides a nonsurgical method to evaluate indeterminate SPNs. This could lead to a reduction in the need for invasive tissue biopsy.
• Visual analysis provided a slightly higher, but not statistically significant, sensitivity of 98% and a lower specificity of 69%. For SPNs ≤1.5 cm (34 of 89), the sensitivity and specificity of SUV and visual analysis were 80% and 95%, and 100% and 74%, respectively.10
• The source-to-background ratio (SBR) method utilizes automatic volume segmentation of functional imaging based on a relationship between source-to-background ratio and the isoactivity level to be used, and is independent of a priori knowledge of the lesion of interest. It is valid for small (<2 mL) and/or poorly contrasted (S/B < 1.5) lesions.11
• Geets et al. developed a gradient-based segmentation method, which associate the boundaries of an object of interest with the gradient intensity crests observed in the image. When applied on denoised and deblurred images, it was shown to be more accurate than the source-to-background ratio method.12
• A watershed clustering method has also been developed. Riddell et al. described the application of morphologic segmentation—the watershed algorithm—which they found to be a promising technique for reducing the acquisition time and eliminating the effects of noise in PET transmission scans. The algorithm is based on the concept that mathematical morphology treats gray-level images as topographies. The gray levels define altitudes, with maxima at the top of peaks and minima at the bottom of valleys.13
• Hatt et al. developed an approach called fuzzy locally adaptive Bayesian (FLAB) algorithm, validated on homogeneous objects, and then improved it by allowing the use of up to three tumor classes for the delineation of inhomogeneous nonspherical lesions with non-uniform uptake (3-FLAB). FLAB automatically estimates parameters of interest from the image, maximizing the probability of each voxel to belong to one of the considered classes. This probability is estimated for each voxel as a function of its value and the values of its neighbors relative to the voxel’s statistical distribution in the image, which corresponds to an estimation of the noise within each class.14
• Existing relationship between PET lesion size and percentage maximum activity concentration within the target volume can be predicted by a model developed by Nehmeh et al. This model was developed by an iterative method based on a mathematical fit that determined dependence of the threshold value on target size, contrast, and maximum activity concentration of FDG PET target volumes in 3D PET acquisitions using Monte Carlo simulations. This model also shows dependence of the threshold value on target/background, which could be eliminated by background subtraction.15
• In certain cancers, it is also important to define the nodal target volumes, which provides a basis for selective nodal irradiation (SNI). In some cancers, such as esophageal or lymphoma, PET-positive lymph nodes can be included in the target volume.
5. NEED FOR NEW MOLECULAR TRACERS
• While FDG PET has been shown to be useful in assessing the metabolic activity of tumors, other tumor characteristics can be analyzed to predict tumor response and to modify radiation treatment planning. For example, characteristics such as accelerated tumor cell repopulation, tumor cell hypoxia, and intrinsic radioresistance, all of which can be heterogeneous across a given tumor volume, are related to resistance to radiation and need to be counteracted to increase the effectiveness of radiotherapy.16,17
• In a rat model of malignant tumor, Zhao et al. found that intratumoral FDG distribution corresponds well to the expression levels of Glut-1, Glut-3, and HK-II. The elevated expression levels of Glut-1, Glut-3, and HK-II, induced by hypoxia (hypoxia inducible factor-1, HIF-1), may be contributing factors to the higher [18F]-FDG accumulation in the CT region.17
• By accurately assessing these characteristics, it is possible to selectively “boost” radioresistant areas while decreasing the dose to less resistant zones, resulting in higher tumor control with similar side effects.18
• FDG uptake shows metabolic activity of tumor cells, which is indirectly related to the proliferative activity and oxygenation status of tumors.
• Although hypoxia causes an increase in glycolytic flux (the Pasteur effect)19 the high tumor uptake of FDG is the result of glycolytic ATP production under nonhypoxic conditions, which is known as aerobic glycolysis or the Warburg effect.20 Therefore, [18F]-FDG PET cannot be used to reliably distinguish hypoxic from normoxic tumors because of the large variations in baseline glucose metabolism and variable magnitudes of the Pasteur effect.21
5.1. Hypoxia Imaging
• Hypoxia has been imaged using nitroimidazole-based radiopharmaceuticals such as [18F]-fluoromisonidazole (FMISO) and [18F]-fluoroazomycin arabinoside (FAZA). The 2-nitroimidazole moiety acts as a bioreductive molecule trapped inside the cell constituents under hypoxic conditions.16
• Lin et al. conducted a dose-escalation planning study that relied on changes in spatial distribution of hypoxia as detected by FMISO images. The study was designed to evaluate how changes in tumor hypoxia, according to serial [18F]-fluoromisonidazole (FMISO) PET imaging, affect the efficacy of intensity-modulated radiotherapy (IMRT) dose painting. They concluded that the changes in spatial distribution of tumor hypoxia, as detected in serial FMISO PET imaging, compromised the coverage of hypoxic tumor volumes achievable by dose-painting IMRT. However, dose painting always increased the equivalent uniform dose,22 which is defined as the biologic equivalent dose that if given uniformly will lead to the same cell kill in the tumor volume as the actual non-uniform dose distribution of the hypoxic volumes.23,24
• FMISO has also been investigated for prediction of early tumor response in treatment of head and neck cancer.25
• Piert et al. compared FAZA with FMISO in detection of tumor hypoxia and verified the oxygenation dependency of FAZA uptake. They concluded that FAZA has the advantage of a more rapid blood clearance than in FMISO, resulting in a higher signal-to-background ratio.26
• [125I]-iodoazomycin arabinoside IAZA, which is more lipophilic than FAZA, undergoes perfusion into areas not delineated by the perfusion marker [99mTc]-hexamethylpropyleneamine oxime in an animal stroke model, indicating good penetration into poorly perfused tissue.27
• Another tracer used for tumor hypoxia is 2-(2-nitro-1H-imidazol-1-yl)-N-(2,2,3,3,3-pentafluoropropyl)-acetamide (EF5) labeled with [18F]-fluorine (Fig. 2-3). In a study of 15 patients with head and neck cancer, Komar et al. evaluated the potential of this tracer for noninvasive detection of hypoxia with PET, by comparing blood flow with regional uptake of [18F]-EF5, and found the tracer to be a promising tool in hypoxia imaging. They also characterized the time course of uptake of intravenously injected [18F]-EF5 in the head and neck area to determine the most suitable PET protocol for this tracer.28
• Cu(II)-diacetyl bis(N
Related posts:
Stay updated, free articles. Join our Telegram channel

Full access? Get Clinical Tree


