FIGURE 1-1. Comparison of CRT (left) and IMRT (right). The ability for CRT to alter isodose lines was limited to shaping of field boundaries with MLCs or blocks, and the use of wedges or compensators for missing tissues and central blocks for shielding critical structures. The IMRT beams can have highly non-uniform beam intensities (fluences) and are capable of producing a more concave-shaped absorbed-dose distribution. With neither conformal therapy nor IMRT can the PRV be always completely avoided, but with IMRT the concave isodose curve that includes the PTV better avoids the PRV. The black region indicates the PTV; the gray region indicates a PRV, and the line surrounding the PTV is a typical isodose contour. (Reprinted from International Commission on Radiation Units & Measurements [ICRU] Report No. 83 in J ICRU 2010:10(1), with permission.)
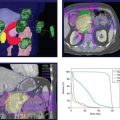
• To illustrate the dosimetric advantage of IMRT over conventional 3DCRT techniques, Figure 1-2 shows the isodose curves for four different RT modalities: two conventional 3DCRT (with four and seven fields, respectively) and two IMRT plans, one using serial tomography and the second with a ten-field step-and-shoot MLC. Note the better conformality in the IMRT plans.
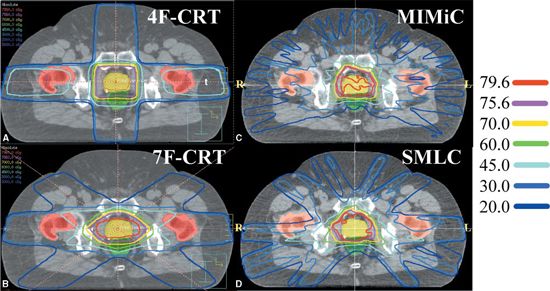
FIGURE 1-2. Typical isodose distributions for treating prostate cancer from (A) a four-field three-dimensional conformal radiation therapy (3DCRT) plan (4F-CRT), (B) a seven-field 3DCRT plan (7F-CRT), (C) an intensity-modulated radiation therapy plan delivered by serial tomotherapy using MIMiC (NOMOS Corp., Sewickley, PA), and (D) a ten-field step-and-shoot segmental multileaf collimator (SMLC) plan.
1.2. Limitations and Risks of Intensity-Modulated Radiation Therapy
• We should recognize, however, that IMRT has limitations. There are many dose distributions (or dose–volume combinations) that are simply not physically achievable. Furthermore, our knowledge of what is clinically optimal and achievable and how best to define clinical and dosimetric objectives of IMRT is often limited. Moreover, the best solution may elude us because of the limitations of the mathematical formalism used or because of the practical limits of computer speed and hence the time required to find it.
• Uncertainties of various types (e.g., those related to daily, or interfraction, positioning; displacement and distortions of internal anatomy; intrafraction motion; and changes in physical and radiobiologic characteristics of tumors and normal tissues during the course of treatment) may limit the applicability and efficacy of IMRT. Dosimetric characteristics of a delivery device, such as radiation scattering and transmission through the MLC leaves, introduce some limitations in the accuracy and deliverability of IMRT fluence distributions. In addition, the limited spatial and temporal coverage and overall accuracy of the current IMRT dosimetric verification systems (based principally on radiographic and radiochromic film) diminish the confidence in the delivered dose. Furthermore, most current dose calculation models are limited in their accuracy, especially for the small, complex shapes required for IMRT.
• It is quite conceivable that inaccuracies in dose calculations may yield a solution different from the one derived if dose calculations were accurate. Perhaps the most important factor that may limit the immediate success of IMRT is the inadequacy of imaging technology to define the true extent of the tumor, its extensions, and radiobiologic characteristics as well as the geometric, dose–response, and functional characteristics of normal tissues.
• We should also be aware of the risks of IMRT. The effect of large fraction sizes used in integral boost IMRT on tissues embedded within the gross tumor volume (GTV) is uncertain and may present an increased risk of injury.18 There may also be an increased risk that improper use of spatial margins, coupled with the high degree of conformality with IMRT, may lead to geographic misses of the disease and recurrences, especially for disease sites where positioning and motion uncertainties play a large role or where there are significant changes in anatomy and radiobiology during the course of radiotherapy. Similarly, high doses in close proximity to normal critical structures may pose a higher risk of normal tissue injury. In addition, IMRT dose distributions are unusual and highly complex and existing experience is too limited to interpret them properly and evaluate their efficacy. Finally, while IMRT can spare specific tissues as compared to conventional RT, the use of many more beams and irradiation angles means that a larger volume of normal tissue is exposed, albeit to lower accumulated doses.
1.3. Intensity-Modulated Radiation Therapy Procedures
1.3.1. Various Intensity-Modulated Radiation Therapy Implementations
• During the past 15 years, a variety of techniques have been explored for designing and delivering optimized IMRT.6,7,10,12,18–47 Many of these are implemented in commercial IMRT systems. The most significant differences among the various approaches are in terms of the mechanisms they use for the delivery of non-uniform fluences. Although the merits of each are often speculated, the superiority of any of the approaches over the others is difficult to assess because there have been no systematic comparisons of clinical treatment plans.
• Of the various approaches proposed, two dominant but significantly different methods have emerged. Mackie et al.33,48 proposed an approach called tomotherapy in which intensity-modulated photon therapy is delivered using a rotating slit beam. A temporally modulated slit MLC is used to rapidly move leaves into or out of the slit. Like in a computed tomography (CT) unit, the radiation source and the collimator continuously revolve around the patient. The patient is translated either between successive rotations (serial tomotherapy) or during rotation (helical tomotherapy). For helical tomotherapy, the system looks like a conventional CT scanner and includes a megavoltage portal detector to provide for tomographic reconstruction of the delivered dose distribution. Arc therapy has been reviewed by Palma et al.49
• A commercial slit collimator (called MIMiC) of the type proposed by Mackie et al.33 has been designed and built by NOMOS Corporation presently Best nomos, Pittsburgh, PA. The MIMiC collimator was incorporated into their serial tomotherapy system, known as Peacock,25,26 for planning and rotational delivery of intensity-modulated treatments.50 Modern tomotherapy machines are marketed by Accuray Inc.
• In the second approach, implemented first into clinical use at Memorial Sloan-Kettering Cancer Center,6,7,34,36,42,43,51 a standard MLC is used to deliver the optimized fluence distribution either in dynamic mode (defined as the leaves moving while the radiation is on) or in static mode, that is, the “step-and-shoot” mode (defined as sequential delivery of radiation subportals that combine to deliver the desired fluence distribution), to deliver a set of intensity-modulated fields incident from fixed gantry angles. These techniques are gaining wide acceptance rapidly. Every major commercial treatment planning system manufacturer has implemented one or both of these approaches. Figure 1-3 shows a multileaf collimator and a cutaway view of a modern linac machine.
• A third approach, called intensity-modulated arc therapy or IMAT, developed by Yu,47 uses a combination of dynamic multileaf collimation and arc therapy. The shape of the field formed by the MLC changes continuously during gantry rotation. Multiple superimposing arcs are used, and the field shape for a specific gantry angle changes from one arc to the next appropriately in such a way that the cumulative fluence distribution of all arcs is equal to the desired distribution. In 2007, a new form of arc therapy, termed “Volumetric-Modulated Arc Therapy (VMAT),” was proposed. In VMAT, the dose rate, gantry speed, MLC leaf positions, and optionally the collimator angles are allowed to dynamically vary during treatment delivery.52 Arc therapy is discussed in a recent review and comparison of intensity-modulated techniques.53
• In addition to these approaches, the University of Michigan has used the so-called multisegment approach in which each of a number of beams is divided into multiple segments.54 One segment of each beam frames the entire target while the others spare one or more normal structures. Each segment is uniform in intensity. The weights of segments of all beams are optimized to produce the desired treatment plan. The treatments are delivered as a sequence of multiple uniform field segments. A similar approach was proposed previously by Mohan et al.55 In almost all of these significantly different treatment delivery approaches, the underlying principles of optimization are similar although the specifics may be quite different.
• Intensity-modulated proton therapy (IMPT). A scanning proton pencil beam can be produced and delivered in a way similar to that in photon IMRT. Different from the linear accelerator–based photon machine (using electrons to produce Bremsstrahlung x-rays and multileaf collimators to form pencil photon beams), pencil proton beams can be directly produced by either a synchrotron or a cyclotron, and the pencil beam can be steered by a scanning magnetic field. In order to deliver IMPT, both the intensity and the energy of the proton pencil beam need to be variable. The energy of the proton beam determines the depth of the Bragg peak at which the proton beam delivers the highest dose to the treatment target. An IMPT clinical example was described by Lomax et al.80
1.3.2. Intensity-Modulated Radiation Therapy Process Overview
• As mentioned previously, there are significant differences in concepts and processes between 3DCRT and IMRT. However, there are also many similarities. In particular, IMRT relies on many of the same imaging, dose calculations, plan evaluation, quality assurance (QA), and delivery tools as does 3DCRT.
• The IMRT process consists of several phases: planning, quality assurance (QA), and delivery of radiation with either static or dynamic MLC. The steps of IMRT optimization during planning are shown in Figure 1-4. The tomotherapy process is similar, except that the fixed-beam angle selection is replaced by selection of the slice thickness and for serial tomotherapy, by selection of the gantry rotation angles.
• In the preparatory phase of the IMRT process, volumes of interest (such as tumors and normal organs) are delineated on 3D CT images,56 often with assistance from other co-registered imaging modalities. The second imaging technique most often used is magnetic resonance imaging (MRI); the latter has an advantage over CT in that it can provide both structural and physiologic information.57 Other imaging modalities such as positron emission tomography (PET) use intrinsic or externally added molecular markers to visualize specific metabolic processes or cellular phenotypes.58–62 Variations in target contouring between physicians can be significant, and efforts at computer-assisted methods have been reported, for example, by Chao et al.,63 using deformable image registration. Hong et al.64 recently reviewed target volume contouring practices in head and neck cancer patients at 20 institutions and found significant heterogeneity. The RTOG has devoted considerable effort to its online contouring atlases for various disease sites.
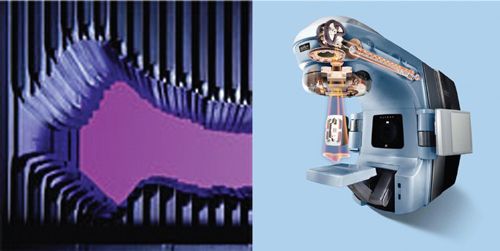
FIGURE 1-3. Left, a multileaf collimator viewed along its beam axis. Right, cutaway view of the gantry head of Clinac ® RT machine. Photos courtesy of Varian Medical Systems.
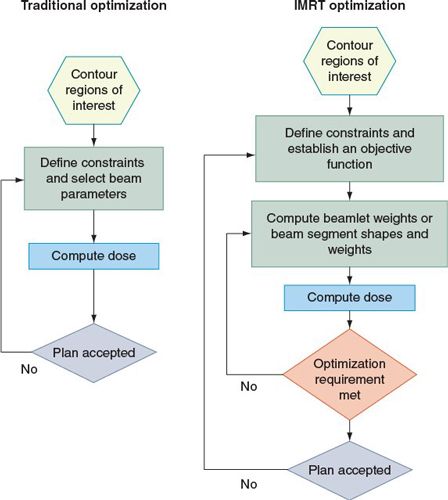
FIGURE 1-4. Comparison between traditional (left) and IMRT (right) optimization processes. (Reprinted from J ICRU 2010: 10(1), with permission.)
• The desired objectives in the form of an objective function, its parameter values, and the IMRT fractionation strategy are then specified, and beam configuration is defined. Typically the objective function65 assigns a weighted “cost” to the square of the difference between the desired 3D fluence distribution and that calculated at a given iteration. The software attempts to minimize the costs—maximizing dosage to the tumor volume and minimizing exposure of normal tissues.
• In the treatment plan optimization phase, an iterative process is used to adjust and set the intensities of rays of each beam (or portion of the arc) so that the resulting intensity distributions yield the best approximation of the desired objectives. The IMRT plan is then evaluated to ensure that the trade-offs made by the optimization system are acceptable. If further improvement is deemed necessary and possible, the objective function parameters are modified and the optimization process repeated until a satisfactory treatment plan is achieved.
• In the leaf sequence–generation phase, the intensity distributions are converted into sequences of leaf positions. It is conceivable that certain dose distributions cannot be delivered as a result of the leakage characteristics of the delivery devices. Therefore, in most treatment-planning systems, the leaf sequences are used in a reverse process to calculate the dose distributions they are expected to deliver. These dose distributions, called the deliverable dose distributions, are evaluated for clinical adequacy. If necessary, objective function parameters are further adjusted to produce an intensity distribution that leads to a deliverable dose distribution that meets the desired objectives. This is the practice in most systems. However, in some systems the leaf sequence–generation process is incorporated into the IMRT plan optimization loop so that the optimized and deliverable dose distributions are identical. The leaf sequences then are transmitted to the treatment machine and used to verify whether the dose distribution that will be delivered to the patient is correct and accurate. The patient is then set up in the usual fashion and treated. In general, the entire treatment is delivered remotely without the need to reenter the treatment room in between fields.
2. INTENSITY-MODULATED RADIATION THERAPY TERMINOLOGY
• Because IMRT is an emerging technology, it is essential to know the definitions of some of the important nomenclature used in IMRT planning and delivery.
• Monitor Unit (MU): the dosage delivered at the central axis of the treatment beam. Linear accelerator (linac) machines are typically calibrated so that 1 MU equals 1 cGy.
• Beamlet (bixels or rays): The beamlet is a small photon intensity element used to subdivide an intensity-modulated beam for the purposes of intensity distribution optimization or dose calculation. Sometimes, the beamlets are also called “bixels,” “rays,” or “pencil beams.” The intensity of the beamlet can be expressed in units of either particle fluence or energy fluence, depending on the particular dose-calculation algorithm used.
• Dynamic Multileaf Collimator (DMLC): The DMLC is an IMRT delivery mode in which the leaves continuously move and shape the beam intensity while the radiation is turned on. This mode has the advantage of higher spatial resolution and quick treatment delivery; however, it requires more accurate synchronization of leaf positions with beam-on time. Typical examples of this mode are the sliding-window technique using conventional multileaf collimators (MLCs) and the NOMOS MIMiC system using binary collimators in the arc treatment mode.66,67
• Static Multileaf Collimator (SMLC): The SMLC is an IMRT delivery mode in which the leaves only move when the radiation beam is turned off and remain in their predefined positions while the required radiation doses are being delivered. This is usually called the “step-and-shoot” delivery technique.68,69
• Segment: This is the shaped aperture (usually formed by MLCs) with uniform beam intensity. A segment is the basic unit in an SMLC treatment delivery. Sometimes a segment is also called a “control point.”
• Objective Function: This function is a mathematic formalism of clinical requirements. These clinical requirements can be (a) dose based, such as the minimum or maximum dose for a target or critical structure; (b) dose–volume based, which specifies a fractional volume that can receive certain doses; and (c) dose–response based, which usually uses limited clinical data to translate the dose requirements into certain clinical outcomes. These clinical indicators (outcomes) may include, but are not limited to, tumor control probability, normal tissue complication probability, and equivalent uniform doses.
• Score (cost): The score is a numeric value of the objective function that represents a figure of merit indicating the quality of a treatment plan. The numeric score is a key parameter for IMRT optimization.
• Inverse Planning: This is the term used to describe an optimization process that translates the mathematic formalism of clinical requirements into deliverable intensity patterns. The mathematical problem of optimization has been reviewed by Ehrgott et al.70 Although the word “optimization” is used, it does not always guarantee that a global optimal solution is found for the clinical problem. The numeric solution can be trapped into a local minimum during the optimization process. The solution is also subject to the limitations of the mathematical description and parameterization of the clinical problem. A flawed objective function can lead to erroneous or clinically inferior solutions.
• Forward Planning: Forward planning is a trial-and-error process in which the treatment fields or beam weights are modified iteratively (usually manually) to achieve acceptable clinical solutions. The process is commonly used in designing 3DCRT plans, although the same process can be used to create simple “field-in-field” intensity-modulated treatments. Sometimes a simple beam-weight optimization may be used in the forward planning process, but a forward planning process, in general, does not take full advantage of mathematic optimization using beamlets. Because of the limitations in current IMRT planning systems, the forward planning process can be effective in solving certain clinical problems. For example, the “field-in-field” planning technique has been used successfully in designing breast cancer radiation treatments in which the goal was to improve the dose uniformity in a parallel-opposed beam arrangement.71,72 There is also reported success in head and neck and prostate treatments, but, in general, the solutions are inferior as compared with the inverse-planning approach.73,74
• Leaf Sequencing and Deliverable Optimization: The leaf sequence is a set of leaf positions and the corresponding monitor units (MUs) (beam-on time) to be delivered by the treatment machine. In some IMRT planning systems, the optimization process is separated into two sequential steps. The first step is to generate the ideal fluence patterns that satisfy the optimum solution for the objective function. Then the ideal fluence patterns are converted into deliverable leaf sequences in the second step. If the optimization process does not take into account some of the limitations of the deliverable system (e.g., leakage and head scatters), there will be a degradation in the final deliverable treatment plan. Sometimes the optimization process can create leaf sequences that are not physically deliverable. A deliverable optimization process takes into account the constraints and characteristics of the leaves and reoptimizes leaf sequences on the basis of deliverable fluence distributions and the original objective function.75,76 Deliverable optimization will improve the quality or the deliverability of an IMRT plan.
• Aperture-based IMRT: To improve deliverability and reduce beam-on time, a subset of IMRT solutions is sought by dividing the treatment portal into predefined segments or apertures. The rule of aperture segmentation varies depending on differences in implementations.77–79 When the beam apertures are defined, the optimization process becomes a standard beam-weight optimization, which can be solved quickly. Because aperture-based IMRT does not take full advantage of beamlet optimization, the solution is usually inferior to that of a pencil beam–based inverse-planning algorithm.
• Class Solution: This involves the use of historical experience based on solving similar cases with the same treatment technique or the same approach. Typical IMRT class solutions include a set of fixed gantry angles or a set of partial volume dose prescriptions for a particular treatment site. A clinical protocol, such as the Radiation Therapy Oncology Group (RTOG) phase I and II study of conformal and IMRT treatments for oropharyngeal cancer (RTOG H-0022, http://www.rtog.org), contains many important clinical guidelines, but may not include sufficient treatment directives for actual IMRT planning. An example of a class solution for ethmoid sinus cancer was described by Claus et al.81
• Multimodality Image Fusion: As target delineation becomes an important step in IMRT planning, the use of two or more imaging techniques to provide additional spatial or functional information about the treatment target(s) has become common. Image fusion refers to a process that combines two or more signals from different images of the same subject into one single dataset. In most situations, the additional information from the fused image is transcribed to the computed tomography image dataset as contoured structures, which will be used for IMRT planning.
• Image Registration: This is a process to find the geometric transformation that brings one image in precise spatial correspondence with another image. Image registration is frequently used in both single modality and multimodality image fusion.
• Digital Imaging and Communications in Medicine (DICOM): This is a standard protocol for medical image transmission and management (http://medical.nema.org/). Most diagnostic images are transferred from one system to another by using the latest DICOM 3 protocol, maintained by the combined efforts of the ACR and the National Electrical Manufacturers Association. The latest standard can be obtained at ftp://medical .nema.org/medical/dicom/final/
• DICOM RT: This is the RT extension of the DICOM protocol. The current RT objects include, but are not limited to, the RT structure set (contours are delineated from the images for each named structure), RT image (e.g., digitally reconstructed radiographs and portal images), RT plan (e.g., treatment parameters, including gantry angles, collimator settings, MUs, and MLC leaf positions), and RT dose (calculated dose matrix).
3. INTENSITY-MODULATED RADIATION THERAPY TREATMENT PLANNING
3.1. Delineation of Target Volume and Critical Structures
• ICRU 83 presents updated definitions for the assorted volumes, which will form the skeleton of the treatment plan.3 Conceptually, the volumes contain three types of tissue: (a) malignant lesion; (b) otherwise normal tissue near the tumor which is already or likely to be infiltrated by microscopic disease; and (c) more distant normal issue and organs. The quoted definitions which follow are from ICRU 83.3
• Gross Tumor Volume (GTV): “The GTV is the gross demonstrable extent and location of the tumor. The GTV may consist of a primary tumor (primary tumor GTV or GTV-T), metastatic regional node(s) (nodal GTV or GTV-N), or distant metastasis (metastatic GTV, or GTV-M).” They note that in some cases it may not be possible to differentiate expanding primary lesions from nearby metastatic disease. The GTV for IMRT is always defined from anatomical images, usually CT with or without MRI, and increasingly supplemented by PET.
• Clinical Target Volume (CTV): “The CTV is a volume of tissue that contains a demonstrable GTV and/or subclinical malignant disease with a certain probability of occurrence considered relevant for therapy. There is no general consensus on what probability is considered relevant for therapy, but typically a probability of occult disease higher than from 5% to 10% is assumed to require treatment.” The volumes outside the GTV encompassed by the CTV will depend a great deal on the particular tumor, for example, with high or low propensity for lymph node extension. In the past, the CTV was effectively the GTV (including affected nodes) plus a 1- to 2-cm margin. The current definition stresses more the physiologic criteria based on specifics of disease spread for each tumor. Gregoire and co-workers have compiled studies on CTV margins into a book.82 In postoperative situations, following an R0 or R1 resection, there is no gross tumor so only the CTV need be defined. Readers are strongly encouraged to consult the ICRU 83 report for details.
• Planning Target Volume (PTV): “The PTV is a geometrical concept introduced for treatment planning and evaluation. It is the recommended tool to shape absorbed-dose distributions to ensure that the prescribed absorbed dose will actually be delivered to all parts of the CTV with a clinically acceptable probability, despite geometrical uncertainties such as organ motion and setup variations.”
• Organ at Risk (OAR): “The OAR or critical normal structures are tissues that if irradiated could suffer significant morbidity and thus might influence the treatment planning and/or the absorbed-dose prescription. In principle, all non-target tissues could be OARs. However, normal tissues considered as OARs typically depend on the location of the CTV and/or the prescribed absorbed dose.” All normal tissue exposed to radiation during treatment is at risk, but the OAR is generally taken to be rather more specific—structures in the immediate vicinity of the PTV, sparing of which may demand specific recontouring of the CTV or PTV. Historically OARs have been loosely grouped into “serial,” or “parallel” organs or a combination of the two, following the work of Withers and co-workers using the concept of functional subunits in each organ.82,84,85 Serial organs, such as spinal cord, can suffer unacceptable damage even if only a small portion is irradiated, whereas parallel organs such as liver can suffer loss of a portion without total loss of function.
• Planning Organ at Risk Volume (PRV): “As is the case with the PTV, uncertainties and variations in the position of the OAR during treatment must be considered to avoid serious complications. For this reason, margins have to be added to the OARs to compensate for these uncertainties and variations, using similar principles as for the PTV. This leads, in analogy with the PTV, to the concept of PRV.” As with the OAR itself, margins in the PRV will be affected by the serial or parallel attributes of the adjacent tissues.
• Remaining Volume at Risk (RVR): “The RVR is operationally defined by the difference between the volume enclosed by the external contour of the patient and that of the CTVs and OARs on the slices that have been imaged.” Definition of an RVR and its inclusion in the treatment plan (at least in the form of dose constraints) are essential in IMRT. Without such limits, the optimization software could craft excellent dose distributions for the CTV and OAR, but cause toxic irradiation levels in otherwise uncontoured tissues.
• Treated Volume (TV): “The TV is the volume of tissue enclosed within a specific isodose envelope, with the absorbed dose specified by the radiation oncology team as appropriate to achieve tumor eradication or palliation, within the bounds of acceptable complications.” The TV is what is physically deliverable given the limitations of beam collimation and homogeneity, and, more importantly, the risks of treatment-associated morbidity acceptable to the oncologist and the patient. ICRU 83 proposes that, in conformity with its proposal for proton therapy, the TV be defined as the dosage received by 98% of the PTV. This serves as a measure of the minimum absorbed dose and is also referred to as Dnear-minimum. In an analogous manner, a Dnear maximum is defined as D2%, the dose received by 2% of the PTV receiving the highest fluence. Readers are referred to Section 3 of the ICRU report.
• It should be noted that the GTV, CTV, and OAR represent volumes based on anatomical and physiologic judgments of the location of malignant growths, or of normal tissues in danger from metastatic spread and/or treatment-induced toxicity. These are independent of the particular irradiation protocol employed (viz., 3DCRT, IMRT, or particle beams). The PTV, PRV, and TV are intimately tied to the specific radiation therapy used.
• The optimization process considers explicitly and simultaneously both the gross disease and the larger volumes of occult or microscopic disease to design an IMRT plan. A supplementary margin is added to allow for uncertainties related to the movement of the tumor volume from one day to the next and for intrafraction motion to obtain the PTVs. The number of normal structures that need to be drawn also increases. In conventional radiotherapy, in which the use of large uniform fields is typical and the treatment plans are evaluated manually, a clinician can make a reasonable estimate of the dose received by a volume of interest even if it is not explicitly drawn. In IMRT, in which dose is being escalated to unprecedented levels, where dose distributions are highly non-uniform, and where plans are generated and evaluated by the computer during the iterative optimization process, all structures to which the dose must be constrained need to be delineated. Examples of such target delineations will be given graphically in the subsequent chapters on each organ system.
• IMRT is also called “image-guided” radiotherapy because the use of volumetric image information is almost compulsory. Due to the steep dose gradients employed, the success of IMRT depends crucially on the accurate determination of the target volume and critical organs at risk (OAR). Besides set-up errors, there will be changes in the location and volume of tumors and normal tissues during the course of treatment.
• Multimodality imaging can enhance our knowledge about the extent that diseases should be treated. In addition, and especially for IMRT, imaging is being incorporated into the treatment course to adjust the radiation fields to the actual positions of target volumes and OAR.
3.2. Treatment Planning and Optimization
• The core of IMRT is in the treatment planning and optimization processes. The planner can vary the amount of irradiation administered on a given day of the treatment course and the way that is distributed. The latter can be adjusted by altering the fluence (with an MLC) and the direction of the radiation source (beam angle). These processes translate clinical requirements of a specific clinical problem into machine-deliverable commands.
3.2.1. Fractionation/Treatment Schedule
• In principle, conventional fractionation strategies can be used to design IMRT plans as well. For example, with a strategy similar to the conventional 1.8-Gy to 2-Gy/fx schedule, a major portion of the dose could be delivered in the initial phase using uniform fields designed with standard 3D conformal methods followed by an IMRT boost. Alternatively, separate IMRT plans could be designed for both the initial large-field treatment and the boost treatment. It may be intuitively obvious that, if a large portion of the dose has already been delivered using large fields, it may be very difficult, if not impossible, to achieve a high level of dose conformation with the remaining fractions in the IMRT-boost phase.18
• As indicated earlier in this chapter, IMRT may be most conformal if all target volumes (gross disease, subclinical extensions, and electively treated nodes) are treated simultaneously using different fraction sizes.18 Such a treatment strategy has been called the simultaneous integrated boost.13,14,18 Mackie and co-workers had also indicated the possibilities for irradiation boost in their first paper on serial tomography.33 The SIB IMRT strategy not only produces superior dose distributions; it is also an easier, more efficient, and perhaps less error-prone way of planning and delivering IMRT because it involves the use of the same plan for the entire course of treatment. Furthermore, in many cases, there is no need for electron fields and the nodal volumes can be included in the IMRT fields; thus the perennial problem of field matching86 encountered in the treatment of many sites is thereby avoided.
• Because each of the target regions receives different doses per fraction in the SIB IMRT strategy, prescribed nominal (physical) dose and dose per fraction must be adjusted appropriately. The adjusted nominal dose and fraction size for each target region depends on the number of IMRT fractions. The fraction sizes may be estimated using an isoeffect relationship based on the linear–quadratic model and the values of its parameters (such as α/β ratios, tumor doubling time).
• The effect of the modified fractionation on acute and late toxicity of normal tissues both outside and within the volumes to be treated also should be considered. Because of the improved conformality of IMRT plans, dose to normal tissues outside the target volume is typically lower than for conventional treatment plans. In addition, if the number of fractions is larger than the number of fractions used to deliver large fields in conventional therapy, the dose per fraction to normal tissues is lower. Therefore, the biologically effective dose would be lower still. However, normal tissues embedded within or adjacent to the target volumes would receive high doses per fraction and may be at higher risk. Isoeffect formulae for normal tissues also may be derived to estimate the effect of a particular fractionation strategy (see ICRU 83, pp. 36–38). These formalisms would need to incorporate regeneration and change in sensitivity over the treatment course.
• The values of parameters for the computation of altered fractionation may, in theory, be obtained from published studies. Studies by Maciejewski et al.87 and Withers et al.,88–90 for example, have yielded important information for estimating tumor parameters for head and neck carcinoma. In general, the data available are limited. Furthermore, there is considerable uncertainty in the data, and there are concerns about the validity of the numerous assumptions in the linear–quadratic model and the isoeffect formalism, especially with regard to normal tissues. (For an early review of the linear–quadratic model see Fowler.91) Much of the accumulated data on normal tissue complications comes from clinical experience in the era of wide field RT, so the dosage limits reported from such studies may not be immediately applicable to IMRT. Nevertheless, various investigators have carried out the necessary calculations and adopted SIB IMRT fractionation strategies. Continued investigations and clinical trials are needed to develop more reliable time–dose fractionation models, to produce better estimates of their parameters and to evaluate alternate SIB IMRT fractionation strategies for all sites.15 The following are some examples of IMRT fractionation strategies that have been used for IMRT of head and neck cancers.
• In Radiation Therapy Oncology Group H-0022 protocol for early stage oropharyngeal cancer, 30 daily fractions (5 per week × 6 weeks) are used to simultaneously deliver 66 Gy (2.2. Gy per fraction) to the PTV, 60 Gy (2 Gy per fraction) to the high-risk subclinical disease (“levels II–IV bilaterally, Ib ipsilaterally, and level V and retropharyngeal nodes if the jugular nodes were involved”), and 54 Gy (1.8 Gy per fraction) to subclinical disease. These are biologically equivalent to 70, 60, and 50 Gy, respectively, if given in 2 Gy per fraction. For normal structures, brainstem, spinal cord, and mandible are maintained below 54, 45, and 70 Gy, respectively. The mean dose to the parotid glands is maintained below 26 Gy and/or 50% of one of the parotids is maintained below 30 Gy and/or at least 20 mL of the combined volume of both parotids is constrained to receive no more than 20 Gy. Sixty-nine patients were accrued at 14 institutions. Treatment-associated xerostomia improved following therapy, in contrast to regular RT. High locoregional control was achieved with stringent adherence to protocol guidelines.92
• The SIB strategy at Virginia Commonwealth University involves a dose-escalation protocol in which primary nominal dose levels of 68.1, 70.8, and 73.8 Gy, given in 30 fractions (biologically equivalent to 74, 79, and 85 Gy, respectively, if given in 2 Gy per fraction) are used.93 Simultaneously, the subclinical disease and electively treated nodes are prescribed 60 and 54 Gy, respectively (biologically equivalent to 60 and 50 Gy, respectively, if given in 2 Gy fractions). Spinal cord and brainstem are maintained below 45 and 55 Gy, respectively, and an attempt is made to allow no more than 50% of at least one parotid to receive higher than 26 Gy.
• At the Mallinckrodt Institute of Radiology, the SIB strategy for definitive IMRT prescribes 70 Gy in 35 fractions in 2 Gy per fraction to the volume of gross disease with margins. The adjacent soft tissue and nodal volumes at high risk are treated to 63 Gy in 1.8 Gy per fraction, and simultaneously 56 Gy in 1.6 Gy per fraction is given to the elective nodal regions. This regimen has been shown to be well tolerated when combined with concurrent chemotherapy.94
• A concise review of altered fractionation in treatment of head and neck cancer has recently been presented by Mendenhall et al.95
• Normal tissue dose limits based on recent clinical experience, RTOG protocols, and the QUANTEC recommendations are presented in Chapter 4.
3.2.2. Beam Configuration
3.2.2.1. Systems Using Fixed Intensity-Modulated Fields
• The beam configuration can have a significant impact on the quality of an optimized IMRT plan. It may be argued that, because of the greater control over dose distributions afforded by optimized intensity modulation, the fine-tuning of beam angles may not be as important for IMRT as it is for standard radiotherapy. However, optimization of beam angles may find paths least obstructed by critical normal tissues, thus facilitating the achievement of the desired distribution with a minimum of compromise.
• Beam angle optimization, however, is not a trivial problem. There have been some attempts to solve this problem,96–98 and the recent advances in mathematical operations research applied to the problem have been reviewed recently.70 To appreciate the magnitude of the problem, consider the following example. If the angle range is divided into 5-degree steps, nearly 60,000 combinations would need to be tested for three beams, nearly 14 million combinations for five beams, nearly 1.5 billion combinations for seven beams, and so on. Considering the magnitude of the search space, none of the optimization methods is likely to be able to demonstrate a significant improvement in treatment plans, let alone find a truly optimum combination when the number of beams is five or more.
• Furthermore, the beam angle optimization problem is known to have multiple minima,99 which means that fast gradient-based optimization techniques may fail. Stochastic methods100,101 in principle should avoid the local minimum problem, but may present excessive computing time demands. This should prove less of a problem in the near future, especially with the use of dedicated parallel processors which can drastically reduce computation time. For a review see Pratx.102
• Another question that may be asked is how many beams are optimal. In principle, a larger number of beams would provide a larger number of parameters to adjust and therefore a greater opportunity to achieve the desired dose distributions. (Thus, in theory, a rotational beam would be the ultimate.) However, for fixed-beam IMRT, it may be desirable to minimize the number of beams to reduce the time and effort required for planning, QA, dosimetric verification, and delivery of treatment. Fewer intensity-modulated beams would be needed if beam angles were optimized than if the beams were placed at equiangular steps. Calculations by Webb11 indicate that 7 or 9 fields give adequate conformal dose distributions for both serial tomography and fixed gantry IMRT.
• Figure 1-2 compares prostate treatment plans employing different numbers of fields using 3DCRT, serial tomography, and step-and-shoot IMRT. Consistent with published experience, the plan quality improves but the incremental improvement diminishes with increasing number of beams. Optimum non-uniform placement of beams can further improve dose distribution. Figure 1-5A and B shows a head and neck IMRT case for two different sets of beam angles. The patient, treated with beam configuration shown in Figure 1-5A, developed significant mucositis at the early phase of treatment. This was consistent with the “horn” in dose distribution pointed to by the arrow. Revising the beam angle arrangement as shown in Figure 1-5C led to improved dose distribution shown in Figure 1-5D.
• In general, it is most advantageous to place beams in such a way that they are maximally avoiding each other and the opposing beams with the stipulation that directions that overlap significant obstructions, such as heavily attenuating bars in the treatment couch, be avoided. For simplicity, beams often are constrained to lie in the same transverse plane. However, noncoplanar beams will provide an additional degree of freedom and potentially an additional gain in the quality of treatments. It should be noted that the beam configurations used for 3DCRT may not be optimal for IMRT.103
• Although reducing the number of beams is a desirable goal for IMRT delivered with several fixed-gantry angles and dynamic MLC, it should not be the overriding consideration. IMRT can be planned and delivered automatically in times not significantly different from the times for much simpler conventional treatments. Therefore, the delivery times for 6 to 20 beams may be quite acceptable. Keep in mind, however, that some of the current linear accelerators are limited in their ability to accurately deliver a large number of intensity-modulated beams each with a very small number of monitor units.
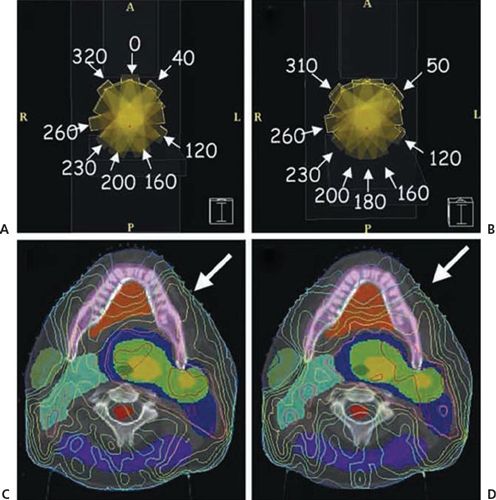
FIGURE 1-5. A patient with carcinoma of the base of the tongue was treated with intensity-modulated radiation therapy. (A) and (B) depict the beam angle arrangement and the resulting isodose distribution. Arrow on (C) indicates a “horn” of high dose to the left oral tongue and buccal mucosa. Rearranging the anterior beam placement (B) led to improvement of dose distribution to the normal mucosa of left anterior oral cavity (D). (Reprinted from Halperin EC, Perez CA, Brady LW. Principles and Practice of Radiation Oncology, 5th ed. Philadelphia, PA: Lippincott Williams & Wilkins, 2008:245.)
3.2.2.2. Systems Using Rotating Slit (Tomotherapy) Approach
• Tomotherapy delivery has substantial differences from fixed-portal IMRT. Mackie has given an historical overview of tomotherapy, intertwined as it is with his career.48 The linear accelerator rotates during delivery, and the beam is modulated during rotation. Typically, the modulation is subdivided into small gantry angle ranges (e.g., 5 degrees), and the beam is independently modulated at each gantry angle. Each leaf is used to deliver a single rotating pencil. Pencil-beam modulation is conducted for each leaf by opening that leaf for a fraction of the gantry range consistent with the fractional fluence to be delivered from that gantry angle. For example, for a 5-degree angle range bin, if a leaf is to deliver 50% fluence, the leaf will be open for 2.5 degrees over the 5-degree range. Because of geometric constraints of modulating the radiation fan beams, only one or two thin planes can be treated with each rotation.
• The Peacock system,5 for instance, uses two banks of opposing leaves projecting to 1.7 or 3.4 cm, depending on user-selected mechanical stops. This delivers modulated beams to two abutting, independently modulated planes. The helical tomotherapy unit uses a single leaf bank with a backup collimator that allows the radiation field width to be continuously adjusted. Narrower leaf widths provide higher spatial resolution for modulation but require more treatment arcs and consequently more delivery time. The current TomoHD MLC uses tungsten leaves 10 cm thick (in beam direction), with a width of 0.625 cm. Leaves are driven pneumatically and switch in 20 msec.
3.2.3. Planning Objectives
• Optimization of ray intensities may be carried out using one of several mathematical formalisms and algorithms,70 also termed “optimization engines.” Each method has its strengths and weaknesses. The choice depends in part on the nature of the objective function and in part on individual preference. Although the details are complex, the basic principles are not difficult to comprehend. Each ray of each beam is traced from the source of radiation through the patient. Only the rays that pass through the target volume need to be traced (plus through a small margin assigned to ensure that the lateral loss of scattered radiation does not compromise the treatment). Others are set to a weight of zero.
• The patient’s 3D image is divided into voxels. The dose at every voxel in the patient’s body is calculated for an initial set of ray weights. The resulting dose distribution is used to compute the “score” of the treatment plan (i.e., the value of the objective function that mathematically states the clinical objectives of the intended treatment).
• The ray-tracing process identifies the tumor and normal tissue voxels that lie along the path of the ray. The effect of a small change in a ray weight on the score is then calculated. If the increase in ray weight would result in favorable consequences for the patient, the weight is increased, and vice versa. Mathematically speaking, the ray weight is changed by an amount proportional to the gradient of the score with respect to the ray weight. Realizing that the improvement in the plan at each point comes from rays from many beams and that each ray affects many points, only a small change in ray weight may be permitted at a time. This process is repeated for each ray. At the end of each complete cycle (an iteration), a small improvement in the treatment plan results. The new pattern of ray intensities is then used to calculate a new dose distribution and the new score of the plan, which is then used as the basis of further improvement in the next iteration. The iterative process continues until no further improvement takes place, the optimization process is assumed to have converged, and the optimum plan is assumed to have been achieved.
• Many of the current optimization systems use variations of the gradient techniques to optimize IMRT plans. These calculations are prodigious given the thousands of free parameters in variation—it was only with the advent of powerful and affordable computers that such calculations could become realizable in clinics. Direct aperture optimization has been proposed as an alternative, which reduces the parameter space and eliminates nonphysical dose distributions at the start; for a review see Broderick.105 The use of the gradient techniques assumes that there is a single extremum (a minimum or a maximum, depending on the form of the objective function). This is indeed the case for objective functions based on variance of dose and when only ray weights are optimized. For other cases, it would be necessary to determine whether multiple extrema exist and whether such multiple extrema have an impact on the quality of the solution found.
• Multiple extrema have been found to exist when beam directions are optimized or when dose–response-based objective functions are used to optimize weights of uniform beams.55,99,100 One can expect that multiple minima also exist when dose–response-based objective functions are used to optimize IMRT plans. Using simple schematic examples, it has also been shown that multiple minima exist when dose–volume-based objectives are used.106 Although this may be the case in theory, the existence of multiple minima has not been found to be a serious impediment in dose–volume-based or dose–response-based optimization using the gradient techniques. In fact, in a study of dose–volume-based IMRT optimization, Wu and Mohan107 found that, starting from vastly different initial intensities, the solutions converged to nearly the same plans. The reasons for this have been speculated but not conclusively proven and need to be investigated further.
• It is possible that multiple minima do become a factor under a specific set of circumstances. If multiple minima are discovered to be a factor, then some form of a stochastic optimization technique may need to be considered. At the simplest, one may use a random search technique in conjunction with one of the gradient techniques.
• A more sophisticated stochastic technique is “simulated annealing” or its variation, the “fast simulated annealing.”10,44,55,100 These techniques allow the optimization process to escape from the local minima traps. Other forms of stochastic approaches, such as “genetic algorithms,” also have been proposed.108 In principle, the simulated annealing technique and other stochastic approaches can find the global minimum, but, practically, there is no guarantee that the absolute optimum has been found, only that the best among the solutions examined has been found. (This, of course, is true for gradient techniques as well.) Stochastic techniques tend to be extremely slow and should be used in routine work only if it is established that they are necessary. Nevertheless, some commercial systems have implemented the simulated annealing approach for IMRT optimization.5
• Also, as noted above, rapid advances in parallel processing using off-the-shelf components can dramatically reduce computation times.102 In 2005, Xu and Mueller reported an order of magnitude decrease in the time to process a CT image on a PC when equipped with a dedicated graphics board.109
3.3. Objective Functions
3.3.1. Dose-Based Objective Functions
•
Related posts:


Stay updated, free articles. Join our Telegram channel

Full access? Get Clinical Tree


