66 and 255  76, for endocardium and epicardium, respectively.

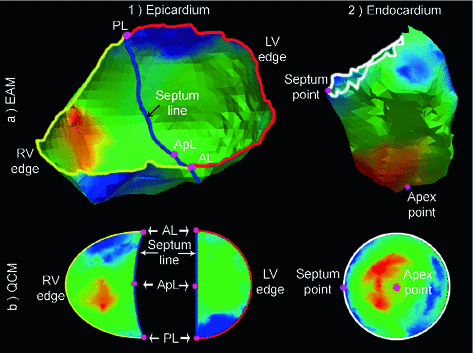
Fig. 1.
(1) Epicardial EAM and reference 2D space. Septum line, anterior, (AL), apical (ApL) and posterior (PL) landmarks, respectively. (2) Endocardial EAM and reference 2D space.
3 Methods
We introduce a two-step approach to jointly analyze different EAMs looking for relations between the status of the heart, electrical dyssynchrony and CRT leads position. First, we construct a common reference 2D frame using a quasi-conformal mapping. This has the advantage of standardizing both endo- and epi-cardial anatomies, thus facilitating the interpretation of corresponding EAMs. Then, we develop a set of both local and global quantitative measures to study standardized EAM data.
3.1 Quasi-conformal Mapping of Endo- and Epi-cardial Walls
In [11] we developed a quasi-conformal mapping (QCM) technique that takes advantage of the existence of an homeomorphism between the LV endocardial surface and a 2D disk. It was used to construct a reference common space for analyzing LV endocardial EAMs from different subjects. Here, we extend this technique to also incorporate information about the epicardium, i.e. including the external wall of the left and right ventricles of the heart. As can be seen in Fig. 1, epicardial EAMs only provide information of the LV lateral wall and RV free wall. Thus data on the septal wall are missing.
Since, we want to compare endo- with epicardial walls, we should not map the epicardium to a disk as in the LV endocardium data. Instead, we map the LV epicardium to the right half of a 2D disk, respecting the 17 AHA segment definition, as shown in Fig. 1. For the RV epicardium, we present a half-moon shape reference space as previously defined in [13].
The QCM of both heart walls are then computed by forcing every vertex coordinate to have a vanishing Laplacian, as shown in [11]. For the epicardium we only need to set the landmarks that provide correspondences between the EAM data and the 2D reference space. First, we define the septum line that divides LV and RV over the epicardial EAM mesh. To do so, three landmarks are manually selected: one over the anterior edge (AL) of the mesh (Fig. 1): one over the posterior (PL) one; and finally one in an apical (ApL) position. Then, we define the septum line in the 3D EAM mesh as the geodesic line over the mesh that joins these landmarks. In the 2D reference space, the anterior landmark is placed at the (1,0) point and the posterior to the ( ) one (see top and bottom points, respectively, in Fig. 1). Then the septum line is defined as a geodesic line linking these two landmarks, being the LV free wall mapped onto the contour of half disk. Finally, a similar approach is used for the RV epicardial mapping disk. It has the advantage of preserving relative distances between the boundary points at the original 3D EAM mesh.
 ) one (see top and bottom points, respectively, in Fig. 1). Then the septum line is defined as a geodesic line linking these two landmarks, being the LV free wall mapped onto the contour of half disk. Finally, a similar approach is used for the RV epicardial mapping disk. It has the advantage of preserving relative distances between the boundary points at the original 3D EAM mesh.
3.2 Local and Global Quantitative Measures
EAMs provide rich information of electrical patterns of the heart, such as the time when every region of the heart is activated (LAT). Nevertheless EAMs are often analyzed globally by computing the total activation time (time difference between the start and end of activation). There is a need for more local measures of EAMs to better characterize the underlying electrical patterns with different therapy conditions. Here, we propose to derive indices from histograms of the isochrones in EAMs to better quantify electrical dyssynchrony of the endocardial LV free wall and the epicardium of both ventricles, as well as getting insights into the transmurality of the activation. Such indices are then compared to total activation times and to an apicality index representing lead position.
Total Activation Times (TATs). Since EAM data from both endo- and epi-cardial walls are already mapped onto the common reference space, it is straightforward to compute regional total activation times (for the LV, for the RV, for both ventricles) and to derive some indices comparing TATs at different stages of the experimental model. Therefore we define the following TAT-derived indices: the delay induced by LBBB is captured as the difference of the TATs between LBBB and baseline ( ); the effect of the CRT therapy is quantified as the difference of the TAT between LBBB and CRT (
 ); and a recovery index expressing how close to the TAT after CRT is from its baseline value (
 ).
).

 ); the effect of the CRT therapy is quantified as the difference of the TAT between LBBB and CRT (
 ); and a recovery index expressing how close to the TAT after CRT is from its baseline value (
 ).
).
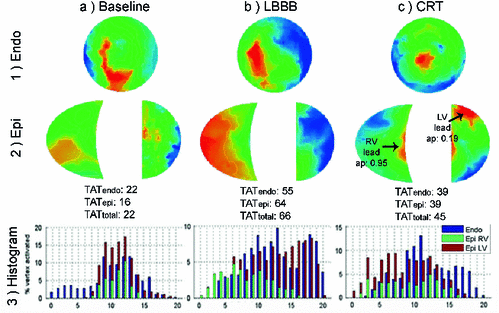
Fig. 2.
Single case (#2) from group 1 (basal LV lead  apical RV lead). Rows: QCM of endocardial and epicardial EAMs, and histogram of isochrones, at each stage.
 apical RV lead). Rows: QCM of endocardial and epicardial EAMs, and histogram of isochrones, at each stage.
Indices from Histograms of Isochrones. The isochrones are defined for each EAM as the set of points with LATs within a certain range of the total TAT. The analysis of these isochrones can help on the interpretation of electrical patterns by studying the percentages of activated areas at a given timepoint. LAT values were previously normalized between 0 and  of the total TAT. Ranges of
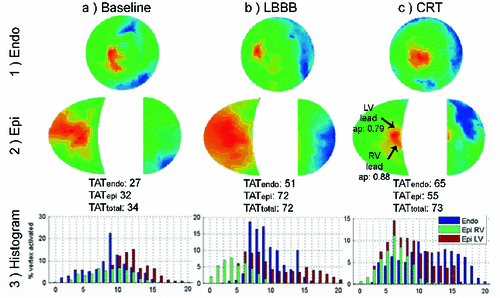
  are considered for the isochrones, corresponding to a total of 20 bins. An example of such histograms is shown in Figs. 2 and 3.
 of the total TAT. Ranges of
  are considered for the isochrones, corresponding to a total of 20 bins. An example of such histograms is shown in Figs. 2 and 3.
Apicality Index. For each lead, the apicality index is defined as:  , where r is the distance between the lead and the center of the disk in polar coordinates. Leads position are identified from the CRT activation map using the k-means algorithm [14]. This served to identify the centers of two distinguishable clouds of activation within the initial 10ms isochrones of the epicardium EAM, already mapped into the 2D common reference space. With this formulation, an apicality index closer to 1 or zero would mean an apical or basal lead, respectively.
 , where r is the distance between the lead and the center of the disk in polar coordinates. Leads position are identified from the CRT activation map using the k-means algorithm [14]. This served to identify the centers of two distinguishable clouds of activation within the initial 10ms isochrones of the epicardium EAM, already mapped into the 2D common reference space. With this formulation, an apicality index closer to 1 or zero would mean an apical or basal lead, respectively.


