Plaque imaging by MR imaging provides a wealth of information on the characteristics of individual plaque that may reveal vulnerability to rupture, likelihood of progression, or optimal treatment strategy. T1-weighted and T2-weighted images among other options reveal plaque morphology and composition. Dynamic contrast-enhanced–MR imaging reveals plaque activity. To extract this information, image processing tools are needed. Numerous approaches for analyzing such images have been developed, validated against histologic gold standards, and used in clinical studies. These efforts are summarized in this article.
Key points
- •
Quantitative analyses of atherosclerotic plaque are enabled by image processing.
- •
Analyses of traditional MR images (T1-weighted, T2-weighted, and so forth) yield measurements of plaque morphology and composition.
- •
Dynamic contrast-enhanced (DCE)–MR imaging and kinetic modeling can be used to assess plaque perfusion characteristics related to inflammation.
- •
Coupling these techniques with computational models reveals plaque biomechanical forces.
Introduction
In clinical practice, luminal stenosis measured from angiography is the most widely used parameter for risk prediction of atherosclerotic plaque. Together with the development of high-resolution multicontrast vessel wall MR imaging techniques, vessel wall features have drawn more attention in addition to luminal stenosis, including morphologic, compositional, physiologic, and hemodynamic features.
Morphologic features of atherosclerotic plaque usually quantified from multicontrast carotid MR imaging are mainly used to evaluate the plaque burden, including vessel wall thickness, area, volume, and some normalized indexes, such as the normalized wall index (NWI). Segmentation of the lumen and outer-wall boundaries from black-blood carotid MR images is the key to acquiring those quantitative morphologic features. Some automatic lumen/outer-wall boundary segmentation algorithms and how to measure those plaque burden features from the lumen/outer-wall boundaries are discussed.
Atherosclerotic plaque has complex contents. Researchers have found that components have different signals in different weightings in multicontrast carotid MR images, providing a unique opportunity to identify those components. Many studies have found that some compositional features detected by multicontrast MR imaging can be used for vulnerable plaque identification, such as the thin fibrous cap, large necrotic core, and intraplaque hemorrhage. Methods of segmenting the plaque components, including multicontrast image registration and pattern recognition–based composition detection methods, are discussed.
Recently, advances in carotid plaque MR imaging and analysis techniques have allowed researchers to evaluate atherosclerosis at the physiologic level. Physiologically, plaque vascularity and accumulations of macrophages are highly associated with plaque instability. To quantify the plaque angiogenesis and inflammation, DCE, an MR imaging technique, has been proposed and successfully validated. This article introduces the processing and modeling of DCE carotid plaque MR images.
Lastly, hemodynamic conditions are believed related to pathogenesis of atherosclerotic plaque. Methods of extracting hemodynamic features from carotid plaque MR imaging, including the wall shear stress (WSS) and tensile stress, are discussed.
Plaque burden
Plaque burden is a measure of atherosclerotic plaque size. Based on the imaging and processing protocol, plaque burden metrics can be 2-D cross-sectional vessel wall thickness, area, 3-D volume, and other metrics. No matter which plaque burden metric is chosen, precise segmentation of the inner and outer boundaries of the vessel wall is an essential step. Black-blood carotid plaque MR imaging can show the vessel wall clearly, allowing automatic segmentation. Segmentation methods are in 2 categories: 2-D–based segmentation and 3-D–based segmentation. The 2-D segmentation methods detect the boundaries in cross-sectional images, whereas the 3-D segmentation techniques segment the surface directly. After lumen and outer-wall boundaries are detected, a range of morphology metrics can be calculated.
For plaque burden assessment, the protocol should include: T1-weighted, 2-D or 3-D acquisitions, black-blood preparation, fat saturation, in-plane resolution less than 1 mm, slice thickness 2 mm or less.
2-D Boundary Detection
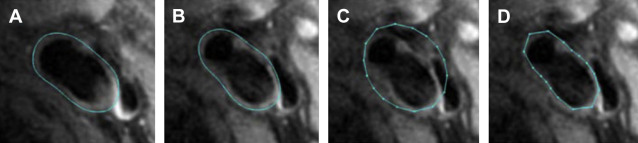
Detection of the lumen and outer-wall boundaries has been accomplished most often by placing contours on stacks of 2-D cross-sectional images. Active contour methods, such as B-spline snakes, are available that deform an initial contour estimate to match the boundary apparent in the image. For greater automation, techniques have been developed that propagate a contour from image to image. One such technique is the Markov shape model ( Fig. 1 ), in which the expected shape in the subsequent image is estimated based on the shape in the current image.
3-D Boundary Detection
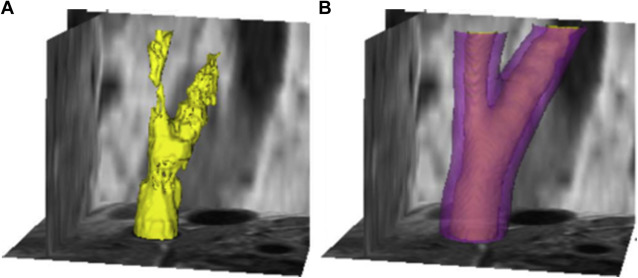
As imaging methods have advanced to allow black-blood preparation in isotropic 3-D images, a new approach to boundary detection has emerged in which the entire lumen or outer-wall volume is segmented as a whole, rather than as a series of parallel contours. One such approach uses graph-cuts global optimization ( Fig. 2 ) to simultaneously extract the lumen and vessel wall. Constraints ensure that the lumen is contained within the larger vessel wall volume.
Plaque Burden Quantification
After the lumen and outer-wall boundaries have been identified, plaque burden metrics, such as thickness, area, and volume, can be calculated.
Vessel wall thickness calculation
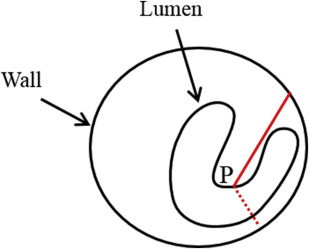
Because of the various shapes of the diseased carotid artery, thickness measurement is a challenge. The key to calculating thickness is to find the matching lines connecting corresponding points between the lumen and outer-wall contours. Such correspondence, however, cannot be easily defined in carotid artery with severe plaque. The intuitive matching method of shortest distance may generate wrong matching lines, such as lines that cross the lumen ( Fig. 3 ). Han and colleagues propose using the Delaunay triangulation technique to find the corresponding points, which can produce a stable result for various plaque shapes. Once the Delaunay triangulation is completed, the matching lines can be defined by the triangular midlines of all triangles.
Vessel wall area and volume
In addition to thickness, vessel wall area is a commonly used burden metric. The vessel wall area can be calculated by measuring the area enclosed by the outer-wall boundary minus the area enclosed by the lumen boundary. With known area, the plaque volume is calculated using the Simpson rule, which sums the areas of all images times the separation between images.
Normalized wall index
Although the absolute value of vessel wall area measurement can reflect the plaque burden, it does not account for the variance of carotid artery size in the population, which may introduce bias in clinical use. To solve this problem, a normalized metric has been proposed : the NWI, which normalized the plaque area by the vessel size. NWI is defined as the area of the vessel wall divided by the area of the lumen plus wall and ranges from approximately 0.4 for a normal artery to near 1.0 for a highly stenotic artery. In some cases, NWI is calculate in terms of wall and lumen volumes instead of areas.
Validation, Reproducibility, and Clinical Studies of the Morphologic Metrics
Yuan and colleagues have shown that the maximal wall area measurements from in vivo and ex vivo MR imaging strongly agree. In another study comparing in vivo and ex vivo plaque MR images, the correlation coefficients were found as high as 0.92 for wall volume measurement, 0.91 for maximum wall area measurement, and 0.90 for minimum lumen area measurement. In a histology validated study, the area measurements of wall can be correlated with histology ( r = 0.84; P <.001).
The interscan, interobserver, and intraobserver reproducibilities of vessel wall morphology measurements have been investigated. The interscan reproducibility of the mean wall thickness is high (intraclass correlation coefficient [ICC] = 97% and coefficient of variation [CV] = 3.87%), the maximum wall thickness has lower interscan reproducibility (ICC = 87% and CV = 14.79%), the NWI has good interscan reproducibility (ICC = 98% and CV = 3.02%), and the interscan reproducibilities are also high for wall volume (ICC = 94% and CV = 4.2%), lumen volume (ICC = 99% and CV = 2.6%), and total vessel volume (ICC = 97% and CV = 2.25%). In a study involving 4 scans, the measurement error was as low as 5.8% for wall volume and 3.2% for a volume-based NWI. Intraobserver and interobserver variability of maximum wall area is also excellent (ICC ranging from 0.90 to 0.98).
All the morphologic metrics of plaque have been widely used in clinical studies. Takaya and colleagues found that maximum wall thickness is associated with the subsequent cerebrovascular events (the hazard ratio for 1 mm increase is 1.6; P = .008) over a mean follow-up of 38.2 months. Saam and colleagues has found that the lumen area of symptomatic plaque tends smaller compared with asymptomatic plaque ( P = .008). Phan and colleagues find that the patients with low high-density lipoprotein cholesterol (≤35 mg/dL) have larger wall volume (97 ± 23 mm 3 ) than the patients whose high-density lipoprotein cholesterol levels are greater than 35 mg/dL (81 ± 19 mm 3 ). Morphologic metrics can also be used in longitudinal studies. Mean wall thickness and NWI have been used in therapeutic response study. Zhao and colleagues found that the treated patients had a smaller luminal area (55 mm 2 vs 44 mm 2 ) and plaque area (58 mm 2 vs 64 mm 2 ) compared with patients who did not receive the intensive lipid-lowering therapy. Takaya and colleagues found that intraplaque hemorrhage can stimulate the plaque progression based on wall volume increase (wall volume change in subjects with and without intraplaque hemorrhage is 6.8% vs −0.15% [ P = .009]).
What the Physician Needs to Know
- •
Several different measurements of plaque burden are used, including wall thickness, area, volume, and derived parameters, such as NWI.
- •
The key to all measurements of burden is accurate detection of lumen and outer-wall boundaries.
- •
Several tools are available to facilitate vessel boundary detection.
- •
Plaque burden measurements are accurate and reproducible.
Plaque components
In addition to plaque burden, the compositional characteristics of plaque are believed related the cerebral events. The major plaque components identified by multicontrast carotid MR imaging include necrotic/lipid core, intraplaque hemorrhage, calcification, loose matrix, and fibrous cap. The thin fibrous caps and large necrotic cores can cause plaque structural weakness. Calcified nodule impinging into the lumen lead to fragile thrombus. Strong correlations are found between intraplaque hemorrhage and cerebral events. Thus, it is important to quantify not only the morphologic features but also the compositional characteristics.
The principle for multicontrast MR imaging–based plaque component identification is that the intensity features from multiple magnetic resonance (MR) weightings can differentiate plaque components, whereas different compositions may show similar signals in a single-contrast weighting. Thus, the multiple MR weightings must be spatially aligned using registration technique before the component segmentation.
For plaque component assessment, the protocol should include: multicontrast weighted imaging (T1, T2, contrast-enhanced T1, and time-of-flight), 2-D or 3-D acquisitions, black-blood and bright-blood preparation, fat saturation, in-plane resolution less than 1 mm, and slice thickness 2 mm or less.
Multicontrast Image Registration
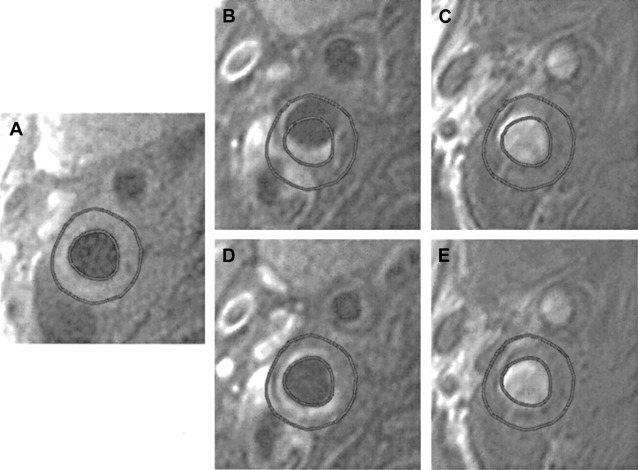
The misalignment among multicontrast carotid MR images caused by patient motion is a major challenge in component identification. Patient motion must be corrected to well under 1 mm, given the fine image resolution and presence of components that may be on the order of 1 mm in size. To solve the misalignment caused by rigid motion, the active edge map-based registration method has been proposed for multicontrast carotid MR images, which uses lumen and wall boundaries detected in 1 contrast weighting to optimally shift other contrast weightings ( Fig. 4 ).
Plaque Component Segmentation
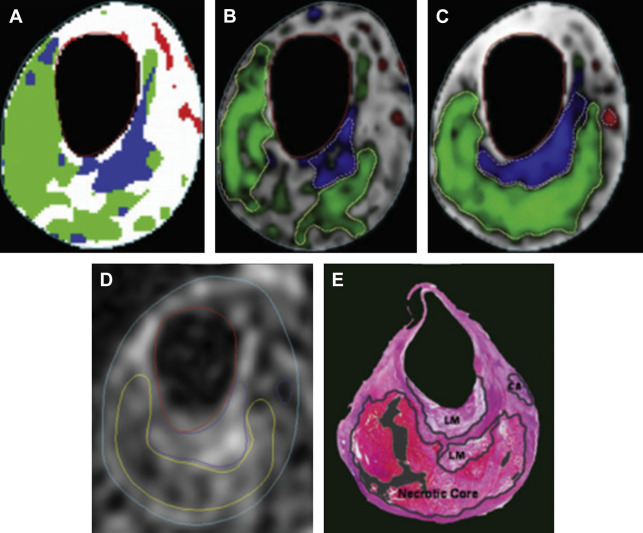
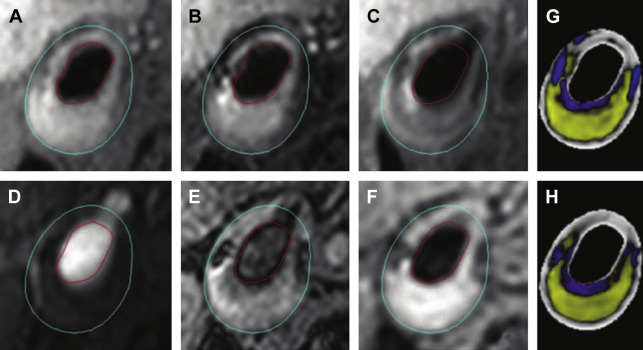
After the lumen/outer-wall segmentation and multicontrast images registration, trained experts have been able to identify different plaque components based on different intensities in multiple MR weightings. Numerous efforts have been made to automate this evaluation. Based on the observed, implicit use of local wall morphology (eg, thickness) that trained manual reviewers use to identify components, the most successful algorithms have also added morphologic features and improve the segmentation performance. The morphology-enhanced probabilistic plaque segmentation (MEPPS) algorithm is one of these methods ( Fig. 5 ). In addition to the 2-D sequences used in the original MEPPS development, Liu and colleagues further used the MEPPS algorithm on 3-D carotid MR images, showing similar results ( Fig. 6 ) compared with 2-D MEPPS algorithm.
Validation, Reproducibility, and Clinical Studies of Plaque Compositional Features
Quantification of plaque components has been validated primarily for manual analysis by expert image reviewers. For the identification of lipid-rich/necrotic core and intraplaque hemorrhage, the results from multicontrast MR imaging agree with the histologic findings, with κ = 0.69, overall sensitivity of 85%, and specificity of 92%. Compared with histologic results, MR imaging is able to distinguish juxtaluminal hemorrhage from intraplaque hemorrhage with an accuracy of 96%; sensitivity and specificity for identifying the appearance are 96% and 82%, respectively. In another histology validated study, the sensitivities and specificities of carotid MR imaging were 95% and 76% for lipid-rich/necrotic core, 84% and 91% for calcification, 87% and 84% for hemorrhage, and 79% and 77% for loose matrix, respectively. For characterization of the fibrous cap, the agreement of multicontrast MR imaging and histology can achieve κ = 0.83 and the Spearman correlation coefficient = 0.88, whereas sensitivity and specificity are 0.81 and 0.90 for the unstable fibrous cap detection, respectively.
Quantitatively, MR imaging measurements compare closely with histology when quantifying the area of lipid-rich/necrotic core (23.7% vs 20.3%), loose matrix (5.1% vs 6.3%), fibrous tissue (66.3% vs 64%), and calcification (9.4% vs 5%). Moderate to strong correlations between MR imaging and histology area measurements are found for lipid-rich/necrotic core ( r = 0.75; P <.001), calcification ( r = 0.74; P <.001), loose matrix ( r = 0.70; P <.001), and hemorrhage ( r = 0.66; P <.001). In another study with histologic validation, the mean percentage area of lipid-rich/necrotic core measured by MR imaging is also comparable with histology (30.1% vs 32.7%) and is highly correlated across locations ( r = 0.87; P <.001). For intact fibrous cap quantification, MR images show a moderate to good correlation in length ( r = 0.73; P <.001) and area ( r = 0.80; P <.001) compared with histology. The intrareader and inter-reader reproducibilities of area measurements was good to excellent for lipid-rich/necrotic core (ICC = 0.89 and 0.92 respectively), calcification (ICC = 0.9 and 0.95 respectively), hemorrhage (ICC = 0.74 and 0.73 respectively), loose matrix (ICC = 0.79 and 0.79 respectively). In a study with 4 scans, the measurement error of the volume is 11.1% for lipid-rich/necrotic core, and 18.6% for calcification.
Automated component segmentation algorithms have also been validated and compare favorably to manual review. The MEPPS algorithm segmentation and the histologic drawing are highly associated. Kerwin and colleagues tested the MEPPS on 1.5T and 3.0T MR images; the correlation coefficients of average area were 0.91 (lipid-rich core), 0.93 (intraplaque hemorrhage), 0.95 (calcification), and 0.93 (fibrous tissue).
The plaque compositional features from MR imaging are widely used in clinical studies. Saam and colleagues found that the symptomatic plaques had a higher incidence of fibrous cap rupture ( P = .007) and juxtaluminal hemorrhage or thrombus ( P = .039) compared with asymptomatic plaques. By comparing patients with and without the subsequent symptoms, Takaya and colleagues found that presence of a thin or ruptured fibrous cap has a hazard ratio of 17.0 ( P ≤.001); intraplaque hemorrhage has a hazard ratio of 5.2 ( P = .005). Yuan and colleagues found that the ruptured fibrous cap is highly associated with a recent history of transient ischemic attack or stroke. In longitudinal studies, Zhao and colleagues found a decreased lipid content can be observed by MR imaging in patients receiving intensive lipid-lowering therapy. In another 2-year study of rosuvastatin therapy using the MEPPS algorithm, the mean area proportion of the vessel wall composed of lipid-rich/necrotic core decreased by 41.4% ( P = .005).
What the Physician Needs to Know
- •
Effective differentiation of plaque components requires a combination of information from multiple contrast weightings.
- •
Several tools are available to facilitate plaque component segmentation.
- •
Image alignment is a necessary step for automated component segmentation.
- •
Plaque component measurements are reproducible and accurate.
Plaque activity
A third aspect of atherosclerotic plaque vulnerability is inflammation, which is often associated with angiogenesis and referred to as plaque activity . The accumulations of macrophages have been demonstrated to be associated with plaque instability. Plaque vascularity is also a key feature of symptomatic carotid atherosclerosis.
DCE–MR imaging provides an opportunity to quantify plaque inflammation and angiogenesis by using gadolinium contrast agents together with pharmacokinetic modeling. DCE–MR imaging of the vessel wall is difficult to analyze because the vessel wall is a moving and small imaging target.
For plaque activity assessment, the protocol should include: DCE imaging, 2-D acquisition, fat saturation, in-plane resolution less than 1 mm, slice thickness 3 mm or less, imaging rate 15 seconds per frame or less, and total imaging time at least 2 minutes.
Related posts:
 Three-Dimensional Carotid Plaque MR Imaging
Incorporating Carotid Plaque Imaging into Routine Clinical Carotid Magnetic Resonance Angiography
FDG PET/CT Imaging of Carotid Atherosclerosis
Plaque Assessment in the Management of Patients with Asymptomatic Carotid Stenosis
Clinical Perspective of Carotid Plaque Imaging
Three-Dimensional Carotid Plaque MR Imaging
Incorporating Carotid Plaque Imaging into Routine Clinical Carotid Magnetic Resonance Angiography
FDG PET/CT Imaging of Carotid Atherosclerosis
Plaque Assessment in the Management of Patients with Asymptomatic Carotid Stenosis
Clinical Perspective of Carotid Plaque Imaging
 Plaque Imaging to Decide on Optimal Treatment
Stay updated, free articles. Join our Telegram channel

Full access? Get Clinical Tree


