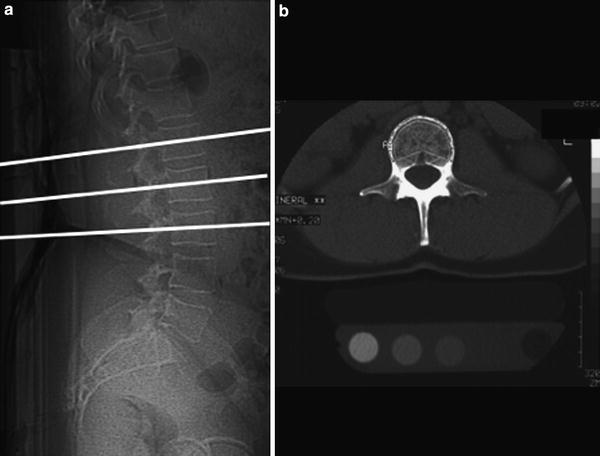
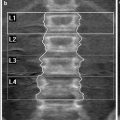
Fig. 2
Lateral digital radiogram (scout view) (a) shows mid-vertebral positions of the sections in L1-3, which are used to measure single slice QCT BMD. In (b) a mid-vertebral image of L2 demonstrates a “Pacman” or peeled region of interest (ROI) used to measure trabecular and “cortical” BMD (b). The cortical BMD measurement is an approximate measurement as the cortex of the vertebral body is below the spatial resolution of the axial CT image and subjected to partial volume effects
Thorough quality control is critical to acquire meaningful BMD QCT data and should be performed according to the Guidelines of the International Society of Clinical Densitometry as published by Engelke et al. (2008). This includes the following: (1) In vivo precision of new QCT techniques must be established. However, due to radiation considerations, it is not recommended to reconfirm in vivo precision for each clinical facility. Instead, precision of acquisition should be established with phantom data; analysis precision should be established by reanalysis of patient data. (2) The scanner stability should be controlled longitudinally by scanning a quality assurance (QA) phantom at least once a week whenever patients are to be scanned. (3) The scan protocol must be kept constant for all visits of an individual patient.
Currently, 2-D resp. single slice and 3-D resp. volumetric measurements are used for QCT. While the 2-D measurement is only used for the lumbar spine 3-D measurements may also be performed at the proximal femur.
2.1 Single Slice QCT
Single Slice QCT has been established for BMD measurements at the lumbar spine; using the standard technique single sections of the first to third lumbar vertebrae are scanned. Typically, slice thicknesses are in the order of 8–10 mm, the mid-vertebral portion is examined and a dedicated gantry tilt is used (Fig. 2a). Single mid-vertebral slice positions of L1-3 parallel to the vertebral endplates are selected in the lateral digital radiograph resp. scout view (Fig. 2b). An automated software, selecting the mid-vertebral planes may be useful to reduce the precision error (Kalender et al. 1988).
Low energy protocols in the order of 80 kVp (or 120 kVp) and 120 mAs (or 150–200 mAs) result in effective doses of <200 microSv (Engelke et al. 2008). Felsenberg et al. described a low energy, low dose protocol with 80 kVp, and 146 mAs resulting in effective doses down to 50–60 μSv, including the digital radiograph (Felsenberg and Gowin 1999). Bone marrow fat increases with age and may falsely decrease BMD. Thus, the actual BMD may be underestimated by 15–20 %. Due to age-matched data bases, however, the clinical relevance of this fat error is small (Glüer and Genant 1989). A dual energy QCT technique was described to reduce the fat error. However, since this technique has an increased radiation exposure and a decreased precision, its use was limited to research purposes (Genant and Boyd 1977; Felsenberg and Gowin 1999).
A number of different region of interest (ROI) shapes and techniques have been used to determine the BMD in the axial sections of the vertebral bodies. Manually, placed elliptical ROIs and automated image evaluation with elliptical and peeled or “Pacman” ROIs (Fig. 3) have been described (Kalender et al. 1987; Steiger et al. 1990). The ROI developed by Kalender et al. uses an automatic contour tracking of the cortical shell to determine a ROI analyzing trabecular and cortical (as visualized by CT) BMD separately (Kalender et al. 1987). The use of an automated ROI improves the precision of BMD measurements (Sandor et al. 1985; Kalender et al. 1987). Steiger et al. have shown that elliptical and peeled ROIs yield similar results and have a very high correlation (r = 0.99) (Steiger et al. 1990).
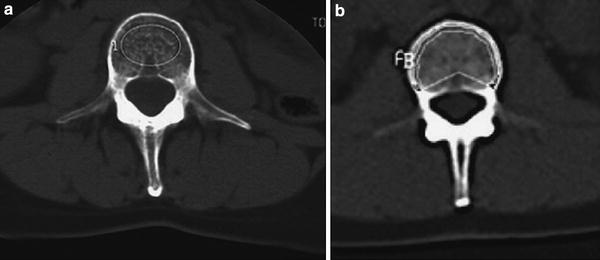
Fig. 3
ROIs used for BMD measurements include manually (a) or automatically placed (b) regions, which may be either oval shaped (a) or peeled (“Pacman” shaped ROI) (b)
Measurements should not be performed in fractured or deformed vertebral bodies and great care should be taken to avoid performing QCT after intravenous contrast application (e.g., after a standard contrast-enhanced CT). Also it is critical to analyze all images including the scout images for abnormalities in the bone and soft tissue windows. Vertebral fractures (scout images) and soft tissue abnormalities such as renal tumors or abnormally enlarged lymph nodes must not be missed as they may have an impact on patient management or may have legal consequences.
BMD-data obtained by QCT are compared to an age-, sex-, and race-matched database (Block et al. 1989; Kalender et al. 1989). T-scores used for the assessment of osteoporosis according to the WHO definition have been established for DXA but not for QCT, though they may be given by the software of the manufacturers. If these T-scores are used to diagnose osteoporosis, a substantially higher number of individuals compared to DXA will be diagnosed as osteoporotic, since BMD measured with QCT shows a faster decrease with age than DXA. In order to facilitate the interpretation of QCT results, the American College of Radiology has in 2008 published guidelines for the performance of QCT; based on these guidelines BMD values from 120 to 80 mg/ml are defined as osteopenic and BMD values below 80 mg/ml as osteoporotic, which would correspond to a T-score of approximately −3.0.
A substantial disadvantage of 2-D QCT is its lower precision compared to that of DXA (1.5–4 vs. 1 %), which results in a larger least significant change required to detect significant changes in BMD (6–11 vs. 3 %). However, since the metabolic activity of trabecular bone is higher, a lower precision is adequate for single slice QCT to monitor longitudinal changes that are in the same range as those found with DXA.
2.2 Volumetric QCT
With spiral and multislice CT acquisition of larger bone volumes, such as entire vertebrae and the proximal femur, is feasible within a few seconds (<10 s). These data sets can be used to obtain 3-D-images, which provide geometrical and volumetric density information (Fig. 4). As an alternative to volumetric QCT (vQCT) the term three dimensional (3-D) QCT may be used. Contiguous sections with a slice thickness of 1–3 mm and no CT scanner angulation are typically obtained. The lumbar spine protocols typically only include L1 and L2, as the exposure dose is relatively high. Typically, kVp is in the order of 80–120 and mAs between 100 and 200. Using these parameters, the exposure dose has been estimated to be as high as 1.5 mSv for the spine, and 2.5–3 mSv for the hip (Engelke et al. 2008). The primary advantage of volumetric QCT of the spine is an improved precision for trabecular BMD measurements, which is in the order of 1–2.5 % (Engelke et al. 2008). Different analysis techniques have been applied to quantify BMD in the volumetric ROIs; in addition to the standard midvertebral trabecular volume of interest (VOI) that in size and location is similar to the volume analyzed in single slice mode, various additional VOI can be measured by 3-D QCT. However, to date there is no agreement on the locations, sizes, or shapes of VOIs (Engelke et al. 2008). Currently, two manufacturers offer volumetric QCT software with calibration phantoms (QCT Pro, Mindways Software, Inc., Austin, TX and Image Analysis Inc., Columbia, KY).
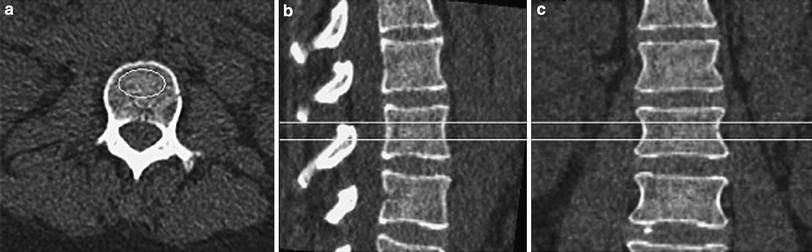
Fig. 4
Volumetric or 3-D QCT of the lumbar spine demonstrating an axial CT image of L2 (a) as well as sagittally (b) and coronally (c) reconstructed images indicating the volume of interest used for the volumetric BMD measurement
Because of the complex anatomy of the proximal femur, single slice QCT is not feasible but volumetric approaches have been found to have good reproducibility. The scan region typically starts 1–2 cm above the femoral head and extends a few centimeters below the lesser trochanter. Typically, kVp is in the order of 120 and mAs between 100 and 330 (Engelke et al. 2008). Algorithms to process volumetric CT images of the proximal femur and to measure BMD in the femoral neck, the total femur, and the trochanteric regions are available and include two commercial and a few advanced university-based research tools (Lang et al. 1997). Proximal femur 3-D QCT has a high precision of 0.6–1.1 % for trabecular bone and may also be used to determine geometric measures such as the cross-sectional area of the femur neck and the hip axis length. These measurements may be useful in optimizing fracture prediction of the proximal femur.
While WHO criteria are not applicable to volumetric QCT measurements of the lumbar spine, it should be noted that the American College of Radiology guidelines for the performance of QCT for single slice QCT are also applicable to volumetric QCT: BMD values of 120–80 mg/ml are defined as osteopenic and below 80 mg/ml as osteoporotic. One of the manufacturers also provides BMD ranges to quantify increase in fracture risk: a BMD of 110–80 mg/cc is described to indicate a mild increase in fracture risk, BMD values of 50–80 mg/cc indicate a moderate increase in fracture risk and a BMD lower than 50 mg/cc indicates a severe increase in fracture risk.
For the proximal femur, 3-D datasets may be used to derive a projectional 2-D image of the proximal femur and in this image standard DXA-equivalent ROIs may be placed (Fig. 5). This so-called QCT-derived DXA equivalent aBMD (QCT(DXA) aBMD) can be calculated using CTXA Hip software (Mindways Software Inc., Austin, TX, USA). In the ROIs, BMD values are determined in g/cm2. Since the correlations between these calculated BMD values of the proximal femur and those obtained by DXA are extremely high, the WHO classification may be applied to those BMD values in post-menopausal women (Khoo et al. 2009). Thus, a T-score ≤2.5 derived from those datasets indicates osteoporotic BMD.
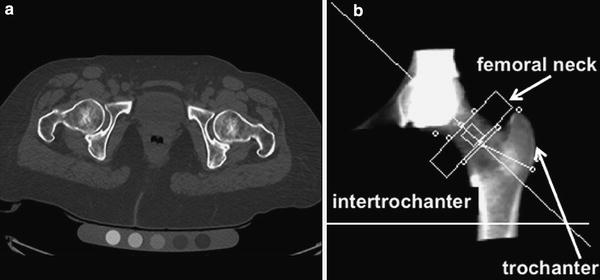
Fig. 5
Volumetric QCT of the hip: axial CT image of bilateral hip joints on a Mindways calibration phantom (a) and DXA like, 2-D, reconstructed CT image with femoral neck (small arrow), trochanteric (long arrow), and intertrochanteric ROIs (b)
2.3 Advantages and Disadvantages of Axial QCT versus DXA
In addition to the true volumetric measurements, QCT has several important advantages over DXA. As DXA is a projectional technique, structures overlying the vertebral body and proximal femur will impact and limit the measurements. Thus, aortic and femoral artery calcifications will artificially increase BMD measurements, as will degenerative disc disease, diffuse idiopathic skeletal hyperostosis (DISH), and facet arthropathy. In addition surgical clips, contrast within the bowel and status post spine surgery (in particular laminectomies) will alter BMD measurements. All of this will have less impact on QCT measurements. A recent study comparing DXA and QCT in older men with DISH demonstrated that QCT was better suited to differentiate men with and without vertebral fractures (Diederichs et al. 2011); DISH is a condition which is frequently found in older individuals and a higher number of vertebral fragility fractures were shown in these individuals.
In addition, QCT provides purely trabecular bone measurements which are more sensitive to monitoring changes with disease and therapy. In a randomized, double-blind clinical study of parathyroid hormone and alendronate to test the hypothesis that the concurrent administration of the two agents would increase bone density more than the use of either one alone, Black et al. found that changes in BMD demonstrated with QCT in patients treated with PTH and alendronate were 2–3 times higher than those found with DXA (Black et al. 2003).
Cross-sectional studies have shown that QCT BMD of the spine allows better discrimination of individuals with and without fragility fractures (Yu et al. 1995; Bergot et al. 2001). Bergot et al. found significantly higher (p < 0.05) receiver operator characteristics analysis (ROC) values for QCT compared to DXA not only for vertebral fractures (0.85 versus 0.79), but also for peripheral fractures (0.72 versus 0.67) in 508 European women.
In addition, QCT is better suited for examining obese patients as DXA has limitations in measuring BMD in patients with a BMD over 25–30 kg/m²; in obese patients superimposed soft tissue will elevate measured BMD due to attenuation of the X-ray beams and beam hardening artifact as shown in previous studies (Tothill et al. 1997; Weigert and Cann 1999; Binkley et al. 2003).
However, a number of pertinent disadvantages of QCT also have to be considered. Most of all, the higher radiation dose (0.06–3 mSv) is of concern in particular in younger individuals (e.g., peri-menopausal women). Also, there are a limited number of longitudinal scientific studies assessing how QCT predicts fragility fractures and most of the pharmacological therapy studies have been performed using DXA. Another major problem with QCT is that T-scores should not be used to define osteoporosis and osteopenia. A T-score threshold of −2.5 for QCT would identify a much higher percentage of osteoporotic subjects, and has therefore never been established for clinical use. Currently, volumetric QCT techniques are state-of-the-art (Lang et al. 1999; Bousson et al. 2006; Farhat et al. 2006a, b) and in clinical routine absolute measurements of volumetric BMD to characterize fracture risk have been used (110–80 mg/cm3 = mild increase in fracture risk, 80–50 mg/cm3 = moderate increase in fracture risk and below 50 mg/cm3 = severe increase in fracture risk). Also, more importantly, according to the “American College of Radiology (ACR) Guidelines for QCT” a density range of 120–80 mg/cm3 is defined as osteopenic BMD and BMD values below 80 mg/cm3 as osteoporotic BMD (ACR Practice Guideline for the Performance of QCT Bone Densitometry; 2008) (Table 1).
Table 1
ACR guidelines for the performance of QCT, result interpretation
Density in mg Hydroxyapatite/ml | Definition |
|---|---|
>120 mg/ml | Normal |
120–80 mg/ml | Osteopenic |
<80 mg/ml | Osteoporotic |
Currently, DXA of the spine and proximal femur is the preferred imaging text for making therapeutic decisions, but if not available QCT may also be used (Engelke et al. 2008). According to expert opinion from Japan, the US, the United Kingdom, and Germany for Siemens QCT scanners, a treatment threshold for spinal trabecular BMD of 80 mg/cm3 without additional risk factors may be used (Engelke et al. 2008).
Concerning image interpretation, it should be noted that volumetric QCT takes substantially longer to report compared to DXA as the limited CT of the pelvis and abdomen may show a number of abnormalities of the internal organs, the spine, bony pelvis, and muscles, which should not be missed. Analysis of nonenhanced CT images is challenging, yet failure to report abnormalities such as kidney tumors and enlarged lymph nodes may have legal consequences (Fig. 6).
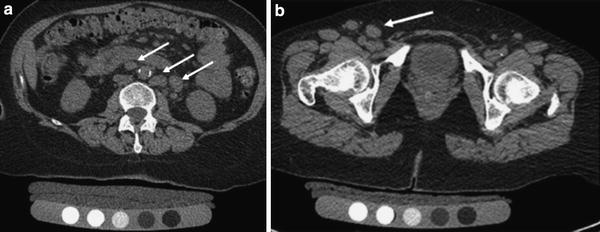
Fig. 6
Volumetric QCT of the spine and hip showing nonenhanced abdominal and pelvic source images. In the para-aortic region (a) and the right inguinal region (b) there are multiple large lymph nodes (arrows), which were an incidental finding. Further clinical work-up led to the diagnosis of Non-Hodgkin’s Lymphoma
2.4 Clinical Indications for Axial QCT
The most important clinical indications for QCT are outlined in Table 2. Recommendations for the use of QCT instead of DXA are (1) very small or large individuals (DXA may suggest abnormally low BMD in small individuals), (2) older individuals with expected advanced degenerative disease of the lumbar spine or morphological abnormalities (in particular men and individuals with DISH), (3) if high sensitivity to monitor metabolic bone change is required such as in patients treated with parathyroid hormone or corticosteroids. Also, QCT should be considered and (4) in obese subjects, as dual energy in DXA only incompletely removes error due to fat.
Table 2
Clinical Indications for volumetric QCT
Clinical indication for QCT | Rationale |
|---|---|
1. Very small or large patients | Volumetric measurement, not impacted by patient size such as DXA (projectional measurement) |
2. Advanced degenerative spine disease (degenerative disc disease, facet arthropathy, and DISH) | Only trabecular part of vertebral body is measured and osteophytes have limited impact on measurement |
3. Obese subjects (BMI > 30) | DXA incompletely removes soft tissue |
4. If high sensitivity to monitor metabolic bone change is required | Trabecular is metabolically more active |
2.5 Advanced QCT Technologies and Applications
Standard BMD measurements have limitations in assessing fracture risk; in the 2000 NIH consensus conference, the expert panel agreed to not only include BMD as a test to diagnose fracture risk, but also include measures of bone quality (NIH Consensus Development Panel on Osteoporosis Prevention 2001). Bone quality includes bone architecture, micro- and macrostructure and researchers have subsequently developed technologies to characterize bone quality. In addition to high-resolution peripheral QCT (HR-pQCT), multidetector CT (MD-CT) was investigated to image bone structure as it can be used in clinical practice and has superior spatial resolution compared to previous spiral CT scanners. For imaging of trabecular bone structure; however, spatial resolution is still limited given a minimum slice thickness in the order of 0.6 mm with minimum in plane spatial resolution of approximately 0.25–0.3 mm2 (Link et al. 2003). Using this spatial resolution, imaging of individual trabeculae (measuring approximately 0.05–0.2 mm in diameter) is subject to significant partial volume effects; however, it has been shown that trabecular bone parameters obtained from this technique correlate with those determined in contact radiographs from histological bone sections and μCT (Issever et al. 2002; Link et al. 2003).
An advantage of MD-CT compared to HR-pQCT is access to central regions of the skeleton such as the spine and proximal femur, sites at risk for fragility fractures, where monitoring of therapy may be most efficient. However, in order to achieve adequate spatial resolution and image quality, the required radiation exposure is substantial, which offsets the technique’s applicability in clinical routine and scientific studies (Graeff et al. 2007; Damilakis et al. 2010). High-resolution MD-CT requires considerably higher radiation doses compared with standard techniques for measuring BMD. Compared with the 0.001–0.05 mSv effective dose associated with DXA in adult patients and 0.06–0.3 mSv delivered through 2-D QCT of the lumbar spine, protocols used to examine vertebral microstructure with high-resolution MD-CT provide an effective dose of approximately 3 mSv (Ito et al. 2005; Graeff et al. 2007).
Related posts:

Stay updated, free articles. Join our Telegram channel

Full access? Get Clinical Tree


