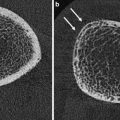
Fig. 1
From birth, red marrow converts to fatty marrow from the periphery to the central skeleton. Superimposed on this centripedal pattern, red marrow converts to fatty marrow in the tubular bones proceeding from diaphysis to metaphysis until by the age of 20 years only the proximal metaphyseal area contains appreciable red marrow
Red and yellow marrow areas are not composed purely of either non-fatty cells or fat cells, respectively. ‘Red marrow’ typically contains about 60 % haematopoetic cells and about 40 % fat cells (Fig. 2a, b) while ‘fatty marrow’ contains about 5 % haematopoetic cells and about 95 % adipocytes (Hwang and Panicek 2007; Steiner et al. 1993). In other words, ‘fatty marrow’ tends to be more ‘pure’ than haematopoetic marrow. Fat cells (adipocytes) as expected contain more lipid than haematopoetic cells while haematopoetic cells contain slightly more water and protein than adipocytes. The approximate chemical composition of fatty marrow is about 80 % lipid, 15 % water and 5 % protein while that of red marrow is about 50 % lipid, 35 % water and 15 % protein (Hwang and Panicek 2007; Steiner et al. 1993) (Fig. 3). This is relevant since quantification techniques such as MR spectroscopy (MRS) use the fat: water ratio to determine the % marrow fat fraction [also referred to as marrow fat content (%)].
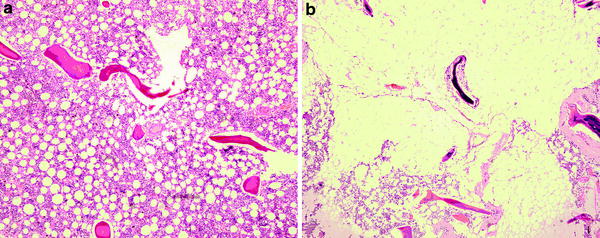
Fig. 2
a Histology of predominantly red marrow. There is still quite an abundance of fat cells present. b Histology of predominantly fatty marrow. There are only a few red cells present. In other words fatty marrow is more fatty than red marrow is red
Fig. 3
Chemical composition of red marrow and fatty marrow. Haematopoetic marrow contains more water than fatty marrow
The pH of the marrow cavity is not known though the pH of extravascular tissues is generally lower than that of arterial blood (pH 7.4) and venous blood (pH 7.36) (Arnett 2010). The oxygen tension of normal bone marrow is about 52 mmHg (6.6 %) which is lower than that of arterial blood (95 mmHg, ~12 %) and higher than that of veno-capillary blood (40 mmHg, ~5 %) (Arnett 2010). In normal tissues other than the bone marrow, median interstitial oxygen tension levels measure ~3–9 % (Arnett 2010).
The marrow cavity is supplied by large nutrient arteries that pass through the cortex into the medullary canal (Travlos 2006). Ascending and descending nutrient branches give rise to small thin-walled arterioles that extend towards the periphery where they give rise to capillaries piercing the bone cortex and also merge with thin venous sinuses lined by flat endothelial cells. These endothelial cells lack a tight junction though may overlap or interdigitate facilitating two-way passage of haematopoetic cells (Travlos 2006; Lichtman 1981; Brookes 1974). The venous system drains via collecting venules back to the nutrient or emissary veins. This arrangement of vessel from central to peripheral, leads to a higher number of vascular channels and slower flow at the periphery of the marrow cavity. The thin (50–150 μm) trabeculae do not possess a Haversian system or capillary system though do, similar to cortical bone, posses a fine canalicular network linking embedded osteocytes to the bone surface. The cortex receives its blood flow from capillaries piercing its endosteal and periosteal surfaces and running within the Haversian system. As a rough guide, the outer one-third of the cortex is supplied by the periosteal arteries while the inner two-thirds of the cortex and the constituents of the marrow cavity are supplied by the nutrient arteries. Absolute bone blood flow in humans is not easy to measure though has been estimated to be approximately 11 % of cardiac output or 7 ml/min/100 g in humans (Brookes 1974; Van Dyke et al. 1971). More recently, in a study of ten young patients, lower vertebral body blood flow measured by PET and a 15O-labelled CO2 steady-state technique was deemed to be approximately 15 ml/min/100 g bone marrow (Kahn et al. 1994).
3 Links Between the Bone Marrow to Bone Metabolism
There are many tens of ways in which bone marrow properties may affect bone metabolism. From the imaging perspective, these following seem to be the most relevant.
(1)
There exists in the bone marrow, pluripotent mesenchymal stem cells that have the potential to differentiate along osteoblastic, adipocytic and haematological cell lines (Gimble and Nuttall 2004). Reduction in estrogen and oxidative stress may cause a drift in mesenchymal stem cell differentiation towards adipocytosis and away from osteoblastogenesis or haematopoesis (D’Ippolito et al. 2006; Fatokun et al. 2006; Shouhed et al. 2005; Kha et al. 2004; Duque 2008; Rosen and Klibanski 2009). Also adipocytes once formed are potentially self promotive whilst simultaneously actively suppressing osteoblastogenesis (Gimble and Nuttall 2004; Duque 2008; Lecka-Czernik et al. 2002).
(2)
Bone receives much of its signalling from the bone marrow and the most metabolically active bone areas are those in immediate contact with the bone marrow. The most metabolically active component of bone is the endosteal surface of the cortex with trabeculae bone being the next most metabolically active area (Parfitt 2002). The active unit of bone metabolism, i.e. the basic multicellular unit also lies in close contact with the marrow. Bone metabolism is possibly influenced by changes in the marrow microenvironment. For example, decreased Ph and deceased oxygenation will increase osteoclast formation and activity (Arnett 2010).
(3)
Mechano conduction and mechano sensation are terms which embody the principle of bone metabolism being influenced by interstitial fluid flow along osteocytes. Reduced bone blood flow will lead to reduced interstitial fluid flow and reduced shear stresses between osteocytes (Letechipia et al. 2010; Cowin 2002; McCarthy 2005, 2011). These shear stresses stimulate local release of bone remodelling mediators such as NO and PGI2 with the functionally important bone remodelling units and may be related to the rapid loss on bone (and muscle) mass seen microgravity. Osteocytes also produce VEGF which may stimulate bone perfusion.
(4)
Good perfusion is a pre-requisite for fracture healing and most bone perfusion comes from the marrow. In contrast, compromised perfusion may aggravate microfracture accumulation which is an integral part of insufficiency fracture development.
(5)
Long chain polyunsaturated fatty acids, or a change in the n − 6/n − 3 ratio, can affect bone metabolism. For example, long chain n − 6 fatty acids such as arachidonic acid and its metabolite prostaglandin PGE2 are pro-inflammatory with PGE2 being a potent stimulator of RANKL expression. This can reduce the OPG/RANKL ratio and may increase osteoclastogenesis (Coetzee et al. 2007). Alternatively, long chain n − 3 fatty acids such as eicosapentaenoic acid, docosahexaenoic acid and γ-linolenic have anti-inflammatory activity and may inhibit this PGE2-stimulated increase in RANKL expression (Poulsen et al. 2008). In other words, a change in the fatty acid milieu of bone may affect bone metabolism.
(6)
Bone and vasculature metabolism are so closely connected that, at a molecular level, there exists well over a hundred potential mechanisms whereby arteries can interact with bone and vice versa (Demer and Tintut 2009; Hamerman 2005). Broadly speaking, an arterial disorder may be affecting bone; a bone disorder may be affecting arteries or both tissues may be influenced by common extraneous factor or factors. For example, endothelial dysfunction itself has a potent downstream effect on bone metabolism by decreasing local production of nitric oxide and prostaglandin E2 (PGE2) (both of which stimulate osteoblasts and inhibit osteoclasts), decreasing production of PGI2 (which inhibits osteoclasts) and decreasing production of the bone matrix protein osteopontin (Bloomfield et al. 2002). In other words, endothelial dysfunction may, through local mediators, reduce osteoblastic and increase osteoclastic activity (Bloomfield et al. 2002; Wimalawansa 2010).
The remaining part of this chapter will address functional imaging techniques used to assess changes in the bone marrow, will look at what is known about lifelong changes in marrow fat, perfusion and diffusion and will look at how these processes are greatly affected in osteoporosis.
4 Bone Marrow Fat
4.1 Measurement of Marrow Fat
Proton MRS is the most widely used method to quantitatively assess marrow fat. MRS uses the fat: water ratio to determine the fat content (Figs. 4, 5). An obvious limitation is that a constant water content (%) is assumed. In other words, fat: water ratios may change due to a change in water content rather than fat content. MRS requires a minimal volume of approximately 1 cm2 to acquire a sufficient signal to noise ratio. Other non-spectroscopic yet precise methods of quantifying fat fraction are available such as the two-point Dixon method which involves sequential suppression or fat and water, the three-point Iterative Decomposition of water and fat with Echo Asymmetry and Least-squares estimation (IDEAL) (Gerdes et al. 2007), or the analogous Gradient-Echo Sampling of the Free Induction Decay and Echo method (Wehrli et al. 2000). The accuracy of MRI spectroscopic and non-spectroscopic methods in detecting the relative amounts of water and fat has been tested against 11 different emulsions of increasing fat content. This study confirmed a high correlation (r 2 > 0.92) between MR methods of fat quantification and the % fat volume fraction within test bottles (Bernard et al. 2008). Also, reproducibility of proton MRS in a clinical setting is high, ranging from 0.78 to 0.85, with the highest reproducibility being in those areas with the highest inherent fat content, i.e. the femoral head and lowest in the femoral neck (Griffith et al. 2009).
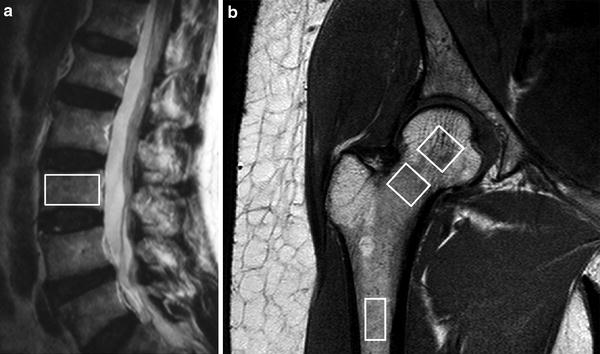
Fig. 4
1H MR spectroscopy examination. a Sagittal T2-weighted MR image showing positioning of volume of interest (VOI) for proton spectroscopy of L3 vertebral body. b Coronal oblique T1-weighted image of proximal femur showing VOI’s used to measure fat content (%) in the femoral head, neck, and shaft
Fig. 5
Typical 1H MR spectra in a normal subject with little marrow fat and b osteoporotic subject with a large amount of marrow fat
4.2 Physiological Changes in Bone Marrow Fat Content
An inverse relationship between increasing marrow fat and trabecular bone loss in senile osteoporosis has been recognised histologically for 40 years (Dunnill et al. 1967). However, it is only recently, though MRS and other MR-based techniques that marrow fat content can be quantified non-invasively on a large scale (De Bisschop et al. 1993; Schellinger et al. 2000; Kugel et al. 2001; Jung et al. 2000; Wehrli et al. 2000; Shih et al. 2004; Chen and Shih 2006; Liney et al. 2007) and at different anatomical sites (Duda et al. 1995) There is a gradual physiological increase in percentage marrow fat content with advancing years (Kugel et al. 2001; Griffith et al. 2012). An easy approximation to remember is that vertebral body marrow fat content is 25 % at 25 years and 65 % at 65 years of age (Kugel et al. 2001; Griffith et al. 2012).
There is also a distinct sex difference does exist in marrow fat content (Kugel et al. 2001; Griffith et al. 2012). Young males have about 10 % more fat in their marrow than females of equivalent age up to about 50 years of age (Kugel et al. 2001). Males show a gradual steady increase in marrow fat content of 7 % per decade throughout life from young to old (Kugel et al. 2001; Griffith et al. 2012) (Table 1, Fig. 6). Females, in contrast, show a less steep increase in marrow fat of about 2–7 % up to 55 years and then a dramatic increase between the ages of 55 and 65 years (Kugel et al. 2001; Griffith et al. 2012) (Table 1, Fig. 6). By 60 years of age, healthy females tend to possess about 10 % more marrow fat in their vertebrae than males (Griffith et al. 2012) (Table 1, Fig. 6).
Table 1
Fat content of lumbar vertebral bone marrow (%) grouped according to age (years) and sex
Age | 10–20 | 21–30 | 31–40* | 41–50* | 51–60* | 61–70* | 71–80* | 81–90* |
Males (%) | 24.6 | 33.5 | 41.4 | 47.6 | 47.7 | 52.0 | 53.8 | 64.0 |
Females (%) | 23.5 | 27.5 | 29.7 | 37.0 | 41.8 | 64.2 | 64.7 | 73.2 |
The sharp rise in marrow fat content with the menopause may be due to a reduced haematopoietic requirement with cessation of menstruation. This may not, however,be the only cause given that menstrual blood loss is generally quite low (median of about 43 ml per menstrual cycle) (Gao et al. 1987). The sharp increase in marrow fat content in early post-menopausal females may be a more direct effect of estrogen deficiency influencing fat deposition (or stem-cell differentiation) both inside and outside the skeleton. In this respect, the increase in marrow fat content does tally with changes in female extra-skeletal fat distribution recognised to occur at this time.
Androgen and estrogen levels both decline in later years, though estrogen levels fall more sharply in menopausal females leading to a higher circulating androgen: estrogen ratio. This, and other factors, promotes greater intra-abdominal or visceral fat, i.e. an ‘android’ pattern of fat deposition in post-menopausal females (Toth et al. 2000; Blouin et al. 2008). This is different to the gynoid-pattern of fat distribution seen in pre-menopausal women when fat accumulates in the gluteal and thigh areas (Toth et al. 2000; Blouin et al. 2008). Whilst there is no specific literature available on the relationship between estrogen and marrow fat content, it is known that visceral fat content (i.e. an android pattern of fat distribution) does correlate positively with marrow fat content (Bredella et al. 2011). It is feasible, therefore, that the increased marrow fat content seen in females in the post-menopausal era may be the bone-equivalent of android fat deposition. Android fat deposition is also associated with increased risk of cardiovascular disease and metabolic syndrome (Bredella et al. 2011).
Similar findings are found using multivoxel chemical shift registration MR imaging to measure variation in the water fraction of the lumbar vertebral bone marrow with age and sex (Ishijima et al. 1996). The water fraction for males was 75 % for young males, decreased to about 50 % for middle-aged males and remained almost constant for later years (Table 2, Fig. 7) (Ishijima et al. 1996). Conversely, in females, the water fraction for young females remained fairly constant at around 70 % but decreases quite rapidly around the time of menopause such that it is lower than in males during later years (Table 2, Fig. 7) (Ishijima et al. 1996). This tallies with the previously noted lifelong changes in % fat content since fatty marrow contains much less water (~5 %) than red marrow (~35 %) (Hwang and Panicek 2007).
Table 2
Water fraction of lumbar vertebral bone marrow (%) grouped according to age (years) and sex
Age | 5–14 | 15–24 | 25–34* | 35–44* | 45–54* | 55–64 | 65–74 | 75–84* |
Males | 75.2 | 69.0 | 53.7 | 51.1 | 52.9 | 48.8 | 48.1 | 48.2 |
Females | 78.9 | 75.0 | 69.3 | 70.9 | 61.1 | 49.7 | 46.0 | 39.7 |
Overall, there is at least a 40–50 % increase in fat cell content with increasing age. This increase in fat cell volume will occur at the expense of functioning marrow volume. Trabecular volume decreases by about one-third to one-half with increasing age, though the relative percentage of the marrow space occupied by trabecular bone is small. Since, the marrow cavity is a defined space and vascular sinusoids do not seem to expand with age, one can infer that an increase in marrow fat content is really a marker for a decrease in the amount of functioning marrow, i.e. a decrease in red marrow volume.
4.3 Changes in Marrow Fat Content in Osteoporosis
Over and above the physiological increase in marrow fat content with age, osteoporosis is associated with an even greater increase in marrow fat content. In the third lumbar vertebral body, for example, post-menopausal subjects with normal bone mineral density (BMD) have less marrow fat content than subjects with osteopenia. Similarly, subjects with osteopenia have less marrow fat content than this with osteoporosis (De Bisschop et al. 1993; Schellinger et al. 2000; Kugel et al. 2001; Jung et al. 2000; Wehrli et al. 2000; Shih et al. 2004; Chen and Shih 2006; Liney et al. 2007; Griffith et al. 2005, 2006; Shen et al. 2007; Tang et al. 2010; Liu et al. 2010) (Table 3). The proximal femur, which has a higher fat content than the vertebral body, also shows similar changes in increasing marrow fat content as the bone becomes more osteoporotic (Griffith et al. 2008) (Table 3). Even the femoral head, which has a very high intrinsic fat content, also shows an increase in marrow fat content with decreasing BMD though this increase is not as pronounced as in other areas.
Table 3
Bone marrow fat content (%) in elderly male and female subjects (mean age 73 years) for the lumbar spine and proximal femur
Marrow fat content | Normal | Osteopenia | Osteoporosis | P value |
|---|---|---|---|---|
L3 vertebral body (male) | 50.1 ± 8.7 | 55.7 ± 10.2 | 58.2 ± 7.8 | 0.002 |
L3 vertebral body (female) | 59.2 ± 10.0 | 63.3 ± 9.5 | 67.7 ± 8.5 | 0.002 |
Femoral head (female) | 86.3 ± 5.7 | 89.1 ± 3.8 | 89.9 ± 3.3 | 0.001 |
Femoral neck (female) | 80.8 ± 9.3 | 86.2 ± 6.5 | 88.4 ± 4.8 | <0.001 |
Sub-trochanteric (female) | 80.0 ± 6.0 | 84.5 ± 6.3 | 87.2 ± 4.4 | 0.001 |
4.4 Possible Erroneous Effect of Increasing Marrow Fat
It is possible that the aforementioned findings of increasing marrow fat content with decreasing BMD as measured by dual X-ray absorptiometry (DXA) may be spurious due to the effect of increasing marrow fat on BMD estimation by DXA. Increase in marrow fat content may cause an erroneous reduction in BMD measurements made by DXA (Sorenson 1990; Bolotin 1998; Bolotin et al. 2001; Bolotin 2007). This is because DXA evaluates BMD by measuring the transmission of X-rays at two different photon energies (Blake et al. 2009). The mathematical theory of DXA (basis set decomposition) holds that across a broad range of photon energies, the X-ray transmission factor through any physical object can be decomposed into the equivalent areal densities (g/cm2) of any two designated materials (Blake et al. 2009). For DXA scans, the two materials chosen are bone mineral (hydroxyapatite) and lean tissue. As a result, DXA measurements will only accurately reflect true BMD if the object being examined is composed entirely of hydroxyapatite and lean tissue. In practice, the human body is made up of not two but three main types of tissue, namely bone, lean tissue and fat. Neglecting the difference between lean and fat may lead to a spurious reduction in DXA–BMD measurement. When marrow fat content is known, DXA estimation of BMD needs to be corrected by 0.0014 g/cm2 in women and 0.0016 g/cm2 in men for every 1 % increase in marrow fat about zero (Blake et al. 2009). Applying this correction, the aforementioned results of increasing marrow fat with decreasing BMD still hold true.
4.5 Does Marrow Fat Composition Change with Reducing BMD?
Since changes in marrow fat composition can affect bone metabolism in vivo, and diets rich in polyunsaturated fats can affect BMD, it is conceivable that changes in marrow fat composition can affect bone metabolism (Yeung et al. 2005). To address, this question samples of marrow fat and subcutaneous fat from 126 subjects (98 females, 34 males, mean age 69.7 ± 10.5 years) undergoing orthopaedic surgery were analysed for fatty acid composition using gas chromatography and results correlated with BMD–DXA (Griffith et al. 2009; Yeung et al. 2008) (Fig. 8a, b). A total of 22 fatty acids were identified in marrow and subcutaneous fat. Significant differences existed between marrow and subcutaneous fat fatty acid composition as well as between marrow fat samples obtained from the relatively haematopoietic proximal femur and relatively fatty proximal tibia. Other than cis-7-hexadecenoic acid [C16:1 (n = 9)] and docosanoic acid [C22:0], no difference in marrow fatty acid composition was evident between subject groups of varying BMD (normal, low bone mass and osteoporosis). In particular, the overall polyunsaturated fatty acid content, the n − 6/n − 3 ratio and the percentage composition of those fatty acids most frequently implicated in bone remodelling, namely docosahexaenoic acid, arachidonic acid, γ-linolenic acid and eicosapentaenoic acid, were unchanged in subjects with normal BMD, low bone mass or osteoporosis (Griffith et al. 2009). Overall, it seems less likely that a change in marrow fat composition is directly affecting bone metabolism. The two associations found between fatty acid composition and BMD may be inconsequential given that they account for <1 % (for C16:1(n − 9)) and <0.1 % (for C22:0) of the total marrow fatty acid composition and they do not have any known effect on bone metabolism (Griffith et al. 2009).
Fig. 8
a Aspiration of marrow fat from proximal tibia during knee replacement. b Gas chromatography spectrum of marrow fat. Each fatty acid methyl ester is quantified based on peak high relative to internal standard
5 Bone Marrow Perfusion
5.1 Measurement of Bone Marrow Perfusion
Dynamic contrast-enhanced magnetic resonance imaging (DCE-MRI), also known as MR perfusion imaging, measures bone marrow perfusion as opposed to bone marrow blood flow (Griffith and Genant 2011). DCE-MRI is a robust technique that yields empirical indices of perfusion such as maximal signal intensity enhancement (E max) and enhancement slope (E slope) (Figs. 9, 10). E slope and E max are derived from the first-pass phase of signal intensity enhancement and have been shown to be strongly predictive of tissue vascularity, microvessel density and tissue necrosis. In simple terms, E slope can be thought of as gadolinium delivery to the bone marrow and is a feature of blood supply, vascular sinusoidal size and permeability. E max is dependent on these factors though also on the perfusion requirements (i.e. metabolic activity) of the bone marrow. Reproducibility of bone marrow DCE-MRI is moderate to high ranging from 0.59 to 0.98 with best reproducibility in those areas with the highest inherent bone marrow perfusion (Griffith et al. 2009).
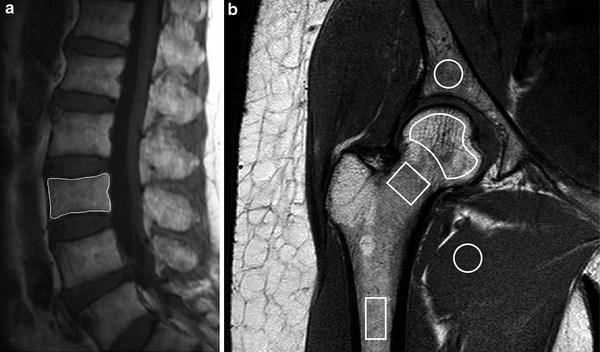
Fig. 9
Dynamic contrast-enhanced MR imaging a Sagittal T2-weighted MR image showing positioning of region of interest (ROI) for perfusion imaging of L3 vertebral body. b Coronal oblique T1-weighted image of proximal femur showing ROI’s used to measure marrow perfusion in the femoral head, neck and shaft
Fig. 10
Time-intensity curve with E max and E slope. E max represents maximum enhancement while E slope represents the slope of the rapidly up-rising part of the curve
Perfusion data acquired from dynamic contrast-enhanced MR imaging is also amenable to two-compartment pharmacokinetic modelling using models such as the Tufts or Brix model (Fig. 11). The Tufts model uses a combination of arterial input function (AIF), and rate constants K trans, K ex and K el. AIF is assessed by analyzing the first pass intensity profile of the feeding artery. K trans refers to the transport constant and is influenced primarily by blood flow. K ex refers to capillary exchange and is influenced by capillary space, permeability, interstitial pressure and extracellular space. K el refers to elimination or wash-out and is influenced by venous return. The Brix model does not rely on AIF or K trans but still considers K ex and K el. It assumes a linear relationship between MR signal enhancement and tissue contrast concentration or, in other words, it assumes that tissue contrast concentration directly correlates with perfusion. No specific pharmacokinetic model to reflect the unique characteristics of marrow perfusion has been developed. Measurement of bone marrow perfusion can also be undertaken by PET-CT imaging undertaken using 18F-fluoride which has a half-life of 112 min. Since this tracer is metabolised in bone, 18F-fluoride imaging is a combined measure of both bone perfusion and bone metabolism as compared to MR perfusion imaging which only measures bone perfusion. Pure bone perfusion can be evaluated by PET using the freely diffusible tracer 15OH20. However, these studies are difficult to perform as 15OH20 has a half-life of only 122 s and thus requires an on-site cyclotron. Nevertheless, a highly significant correlation between blood perfusion measured using 18F-fluoride and true bone perfusion using 15OH20 has been reported (Piert et al. 2002).
Fig. 11
Schematic diagram of a Tofts model and b Brix model
5.2 Physiological Age-Related Changes in Bone Marrow Perfusion
Bone marrow perfusion deceases with increasing age (Chen et al. 2001; Montazel et al. 2003; Baur et al. 1997). Subjects aged more than 50 years have a 62 % lower E max (21.88 ± 14.77) that those aged less than 50 years (58.21 ± 44.65, P < 0.005) (Chen et al. 2001). When this is further analysed according to sex, a greater discrepancy is observed. In women, E slope decreased by 80 % (from 87.17 ± 54.13 to 17.98 ± 13.80) in those older than age 50 years (P < 0.005). A similar trend is seen in men with E slope decreases by 33 % from 38.16 ± 21.69 to 25.38 ± 15.43 in subjects more than 50 years though this change did not reach statistical significance (P > 0.05) (Chen et al. 2001). Overall, vertebral bone marrow perfusion is higher in young females than young males (Chen et al. 2001). However, the rate of decrease of perfusion is less in males, which leads to vertebral bone marrow perfusion being higher in elderly males than elderly females (Chen et al. 2001). Similar findings were shown by Montazel JL et al. E max values being significantly higher in patients younger than 40 years than in those aged more than 40 years (P < 0.001). Perfusion parameters decreased with increasing age in a logarithmic relationship (r = 0.71) and correlated with increase in marrow fat content (Montazel et al. 2003). Savvopoulou et al. (2008) showed how the upper (L1, L2) lumbar vertebral bodies were better perfused than the lower (L3, L4, L5) vertebral bodies. In elderly subjects with normal BMD, E max was lower in females (32.3 ± 8.5 %) than males (34.5 ± 13 %) while E slope was higher in females (1.70 ± 5.2 %/s) than males (1.48 ± 0.7 %/s) (Griffith et al. 2005, 2006). To summarise, vertebral marrow perfusion is higher in young females than young males. However, perfusion decreases to a greater degree in females than males. Elderly females have reduced E max but not E slope compared to elderly males.
Related posts:

Stay updated, free articles. Join our Telegram channel

Full access? Get Clinical Tree


