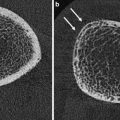
Fig. 1
DXA of the lumbar spine. a Patient positioned on DXA scanner (with fixed over-couch arm) for postero-anterior (PA – the X-ray source is below the table and the detectors in the scanning arm) for scanning of the lumbar spine. The legs are flexed at the hip and knee, and rest on a foam pad, to eliminate the natural lumbar lordosis so the spine is flat on the table. b DXA of normal lumbar spine L1–4. Measurements of BMC (g) and area (cm2) are provided for each vertebra L1–4. Results are expressed as a mean “areal” density (g/cm2) for all four vertebrae. For interpretation an appropriate race- and gender-matched reference database must be available (usually provided by the manufacturer of the scanner) and expressed as a standard deviation score (SD) from the mean of either mean peak bone mass PBM (T-score) or age-matched BMD (Z-score)
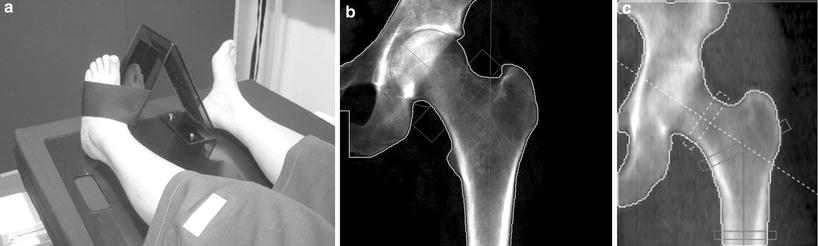
Fig. 2
DXA of left hip. a The leg is well positioned, being a little abducted and internally rotated, to bring the femoral neck parallel to the table, and with the foot secured on a positioner which is provided by the scanner manufacturer This position prevents foreshortening of the femoral neck (the lesser trochanter should not be prominently seen) which would cause falsely higher BMD. b Scan of left hip. Although “areal” bone mineral density (g/cm2) is provided in a number of different sites (femoral neck, oblong box; Ward’s area, small box; trochanter and total hip), for clinical diagnosis femoral neck and total hip are used. The morphometric measure of the hip — hip axis length (HAL) is the length of the line drawn parallel and between the cortical margins of the femoral neck and extending from the inner margin of the bony pelvis to the lateral margin of the femur. An increase in this length has been found to be predictive of hip fracture. c Hip strength analysis (HAS), calculated from the distribution of bone mineral around a central axis in sites in the femoral neck, inter-trochanteric and proximal femoral shaft regions, can be measured. Biomechanical properties of stress strain index and moment of inertia can be derived automatically. DXA scans of the hip are not recommended in children as the femoral shape has not yet acquired the shape of that in an adult
DXA can also be applied to peripheral skeletal sites (forearm and calcaneus), using either full-sized body (Fig. 3a–c), or dedicated peripheral, DXA scanners, although the latter are diminishing in availability and utilisation. Central DXA measures are currently used as the “gold standard” for the clinical diagnosis of osteoporosis by bone densitometry.
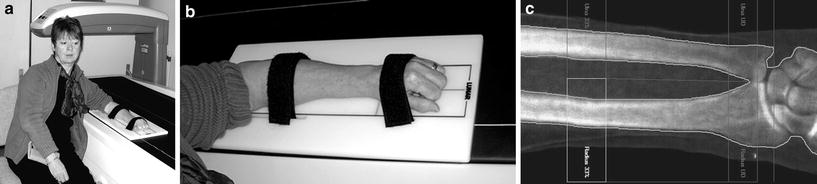
Fig. 3
Peripheral DXA. Can be obtained on dedicated peripheral DXA scanners, but are increasing being performed on central DXA scanners. a Positioning of patient and b arm pronated on the table. c DXA of the non-dominant forearm. The anatomical sites measured vary between scanners, but are generally the ultra-distal and distal 1/3. The latter is 95 % cortical, is particularly pertinent in patients with hyperparathyroidism (primary and secondary), has good precision (CV = 1 %) and can be used if there are factors which preclude DXA at central sites (excessive weight)
The measurements provided by DXA are BMC in grams, projected area of the measured site in cm2 and BMD in g/cm2. As the DXA image is a two-dimensional image of a three-dimensional object, this is an “areal”, rather than a true volumetric, density; there is the depth of the bones, which cannot be taken into account with a single postero-anterior (PA) projection. This results in one of the limitations of DXA, as the measurement is size-dependent. This is a particular problem in children, in whom the bones change markedly in size during growth, especially during puberty, and in patients whose disease might result in their being small in stature or having slender, small bones (e.g. chronic illness, growth hormone deficiency, Turner’s syndrome) (Gilsanz 1998; Blake et al. 2012; Adams 2013). To overcome this limitation to some extent, bone mineral apparent density (BMAD) can be calculated (Katzman et al. 1991). In the spine BMAD can be calculated assuming that the vertebra is a cube (Carter et al. 1992) or a cylinder (Kröger et al. 1993) and in the femoral neck assuming this is a cylinder (Lu et al. 1996).
If hyperparathyroidism (primary or secondary) is suspected a distal 1/3 radius measurement is relevant, a site at which cortical bone predominates (95 %), since cortical bone can be lost preferentially from this site in hyperparathyroidism (Fig. 3c) (Wishart et al. 1990; Silverberg et al. 2009). The forearm scan is also a useful alternative site to scan when it is not possible to obtain a valid DXA measurement at the spine or hip. This occurs in patients with bilateral hip replacement, elderly patients with severe degenerative disease in the lumbar spine and patients whose weight exceeds the safety limit of the scanner.
With appropriate software whole-body scanning can also be performed, from which can be extracted whole-body and regional bone mineral content (BMC; gm) and body composition of lean muscle and fat mass (Fig. 4) (Pietrobelli et al. 1996; Tothill and Hannan 2000; Albanese et al. 2003; Schoeller et al. 2005; Chun 2011). Whole-body DXA (less head) is advocated in children with a growing skeleton in whom the adult hip scan may not be appropriate (Gordon et al. 2008; Lewiecki et al. 2008). There have recently been significant improvements in body composition measurements with the availability of the National Health and Nutrition Examination Survey (NHANES) USA reference data which extends from 8 to 85 years. Additionally, measurements for android and gynoid region of interest can be extracted, and visceral adipose tissue estimated (Fig. 4) (Kelly et al. 2009; Micklesfield et al 2012).
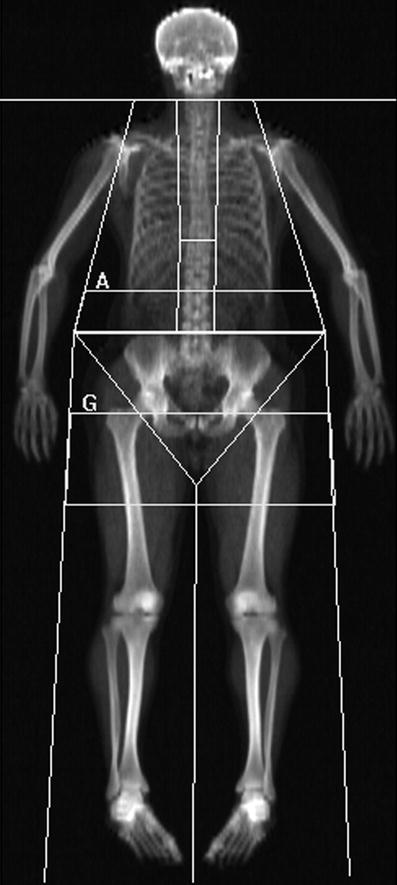
Fig. 4
Whole-body DXA scan: these can be acquired rapidly 1–2 min on fan beam DXA scanners, depending on patient size, and provides information on total and regional bone mineral content (BMC, g), area (cm2), bone mineral density (BMD; g/cm2) and body composition of lean muscle and fat mass. Sub-regional analyses are now available for body composition of the android (rectangular box below A) and gynoid (rectangular box below G) regions, and additionally visceral adipose tissue (VAT), which is found to correlate well with the measures made from cross-sectional CT
3.3 Precision and Accuracy
Precision measures the reproducibility of a bone densitometry technique, and is usually expressed as a coefficient of variation (CV) or standardised CV, which takes into account the range of measurements of the particular method (Gluer et al. 1995). To be clinically useful the precision needs ideally to be in the region of 1 %, and certainly better than 3 %. The precision for total hip and lumbar spine is approximately 1 %; for femoral neck and trochanter CV it is 2.5 % and for Ward’s area it is 2.5–5 %. In peripheral sites precision is 1 % in the distal radius, 2.5 % in the ultra-distal radius and 1.4 % in the calcaneus (Grampp et al. 1993; Pacheco et al. 2002; Shepherd et al. 2006). The measurement sites generally used in clinical diagnosis, in contrast to research studies, are therefore lumbar spine (L1–4), femoral neck and total hip (Kanis and Gluer 2000). Precision can be measured in either phantoms, normal individuals or in patients with osteoporosis. Precision is optimum in phantoms, and will be less good in patients with osteoporosis than in normal people, because positioning is more problematic in the former. Precision can be calculated by making repeat BMD measurements in the same individual after repositioning (usually a minimum of 10, but preferably 20 individuals or patients), although the International Society for Clinical Densitometry recommends 100 repeat scans (ISCD Position Development Conference—Writing Group 2004). Departments performing bone densitometry should ideally calculate their own precision but this is not always feasible. Precision is optimised by using the minimum number of expert and highly motivated and well trained technical staff; it is not ideal to have a large number of staff who rotate through different departments and perform bone density scanning only infrequently.
Accuracy is how close the BMD measured by densitometry is to the actual calcium content of the bone (ash weight). The accuracy of DXA lies between 3 % and 8 %. The inaccuracies are related to marrow fat and DXA taking soft tissue as a reference (Tothill and Pye 1992; Blake et al. 1999; Blake et al. 2009). Although DXA measurements are affected by accuracy errors similar inaccuracies are present when other basic clinical measurements are made of blood pressure and body temperature (Blake et al. 2012).
Specificity is the ability of the measurement to discriminate between patients with and without fractures, and to measure small changes with time and/or treatment. A statistically significant change in BMD is calculated from the precision of the measurement technique. To reach a statistically significant change, the BMD has to increase or decrease by at least 2.77 times the precision error. This is termed the least significant change (LSC) and implies that changes in BMD of 3–4.5 % in the lumbar spine and total hip, and of 6–7.5 % in the femoral neck BMD (Gluer 1999; Bonnick et al. 2001) have to be present for change in BMD to be significant. Changes in bone density are generally small; even in the early post-menopausal period in women, when bone loss is greatest, bone density decrements may only be in the region of 1–2 % per annum. Therefore, when performing follow-up BMD measures in an individual patient it is essential to leave an adequate time interval between measures, usually 18–24 months (Gluer 1999), unless particularly large changes in BMD are expected, for example after large doses of oral glucocorticoids (International Society for Clinical Densitometry 2007).
Since whether a patient develops a fracture depends on factors in addition to BMD (whether the patient falls, the nature of the fall, the patient’s age and response to the fall), it is impossible for BMD techniques to completely discriminate between those with and without fractures (Stone et al. 2003). However, approximately 60–70 % of bone strength depends on BMD (Ammann and Rizzoli 2003), the lower the BMD the more at risk the patient is of suffering a fracture and fracture prediction is optimum from the site-specific DXA BMD measurement (Marshall et al. 1996).
3.4 Correlations
DXA provides an “areal” density (g/cm2) of integral (cortical and trabecular) bone. The cortical/trabecular ratios vary in different sites (Eastell et al. 1989; Faulkner et al. 1991), being approximately:
50/50 in the PA lumbar spine
10/90 in the lateral lumbar spine scan
60/40 in total hip
80/20 in total body
5/95 in calcaneus
95/5 in distal 1/3 radius
40/60 in ultra-distal radius (depending on site of region of interest).
As a result of the different composition of bones and rates of change in these various skeletal sites, it is not surprising that measurements in different sites in the same individual will not give the same results (Eastell et al. 1989). The correlations between the BMD measurements made in the same patient vary between r = 0.4 and r = 0.9; it is not possible to predict from a DXA BMD measurement made in one site, what the BMD will be in another site using DXA or other bone densitometry methods (Grampp et al. 1997). In research studies, BMD measurements in different anatomical sites and by various bone density methods (DXA, QCT, QUS) may be complementary.
3.5 Radiation Dose
These quantitative photon absorptiometric techniques involve very low radiation doses, which are similar to those of natural background radiation (NBR; 2400 μSv per annum; about 7 μSv per day) (Kalender 1992; Huda and Morin 1996; Blake et al. 2006; Damilakis et al. 2010) (Table 1). For the first-generation pencil-beam scanners the dose per site scanned was about 1 μSv, but the dose may be up to 6 μSv for the hip scan in pre-menopausal women, when the ovaries are included in the scan field (Lewis et al. 1994). The doses are a little higher for the fan-beam scanners (generally 3–9 μSv), but were up to 62 μSv with some scanners (Lunar Expert, which is no longer manufactured) (Eiken et al. 1994; Njeh et al. 1996). Radiation doses for forearm and calcaneus scans are extremely low (0.5 and 0.03 μSv respectively). These DXA doses are less than one-quarter of the dose of a chest radiograph (20 μSv), and considerably lower than doses involved in other radiographic examinations carried out to confirm the diagnosis of osteoporosis in patients at risk; lateral spinal radiographs involve doses in the region of 300–700 μSv per projection, depending on patient size and exposure factors (Damilakis et al. 2010).
Table 1
Approximate ionising radiation doses of fan beam DXA and some comparable investigations used in osteoporosis
Examination | Site | Effective dose (µSv) | NBR | FC |
|---|---|---|---|---|
DXA | Spine | 13 | 2 day | <1 in few million |
Femur | 9 | 1 day | <1 in few million | |
Total body | 5 | 17 h | <1 in few million | |
Vertebral fracture assessment (DXA VFA) | Spine: | |||
Single energy | 12 | 2 days | 1 in 1 million | |
Dual energy | 42 | 6 days | 1 in 1 million | |
Radiographs | Hand | <1 | <1 h | <1 in few million |
Chest | 20 | 3 days | 1 in 1 million | |
Lumbar spine | 700–1000 | 7 months | 1 in 200,000 | |
Return flight UK/USA | 80 | 12 days | ||
Background radiation | 7–20 per day | |||
(2400–7300 per year) |
4 Indications, Including WHO FRAX®
There has been much debate concerning the appropriate use of bone densitometry, particularly in population screening in women at menopause (Melton et al. 1990), and the cost-effectiveness of such a programme has not been established. However, there is now consensus that DXA bone densitometry is the quantitative method of choice for the diagnosis of osteoporosis before fractures occur (Compston et al. 1995; Kanis et al. 1997, 2009; Adams 2013). DXA bone densitometry has high specificity but low sensitivity. Selection of patients who would most appropriately be referred for DXA bone densitometry was in the past based on a case-finding strategy in those who have had an insufficiency (low trauma) fracture or have other strong risk factors (Royal College of Physicians 1999), and there were national differences in such referral guidelines.
A new approach for appropriate DXA scan referral and interpretation was introduced by the World Health Organisation (WHO) in 2010. This tool is based on using clinical risk factors (Table 2), with or without femoral neck BMD, to estimate a patient‘s 10-year probability of a fracture at the hip or one of the major osteoporotic sites (Johnell et al. 2005; Kanis et al. 2007; Compston 2009a). The latter are defined as the hip, spine, forearm and humerus. The FRAX WHO fracture risk assessment tool is accessed using the web site http://www.shef.ac.uk/FRAX (World Health Organisation 2010), is applicable in women and men aged 40–90 years, is currently available for use in 30 different countries and has been incorporated into manufacturers’ DXA scan reports (Fig. 5a, b). The FRAX algorithm was developed from data based on meta-analyses from nine different international (North America, Europe and Asia) fracture studies. These included 46,000 men and women with 190,000 person-years of follow-up, and 850 cases of hip fracture and 3,300 other osteoporotic fractures (Kanis et al. 2007; Blake et al. 2012). FRAX is increasingly being incorporated into guidelines on the appropriate referral for DXA and treatment of osteoporosis, but these vary between nations. In the United States the National Osteoporosis Foundation (NOF) has added FRAX to the criteria for treating patients using therapeutic threshold fracture risk levels of 3 % for hip fracture and 20 % for a major osteoporotic fracture (National Osteoporosis Foundation 2010). In the United Kingdom a different treatment algorithm was produced by the National Osteoporosis Guidelines Group (NOGG), which recommended that FRAX is used to select the patients who would most appropriately be referred for a DXA scan (Kanis et al. 2008; Compston et al. 2009) (Fig. 5a, b). FRAX should lead to a more appropriate utilisation of DXA scanning and results, and more cost-effective intervention strategies (Johansson et al. 2012). Whether other clinical risk factors and additional quantitative skeletal assessments can be added to the FRAX calculator is being explored (Binkley and Lewiecki 2010; Lewiecki et al. 2011).
Fig. 5
WHO FRAX® 10 year fracture risk calculator: a this can be accessed at http://www.shef.ac.uk/FRAX and the fracture risk for patients aged between 40–90 years can be calculated using clinical risk factors alone, or with the addition of femoral neck BMD, with knowledge of the DXA scanner manufacturer. The risk for major osteoporotic fractures, (defined as the hip, spine, forearm or humerus) and hip fracture are calculated and guidelines determine appropriate management interventions. These may vary between nations. The National Osteoporosis Foundation (NOF) in the USA has criteria for treating patients using therapeutic threshold fracture risk levels of 3 % for hip fracture and 20 % for a major osteoporotic fracture (National Osteoporosis Foundation 2010). b The tool can be used with just clinical risk factors and guidelines (National Osteoporosis Guidelines group NOGG in UK) will indicate if DXA scan should be performed. Consequently FRAX should lead to a more appropriate utilization of DXA scanning and results, and more cost effective intervention strategies
Table 2
Factors used in the WHO FRAX® 10 year fracture calculator
• Country or geographic region |
• Ethnic origin (US only) |
• Age |
• Gender |
• Weight (kg) and height (cm) (BMI) |
• Previous low trauma fracture in adult life |
• Parental hip fracture |
• Current smoking |
• Current or past oral glucocorticoid therapy (≥5mg for >3 months) |
• Rheumatoid arthritis |
• Secondary osteoporosis* |
• Alcohol intake ≥3 units daily |
5 Positioning, Artefacts and Errors
5.1 Patient Positioning
For measurement of the lumbar spine the patient is positioned supine on the scanner table with the legs flexed at the hips and knees and the calves resting on a square pad (Fig. 1a). This removes the natural lumbar lordosis, so that the lumbar spine lies flat on the scanner table. For scanning of the proximal femur the leg is slightly abducted and internally rotated and fixed to a shaped block provided by the scanner manufacturer (Fig. 2a). This ensures that the femoral neck is parallel to the table to avoid foreshortening. Any foreshortening will result in false elevation of BMD (same amount of calcium in reduced area) (Fig. 6d), and poor positioning of the femur can result in errors in BMD of the femoral neck of 0.95–4.5 % (Wilson et al. 1991; Goh et al. 1995). For whole-body DXA, the technician must ensure that all parts of the body, including arms and hands, are positioned inside the marker line on the scanner table.
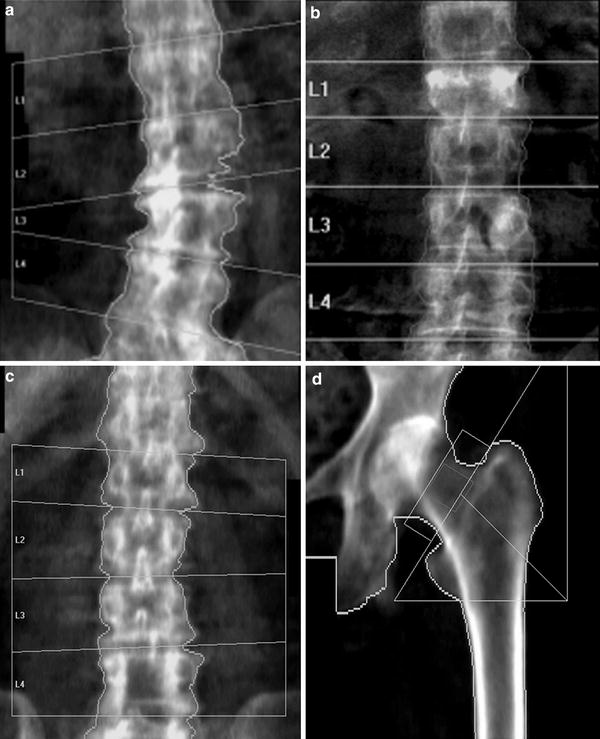
Fig. 6
Artefacts on DXA: lumbar spine. a Degenerative disc disease and marginal osteophytes on the right: falsely elevated BMD at L2/3 and L3/4. b Vertebral fracture of L1. BMD at this level will be falsely elevated (same BMC as non-fractured vertebra, but in a smaller projected area, giving higher apparent BMD). c Laminectomy L4. The removal of the laminae and spinous process will falsely reduce the BMD of this vertebra. The DXA images must always be carefully scrutinised for such artefacts, and the affected vertebra excluded from analysis. There must be a minimum of at least two vertebrae for diagnosis; interpretation should not be made on a single vertebra. If a vertebral fracture has occurred between sequential DXA measurements, then the results from that vertebra must be excluded from all scans to calculate longitudinal change in BMD. d Proximal femur: the lesser trochanter is prominent, indicating inadequate internal rotation of the femur. This external rotation of the leg will cause foreshortening of the femoral neck and hence overestimation of BMD (same BMC as well-positioned femoral neck, in a smaller projected area)
For scanning of the forearm on a central DXA scanner the hand is pronated and the arm and hand are positioned flat on the scanner table (Fig. 3a and b). In dedicated peripheral scanners the forearm is scanned in a vertical position with the hand gripping a short vertical pole to ensure reproducible positioning. The non-dominant forearm is generally scanned unless there are contraindications to this, such as a previous fracture or metal artefact, when the dominant forearm is scanned. For measurements of the calcaneus on a dedicated peripheral DXA scanner the foot is positioned in a foot well, as prescribed by the manufacturer of the equipment; on a central DXA scanner the patient is placed in the lateral decubitus position on the side of the calcaneus to be examined so that a lateral calcaneus scan can be obtained.
5.2 Artefacts
Imaging artefacts can cause inaccuracies in DXA measurements (Fig. 6a–d). They are most common in the lumbar spine, particularly in more elderly patients (Table 3). All the calcium in the path of the X-ray beam will contribute to the BMD measured. If there is heavy aortic calcification, degenerative disc disease (osteophytes, osteoarthritis and hyperostosis of the facet joints) or a vertebral fracture (in which the same amount of calcium as was present before the fracture occurred is contained in the vertebra which is reduced in area following fracture) present, then the BMD will be falsely elevated (Orwoll et al. 1990, Frohn et al. 1991, Laskey et al. 1993, Franck et al. 1995, Jaovisidha et al. 1997). Other aetiologies can also cause false elevation or underestimation of BMD measured by DXA (Table 3) (Fig. 6a–c). It is therefore essential that all DXA images be scrutinised for such artefacts. The vertebra affected significantly by artefact should be excluded from analysis, but there must be a minimum of two vertebrae assessable for interpretation. Anomalies in spinal segmentation may be quite frequent (16.5 %), and may cause the vertebral bodies to be misidentified (Peel et al. 1993). Approximately 50 % of the increment in BMD with strontium ranelate treatment will be artifactual due to the high atomic number strontium being taken up in the bone, and effects may differ between different manufacturer’s scanners (Blake et al. 2007; Liao et al. 2010). Laminectomy will cause DXA BMD to be falsely reduced and affected vertebrae must be excluded. DXA will also not differentiate low BMD being due to osteoporosis or osteomalacia.
Table 3
DXA artefacts causing errors in estimation of BMD
Artefacts causing overestimation of BMD: |
Spinal degeneration and hyperostosis (osteophytes) |
Vertebral fracture |
Extraneous calcification (lymph nodes, aortic calcification) |
Sclerotic metastases |
Overlying metal (clips, coins, navel rings, surgical rods) |
Overlying objects (wallets, buttons) |
Vertebral haemangioma |
Ankylosing spondylitis with paravertebral ossification |
Strontium ranelate therapy |
Vertebroplasty/kyphoplasty |
Poor positioning of femoral neck (inadequate internal rotation) |
Artefacts causing underestimation of BMD: |
Laminectomy |
Lytic metastases |
Barium contrast medium in bowel |
Recent radionuclide investigation |
To overcome the problems of degenerative disc disease and hyperostosis in PA DXA of the spine, lateral DXA has been developed (Fig. 7c). On scanners with “C” arms lateral scanning can be performed with the patient remaining in the supine position; otherwise the patient has to be repositioned in the lateral decubitus position, which limits its clinical practicality and precision (CV = 2.8–5.9 % in lateral decubitus position, 1.6 %–2 % in the supine position). L3 may be the only vertebra in which lateral DXA can be measured, as there may be superimposition of ribs over L1 and L2 and the iliac crest over L4. So although lateral DXA may be a more sensitive predictor of vertebral fracture than PA spinal DXA as it is principally measuring trabecular BMD and is less affected by degenerative spine changes than is the PA scan projection, the limited precision and impracticality has resulted in lateral DXA BMD not often performed in clinical practice (Guglielmi et al. 1994; Del Rio et al. 1995; Jergas et al. 1995; Blake et al 1996).
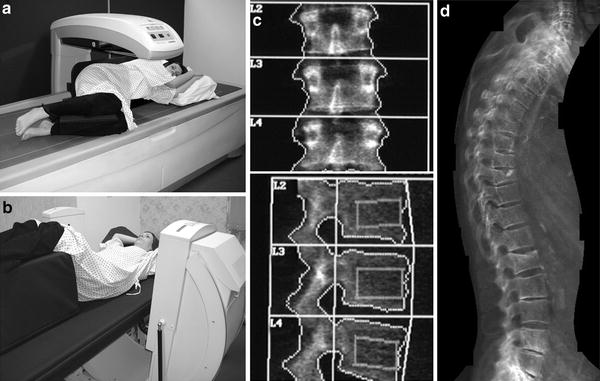
Fig. 7
Lateral DXA of the spine for BMD measurement, vertebral fracture assessment (VFA) and abdominal aortic calcification (AAC) scoring. a With a scanner with a fixed arm the patient has to be repositioned in the lateral decubitus position to enable lateral scanning to be performed. This repositioning takes additional time, and may be problematic in patients with osteoporosis. b On scanners with a “C” arm this can be rotated (as illustrated) to allow lateral scanning of the patient in the supine position without repositioning. c Bone densitometry, PA (upper image) and lateral (lower image) projections. From such scanning in two planes some calculations can be made to calculate true volumetric BMD (g/cm3). The lateral DXA gives a measurement that is predominantly trabecular bone (oblong box) and is therefore is not so affected by degenerative spinal changes as is the PA measurement. However, the ribs may overlie L1 and L2, and the iliac crest may overlie L4, leaving only one vertebra (L3) for analysis. The precision of BMD measurement from lateral spinal DXA is also poorer than for PA DXA, so that it is not often used in clinical practice. d Vertebral fracture assessment: grade 2 moderate vertebral fractures at T 9 and L1, grade 1 mild endplate fractures of T6 and T8 and spindylosis evident at l4/5 and L5/S1. With the introduction of fan-beam DXA the spatial resolution of the images has improved (approximately 0.35–0.5 mm) and scan times are shorter. It is possible to obtain a lateral view of the vertebrae from approximately T4 to L4 with single- and dual-energy images. A visual assessment can be made for vertebral fracture, or vertebral shape can be defined by morphometric assessment with 6 point placements on the anterior, mid and posterior edges of the upper and lower vertebral endplates. Abdominal aortic calicification (AAC) scoring: calcification is present anterior to the lumbar vertebrae L1-4; this can be scored by either the 8 or 24 point scale. AAC has been found to be independently associated with incident myocardial infarction or stroke in women and so offers an opportunity to capture this cardiovascular risk factor in postmenopausal women undergoing bone densitometry, at very little additional cost
Because of these artefacts on PA DXA scans of the lumbar spine, it has been suggested that in the more elderly population (over 65 years) only the proximal femur (femoral neck, total hip) should be scanned (Kanis and Gluer 2000). However, monitoring change is performed optimally in the lumbar spine, if there are no artefacts present.
As DXA makes some assumptions about the composition of soft tissue adjacent to the skeletal site in which BMD is being measured inaccuracies may occur when excessive obesity, or underweight in patients with anorexia, are present. Excessive weight changes between DXA scans performed for monitoring BMD will also introduce inaccuracies and affect precision; but how such inaccuracies should be corrected for is not yet established.
5.3 Sources of Error
Spinal scoliosis may make DXA scans of the spine difficult to analyse, and it may prove impossible to perform DXA if the patient is not able to lie flat (e.g. if the patient is in cardiac failure or has severe chronic obstructive airways disease or thoracic kyphosis), or if pain or deformity makes positioning problematic.
As DXA uses the soft tissues as a reference, errors in BMD can arise if the patient is excessively under- or overweight. Some manufacturers (GE/Lunar) used to apply a weight correction to the results provided (Z score), but such weight correction should not now be applied. Precision errors increase in obese patients (Knapp et al. 2012).
6 Interpretation of Results
When a BMD measurement has been made in a patient, this has to be interpreted as normal or abnormal and a report formulated that will be of assistance to the referring clinician (Miller et al. 1996). For this it is essential that age-, sex- and racially matched reference data are available. The scanner manufacturer supplies such normal reference databases. These databases are predominantly, but not exclusively, drawn from a white, Caucasian, American-based population. There is a paucity of appropriate reference ranges for children and certain ethnic minorities (e.g. Asians; Afro-Caribbean). A patient’s results can be interpreted in terms of the standard deviations (SD) from the mean of either sex-matched peak bone mass (PBM) (T-score) or age-matched BMD (Z-score) (Parfitt 1990). Alternative methods of interpretation are as a percentage or percentile of expected PBM, either gender- and age-matched or just gender-matched.
The WHO has defined osteoporosis in terms of bone densitometry. A T-score of less than −2.5 defines osteoporosis (World Health Organisation 1994). This was arbitrarily defined as the level of BMD in post-menopausal women that identified approximately 30 % of that population as having osteoporosis in their lifetime (this is thought to be the percentage of post-menopausal women who will suffer a vertebral fracture in their lifetime). The definition applied to DXA measurements made in the lumbar spine, the proximal femur and the forearm. The definition does not apply to other techniques (e.g. QCT, QUS) or other anatomical sites (e.g. calcaneus) (Grampp et al. 1997; Faulkner et al. 1999; Miller 2000), nor is it yet confirmed to be applicable to younger women and men.
T-scores are calculated by taking the difference between a patient’s measured BMD and the mean BMD in healthy young adults matched for gender and ethnicity, and expressing the difference relative to the young adult population SD:
A T-score measurement of less than, or equal to, −2.5 at the spine, distal 1/3 radius, femoral neck or total hip sites is taken to indicate osteoporosis. Measurements between −2.5 and −1.0 are interpreted as indicating osteopenia, while measurements greater than −1.0 at all three sites are classified as normal (World health Organisation 1994). A limitation of this T-score method for making decisions about patient therapies is that factors such as age and a history of previous insufficiency fracture are independent risk factors that are as important as BMD in determining the 10-year risk of fracture. In the FRAX fracture risk calculator a selected list of clinical risk factors (Table 2) is used together with femoral neck BMD to improve fracture risk prediction.
Z-scores compare the patient’s BMD with the mean BMD for a healthy subject matched for age, gender and ethnicity (International Society for Clinical Densitometry 2007; Chun 2011).
Until PBM has been reached (i.e. in children and young adults up to approximately 19 years) interpretation can be made only by comparison to the age-matched mean (Z-score) (Faulkner et al. 1993b; Gordon et al. 2008).
BMD measurements in the whole skeleton can be performed using total body scans (Nuti and Martini 1992). These are usually interpreted after excluding the head from the scan analysis, particularly in children (Lewiecki et al. 2008; Ward et al. 2007).
Variations in the mean and standard deviation of reference ranges may alter the number of patients identified as osteoporotic (Ahmed et al. 1997); in DXA of the hip, use of the NHANES reference database is preferred for white Caucasians (Looker et al. 1998).
In calculating change over time, the absolute BMD values (g/cm2) have to be used. To be statistically significant the change in BMD has to be 2.77 times greater than the precision to reach the least significant change (LSC); in longitudinal studies in individual patients one needs to leave an intervening period of at least 18–24 months between measures to ensure significant change in individual patients (Gluer 1999).
7 Applications
7.1 Clinical
7.1.1 Diagnosis of Osteoporosis
Osteoporosis is defined as “a condition characterised by reduced bone mass and deterioration of bone structure”. It is the most common of the metabolic bone diseases, affecting 1 in 3 women and 1 in 12 men during their lifetime. DXA is currently the most widely available bone densitometric technique for the diagnosis of osteoporosis, although its availability in different countries varies (Chun 2011; Guglielmi et al. 2011; Adams 2013). Central DXA scanners cost approximately 80,000 EUR to 120,000 EUR, depending on the sophistication and versatility of scan functions; dedicated peripheral DXA scanners are less expensive (approximately 30,000 EUR), smaller and portable, with the potential for use in a community rather than a hospital setting. For clinical diagnosis the lumbar spine and proximal femur are scanned; forearm scanning can be performed on either central or dedicated peripheral scanners. Although the ionising radiation from these DXA scanners is low, ionising radiation regulations apply to their installation and operation. Dedicated and highly motivated technical staff with appropriate training will ensure high quality of positioning of the patient and good precision of the results.
Different manufacturers use different edge detection algorithms and analyse different ROIs for analysis in the hip. For this reason, results from different scanners are not interchangeable. In longitudinal studies it is vital to use the same scanner and software program. With technical developments it may become necessary to replace a scanner. In order to cross-calibrate between the old and the new scanner, scanning patients (approximately 100, with a spread of BMD from high to low) and phantoms (manufacturers or European Spine Phantom) will generally allow the required calculations to be made (Genant et al. 1994; Kalender et al. 1995; Hui et al. 1997; International Society for Clinical Densitometry 2004).
7.1.2 Prediction of Fracture
DXA BMD measurements made in any skeletal site (central and peripheral) are predictive of fracture (Marshall et al. 1996), with the risk of fracture increased in individuals with the lower BMD, but it is impossible to define a specific fracture threshold (Siris et al. 2004). The relative risk of fracture in various skeletal sites for every 1SD reduction in age-adjusted mean BMD were published in a meta-analysis study and are given in (Table 4) (Marshall et al. 1996). This reduction in BMD in predicting fracture is as good as a rise of 1SD in blood pressure is in predicting stroke, and a 1SD rise in cholesterol is in predicting myocardial infarction. Site-specific measurements are best in predicting fracture in that particular anatomical place.
Table 4
Relative risk (RR) of fracture per 1 SD decrease in BMD (measured by photon absorptiometry) below age-adjusted mean (Marshall et al. 1996)
BMD site | Forearm | Hip | Vertebral | All |
|---|---|---|---|---|
Radius, distal | 1.8 | 2.1 | 2.2 | 1.5 |
Radius, ultradistal | 1.7 | 1.8 | 1.7 | 1.4 |
Hip | 1.4 | 2.6 | 1.8 | 1.6 |
Lumbar spine | 1.5 | 1.6 | 2.3 | 1.5 |
Calcaneum | 1.6 | 2.0 | 2.4 | 1.5 |
All | 1.6 | 2.0 | 2.1 | 1.5 |
7.1.3 Decisions for Treatment
Although there is consensus on the definition of osteoporosis (T-score at, or below, –2.5), there is as yet no consensus on levels of BMD which justify therapeutic intervention. This is perhaps not surprising, since it is the individual patient that is being treated, not the bone density result. Other risk factors including age, gender, parental history of osteoporosis, history of insufficiency fractures, oral glucocorticoid therapy, cigarette smoking, alcohol consumption, associated diseases that cause secondary osteoporosis will influence fracture risk and appropriate management. These clinical risk factors are used in the WHO FRAX 10-year fracture risk calculator which therefore makes referral for DXA bone densitometry and therapeutic intervention more appropriate through various international national guidelines (Compston et al. 2009; National Osteoporosis Foundation 2010) (Fig. 5b).
Other guidelines have been published as to the appropriate use and interpretation of DXA in glucocorticoid therapy (Compston 2010b), and when aromatase inhibitors are used in patients with breast cancer (Reid et al. 2008), which may have different T-score intervention thresholds recommended: T-scores: glucocorticoids below −1.5; breast cancer on aromatase inhibitors below −2.0.
Related posts:

Stay updated, free articles. Join our Telegram channel

Full access? Get Clinical Tree


