Fig. 1
Biocontinuum: The time course of renal symptoms in patients treated with radiation therapy (with permission from Rubin and Casarett 1968)
2 Anatomy and Histology
2.1 Gross Anatomy
The kidneys are paired organs, located in the posterior abdomen within the retroperitoneum, ranging in length from 9 to 13 cm, the left slightly larger than the right (Fig. 2). Surrounding organs include the liver, the diaphragm, and the spleen. The right kidney is slightly lower than the left. They are surrounded by fat and renal fascia, and they are mobile. Renal motion during respiration ranges from 5 to 30 mm, in a coronal body plane. Each kidney is attached to a ureter which drains the urine to the bladder for excretion. Congenital absence of one kidney can occur, but occurs in only 1 in 1000 births. One in about 500 people is born with a horseshoe kidney, which forms from the fusion of two kidneys, and is usually located within the pelvis (Fig. 2).
Fig. 2
Gross anatomy of the kidney (with permission from Tillman 2007)
2.2 Histology and the Functional Subunit
The nephron is the basic structural and functional unit of the kidney. It depends on a complex vascular system. Afferent vessels become tufts of capillaries in the renal glomeruli, then empty into the efferent arterioles. The glomerular capillary blood pressure provides the force for water and solutes to be filtered out of the blood into a space contained in a fibrous sac referred to as Bowman’s capsule that opens to the proximal tubule. The tubule is the portion of the nephron that contains the tubular fluid filtered by the glomerulus. Draining each glomerulus, the tubules are: the proximal convoluted tubule, then Henle’s loop, the medullary thick ascending limb, and finally the distal convoluted tubule and collecting ducts, each section with specific functions. There are cortical nephrons, located superficially, and juxtamedullary nephrons, located more deeply in the kidney, which have somewhat different excretory and urine concentrating abilities. Histologic examples are shown in Fig. (3a, b, c).
Fig. 3
Renal histology low (a) and high (b) and (c) magnification (with permission from Zhang 1999)
The architecture of the kidney can be considered as subunits predominantly arranged “in parallel”, but with some serial function. For example, the collecting system is “in series”, because an injury to the central collecting system or fibrosis/stenosis of the ureter will render the upstream kidney non-functional. In contrast, a portion of the kidney can be injured without cessation of global organ function, because nephrons function relatively independently, as subunits arranged “in parallel”. Resection or injury to a region of kidney will not immediately compromise function of adjacent regions. However, over the long term, after loss of sufficient kidney mass, “overwork” of the remaining nephrons may stress them and lead to their injury, with subsequent decline of overall kidney function (referred to as “hyperfiltration” (Brenner 1983)).
3 Biology, Physiology, and Pathophysiology
3.1 Tissue, Cellular, and Molecular Mechanisms
The pathogenesis of RT-induced kidney injury is not well understood. The major target for injury appears to be the arteriolar-glomerular area rather than the tubular epithelium, as the earliest cellular feature of RT-induced kidney injury is glomerular endothelial cell injury. Of the many cell types in kidneys, glomerular, then interstitial capillary endothelia have the highest mitotic indices (Nadasdy et al. 1994). This may explain the predominance of glomerular injury in radiation nephropathy. On light and electron microscopy, glomerular endothelial injury and mesangiolysis are characteristic. Progressive replacement of capillary walls and lumina lead to glomerular sclerosis (Glatstein et al. 1977), which proceeds tubular injury (Jaenke et al. 1993). Tubular cell loss occurs, probably by both direct irradiation injury and secondarily, from ischemia, due to the vascular radiation injury. The cortical tubules tend to be disrupted more than the medullary tubules.
Following Hematopoietic Stem Cell Transplant (HSCT) and TBI, thrombotic microangiopathy is an additional, systemic feature commonly observed. Although it has been seen following non-TBI kidney irradiation (Cogan and Arieff 1978), it is unusual in this setting. The development of thrombotic microangiopathy may be influenced by extra-renal endothelial injury caused by RT.
At the cellular and molecular levels, a cascade of events begins immediately after exposure to RT and proceeds during a prolonged period of clinically occult injury (Rubin et al. 1995; Johnston et al. 1996; Fleckenstein et al. 2007). Endothelial cell death in mitosis can result in increased vascular permeability, edema, inflammation, and fibrosis (Vujaskovic et al. 2001; Jackson et al. 2006; Fleckenstein et al. 2007; Novakova-Jiresova et al. 2007) (Vujaskovic Anscher et al. 2001; Jackson Batinic-Haberle et al. 2006). Free radicals are formed by the ionizing radiation, leading to DNA damage and mitotic cell death. In general, this transient increase in reactive oxygen and nitrogen species is unlikely to be sufficient on its own to produce prolonged progression of injury. Subsequent chronic oxidative stress and inflammation might perpetuate the production of free radicals and activate cytokines that may contribute to the development of chronic injury. On the level of mediators, intra-renal TGF-beta is elevated in experimental radiation nephropathy, but it is not clear if it results from injury or initiates it. (Datta et al. 1999) (Cohen et al. 2000) As for the role of oxidative stress, in animal models, there is thus far no clear evidence that chronic oxidative stress plays an essential role in radiation nephropathy.
Animal studies have investigated the dependence of radiation fraction size on radiation nephropathy. In rodents, for fraction sizes of 1 Gy or higher, an α/β ratio of 1.5–3 Gy was found for radiation nephropathy (Stewart et al. 2001). The inter-fraction interval has also been shown to be important in animal models, with an estimated half-time for repair of 1–2 h (similar for fraction sizes from 2 to 7 Gy). The time to expression of renal damage has also been shown to be dose dependent in animal models, with larger doses causing shorter latency times. The histology of radiation nephropathy is the same, regardless of the fractionation.
3.2 Physiology and Pathophysiology
The kidneys are organs that have many roles. They maintain the homeostasis of body fluids by filtering metabolites, including the urea and fixed acid of protein catabolism. The kidneys are the regulators of blood pressure, mainly via sodium excretion and the renin-angiotensin system. The kidneys accomplish their functions independently and through coordination with the cardiovascular and endocrine system. Thus, for instance, sodium balance depends in part on adrenally secreted aldosterone, which increases sodium ion reabsorption in the distal convoluted tubules of the kidneys. Water balance depends on detection of changes in plasma osmolarity by the hypothalamus. Increased plasma osmolarity leads to enhanced renal conservation of water, and that is dependant on the antidiuretic hormone, vasopressin, which is secreted by the posterior pituitary gland in response to the hypothalamic detection of changed osmolarity. The renal conservation of water closes the feedback loop. The kidneys secrete a variety of hormones, including erythropoietin, urodilatin, renin, and vitamin D, and they regulate glucose metabolism (Table 1 and Fig. 4a, b, c).
Table 1
Renal physiology
Function | Test |
|---|---|
Glomerular filtration fraction (GFR) | Insulin clearance test |
Tubular reabsorption limitation (TRM) | Para-amino hippurate test |
Antidiuretic hormone (ADH) secretion | Urine osmolality and volume test Blood urea level test |
Angiotensin converting enzyme (ACE) | Blood pressure serial Na + Cl Levels |
Potassium, calcium, and phosphate excretion | Serum: K, Ca, Ph levels |
Bicarbonate production and reabsorption | Urine Uta concentration Urine Unh4 ammonium concentration |
Fig. 4
a Pathology—schematic of glomerular sclerosis. With permission from Rubin 2001, bc Glomerular sclerosis demonstrates the withering and loss of glomeruli. (b) Low mag, (c) High mag. The radiation response in the renal parenchyma. The responsive cell types are in the endothelium and epithelium. There is fibrinoid and hyaline accumulation associated with endothelial swelling in the afferent arterioles, which may spread beneath the glomerular capillary endothelium. The basement membrane thickens. Vascular compromise promotes thromboses, possibly leading to infarct. The tubular epithelium presents a variable picture, but there is some degree of interstitial fibrosis. As the vascular compromise develops, larger vessels may be affected, with focal necrosis and accumulations of foamy histiocytes. (From White (1975) with permission)
The renin-angiotensin system appears to play a role in radiation nephropathy. In animal models, angiotensin-converting enzyme (ACE) inhibitors are very effective in preventing, mitigating, and treating radiation nephropathy (Cohen et al. 1997), and conversely, angiotensin II infusion exacerbates radiation nephropathy (Cohen et al. 1999). However, activation of the renin-angiotensin system (systemically or locally within the kidney) has not been confirmed in radiation nephropathy (Cohen et al. 2002). Thus, the exact role of the renin-angiotensin system in this model is not well-defined.
3.2.1 Glomerular Function
The serum creatinine concentration is used to evaluate renal function, despite its substantial variability. Creatinine is freely filtered by the glomeruli, and its tubular secretion is less important than its filtration. The clearance of creatinine (CrCl) from the body approximates the actual GFR. Measurement of GFR is particularly important in cancer patients, as many cytotoxic agents are eliminated primarily by the kidneys. GFR measurements may help to adjust the dosing of cytotoxic agents, and accurate chemotherapy dosing may reduce side effects of the cytotoxic agents, all the while retaining their benefit.
GFR can be measured using radiolabelled isotopes, contrast media, or inulin. Twenty-four hours urine collection is another method to measure creatinine clearance. Since the serum creatinine level depends on its release from creatinine in muscle, normal serum creatinine levels are dependent on age and sex. Different mathematical formulas have been used to estimate GFR, which take into account the age, size, and gender variability of the serum creatinine. Most of these formulas have not been validated in cancer patients, but they are used commonly as they provide rapid and simple estimations of GFR.
Clinically relevant differences between calculated GFR values and measured GFR values have been observed (Holweger et al. 2005). Measurement of GFR of low-molecular-weight proteins, such as cystatin C and ss-trace protein, may be more useful than CrCl or mathematically estimated GFR. The optimal strategy for measuring GFR in cancer patients is not clearly defined (Holweger et al. 2005)
3.2.2 Tubular Function
The normal tubules reabsorb much of the glomerular filtrate, to achieve acid–base balance and maintain body tonicity. Therefore, tubular injury may manifest as changes in tubular excretion of normally reabsorbed substances, abnormalities in urine pH, or body tonicity. Beta-2 microglobulin levels in blood or urine can be useful in identifying a tubular injury, as this protein is usually almost completely reabsorbed by the proximal tubules. Tubular injury can also lead to changes in cation and anion excretion.
Illustrations of the histology of RT effects on the kidney are shown in Fig. 4. The effects of RT on the microvasculature of the glomerulus are shown in Fig. 5. Various metrics used to quantify renal function are provided in Table 1.
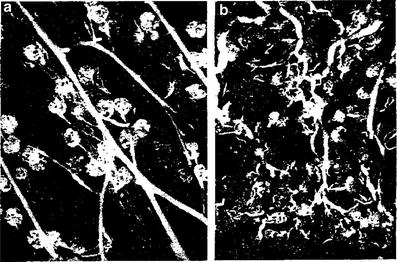
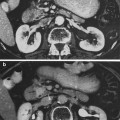
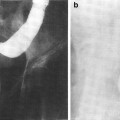
Fig. 5
Pathophysiology: Pathology of acute clinical periods: microradiographs of cortical region of the kidney. a Microangioradiograph of cortical region of normal dog kidney, showing relatively normal filling of interlobular arteries, afferent arterioles, and glomeruli with the radiopaque medium (×25). b Microangioradiograph of cortical region of normal dog kidney 6 months after receiving a single X-ray dose of 1000 rads, showing the effects of the occlusive changes in interlobular arteries and afferent arterioles in terms of decreased and irregular filling of these vessels and glomeruli with the radiopaque medium (×25) (From J. G. Maier and G. W. Casarett: Patho-Physiologic Aspects of Radiation Nephritis in dogs. University of Rochester, with permission)
4 Clinical Syndromes (Endpoints)
The findings associated with radiation nephropathy can be divided into subclinical and clinical (Table 2). The SOMA-LENT system also provides a means to segregate and grade renal injury (Table 3). The K/DOQI stages of chronic kidney disease are shown in Table 4. Its modern congener, the BMT nephropathy syndrome, has been defined as azotemia (doubling of baseline serum creatinine level or a >50 % decrease in the GFR), hypertension and anemia after HSCT, in the absence of other identifiable cause of kidney dysfunction and in the absence of nephrotoxic medications (Cohen et al. 1993). It occurs at a median time of 8–12 months after the HSCT. Anemia is more severe in radiation nephropathy than it is in other causes of chronic renal failure. Features of hemolytic-uremic syndrome, with microangiopathic hemolytic anemia and thrombocytopenia, are not uncommon in the radiation nephropathy after TBI (Cruz et al. 1997), and less common in radiation nephropathy after non-TBI associated renal radiation (Tables 2, 3 and 4).
Table 2
Representative radiation-associated kidney toxicity endpoints segregated as shown
Global | Imaging/regional | ||
|---|---|---|---|
Physiologic | Biochemical | ||
Subclinical | Elevated blood pressure Increased weight | Elevated serum creatinine Elevated cystatin C Elevated serum urea nitrogen Elevated serum beta2 microglobulin Elevated urine beta2 microglobulin Reduced glomerular filtration rate Decreased creatinine clearance Proteinuria Urine casts Hematuria Anemia | Reduced glomerular function, GFR 99m Tc-diethylene-triamine-penta-acetic acid (99m Tc- DTPA) renography Reduced tubular function 99mTc-dimercapto-succinyl acid (99mTc-DMSA) scintigraphy Perfusion deficits on scintigraphy I-131 radio-hippurate Asymmetric uptake of IV contrast on CT Kidney atrophy |
Clinical | Malignant hypertension Headache Edema Dyspnea Fatigue Nausea Vomiting Confusion Coma Death | – | |
Table 3
LENT SOMA kidney
Grade 1 | Grade 2 | Grade 3 | Grade 4 | ||
|---|---|---|---|---|---|
Subjective | |||||
Symptoms | Fatigue, headache | Obtundation, oliguria, edema | |||
Objective | |||||
Blood pressure | systolic ≤ 20 over normal diastolic ≤ 10 over normal | systolic > 20 over normal diastolic > 10 over normal | Malignant hypertension | ||
Hematuria | Microscopic | Intermittent macroscopic | Persistent macroscopic | Refractory | |
Edema | None or transient | Pedal; 2+–3+ | Pedal 4 +, edema of lower leg(s) | Uremic coma, anasarca | |
Specific gravity | Urine SpG decreased | ||||
Management | |||||
Blood pressure/renal failure | Diet | Antihypertension medication | Dialysis, unilateral nephrectomy | Permanent dialysis or renal transplant | |
Hematuria | Iron therapy | Occasional transfusion or single cauterization | Persistent transfusion or coagulation | Surgical intervention | |
Analytic | |||||
Proteinuria | <3 gm/l | 3–10 gm/l | >10 gm/l | Nephrotic syndrome | |
Creatinine clearance | 5–10 % decrease | >10—30 % decrease | >30–60 % decrease | >60 % decrease | |
Creatinine | 1.25 × normal–2.5 × normal | >2.5 × normal–5 × normal | >5 × normal–10 × normal | >10 × normal | |
B2 Microglob | >2 × normal–4 × normal | >4 × normal | |||
Glomerular filtration rate | Quantification of filtration rate | ||||
Renal scanning | Assessment of renal size and radioisotope clearance | ||||
Table 4
K/DOQI stages of chronic kidney disease (kidney disease occurring for >3 months), from www.kidney.org
Stage | Description | GFR (mL/min/1.73 m2) |
|---|---|---|
1 | Kidney damage with normal or ↑ GFR | ≥90 |
2 | Kidney damage with mild ↓ GFR | 60–89 |
3 | Moderate ↓ GFR | 30–59 |
4 | Severe ↓ GFR | 15–29 |
5 | Kidney failure | <15 (or dialysis) |
Radiation nephropathy can present in an acute and/or chronic form. The acute form may present with azotemia, hypertension, and anemia at several months after RT. In the chronic form, radiation nephropathy is generally subclinical within the first 6 months. Signs (e.g. decreased GFR, increased serum beta-2 microglobulin) and symptoms (e.g. edema) may develop in the sub-acute period (6–18 months). Chronic injury (>18 months following RT) is characterized by benign or malignant hypertension, elevated creatinine, anemia, and renal failure (Rubin and Casarett 1968; Verheij et al. 1994). Other signs and symptoms include dyspnea on exertion, headaches, fatigue, and papilledema. There are other causes of renal disease in subjects who have undergone TBI and HSCT. These include, for instance, membranous nephropathy, that occurs typically in association with graft versus host disease. It occurs at more than a year after HSCT, and there is generally more proteinuria in membranous nephropathy than there is in BMT nephropathy.
The long latency for clinical kidney toxicity was highlighted by Luxton in the 1950s (Luxton 1953). The time from bilateral kidney irradiation to clinical symptoms ranged from 1 to 9 months in the acute presentation and ranged from 18 to 62 months in the chronic presentation of radiation nephropathy. In another study, 67 patients with peptic ulcer disease, without preexisting hypertension, were treated with ≈20 Gy delivered over 3 weeks, to volumes that encompassed the left kidney (Thompson et al. 1971). Thirty-one patients (46 %) developed kidney toxicity 8–19 years following RT, including seven patients with fatal uremia (5) or malignant hypertension (2). The degree of shrinkage of the irradiated kidney relative to the spared kidney was related to the dose delivered. At autopsy, atrophy of the irradiated kidney with degenerative changes of the small and medium arteries was seen (Thompson et al. 1971). This long latency period may be due to radiation induced renal injury to the left kidney which resulted in hypertension, with resultant hypertension-induced renal injury to the right kidney. Hypertension-related renal injury is known to have a long latency. Latency may also be related to the radiation dose delivered, with a longer latency in patients receiving lower doses. Our ability to fully understand the effects of partial kidney irradiation is hindered by the long latency for RT-induced kidney injury and the high prevalence of factors other than radiation that may damage the kidneys.
4.1 Symptoms and Signs
Symptoms and signs of renal failure are related to the degree of impairment, and change in the GFR (Fig. 6) (Cohen and Robbins 2003). Changes on physical examination are usually not apparent until at least half of the normal kidney function is lost. Anemia is related to the serum creatinine level, but other factors can contribute. When the kidney function is less than 25 % of normal, hypocalcemia and muscle cramps can occur. Anorexia may occur when the GFR is less than 20 mL/min. Nausea and vomiting are later manifestations of renal failure, not usually occurring until the GFR is less than 10 mL/min.
Fig. 6
Relationship between the level of kidney function and signs and symptoms. Features that may be absent are in parenthesis. Kidney function is shown as the serum or plasma creatinine in mg/dL and as the approximate corresponding glomerular filtration rate in mL/min (GFR). The downward directed arrows display the progressive nature of renal failure. Reproduced from Cohen et al. (2005) with permission
For classic radiation nephropathy, if no changes in renal blood perfusion or GFR are observed within 2 years following RT to kidneys, then subsequent chronic injury is less likely (Cohen and Robbins 2003). However, fibrosis from radiation injury to the bladder or ureters may manifest as obstructive renal failure very late, e.g., more than 10 years after irradiation. Even if clinical symptoms do not occur following kidney RT, the patient’s reserve for future renal insults, including chemotherapy or re-irradiation, may be reduced.
4.2 Renal Function Tests/Radiology
Tables 2 and 3 outline different serum markers and imaging tests that have been used to estimate or measure the GFR or other aspects of renal function (Tables 2 and 3). The LENT SOMA table provides an overview of the subjective symptoms, objective findings, the management required for both, and the analytic testing.
5 Radiation Tolerance and Predicting Radiation Nephropathy
The existing literature on radiation nephropathy is largely derived from patients treated without CT-based planning, and with delivery techniques associated with substantial dosimetric uncertainty, for instance the moving strip technique used for whole abdominal irradiation. Even with modern planning, kidney movements with breathing are not usually accounted for, introducing uncertainty in the delivered versus planned kidney doses (Moerland et al. 1994; Ahmad et al. 1997). Thus, breathing motion may increase the kidney doses compared to what was planned in large field abdominal radiation therapy (RT) plans in which kidney blocks or attenuators have been used to reduce the kidney doses.
5.1 Radiation Dose Time Fractionation
There is a dose–response effect for non-TBI whole kidney irradiation (Kunkler et al. 1952; Luxton 1953; Keane et al. 1976; Cohen and Creditor 1983; Markoe et al. 1989; Irwin et al. 1996; Schneider et al. 1999) (Fig. 7a). This is consistent with prior reviews (Emami et al. 1991; Cassady 1995) that have suggested a total dose associated with a 5 % risk of injury at 5 years, TD5/5, of 18–23 Gy and a total dose associated with a 50 % risk of injury at 5 years, TD50/5, of 28 Gy, in 0.5–1.25 Gy per fraction. Decreases in creatinine clearance have been observed following 10–20 Gy to both kidneys, in 0.8–1.25 Gy per fraction (Schneider et al. 1999). A summary of studies of bilateral whole kidney irradiation is shown in Table 5. For bilateral whole kidney irradiation, the recent QUANTEC review concluded that the risk of clinically relevant renal dysfunction will be <5 % if the mean dose is <15–18 Gy (Marks et al. 2010, Dawson et al. 2010).
Fig. 7
a Correlation of doses associated with radiation nephropathy following bilateral kidney irradiation that is not part of TBI (excluding the series from Thompson, which is of unilateral kidney radiation), based on review of literature, modified from Cassady et al. with permission (Cassady 1995) (modified from Cassidy with permission) b Estimates of regions of a combined kidney dose–volume histogram (DVH) associated with minimal (<1 %), moderate (>5 %), high (>15 %) and very high (>50 %) risk of radiation nephropathy. The risk threshold curves were made from dose volume constraints used clinically, associated with various risks of renal injury. The actual risks associated within each region on its own or in combination are highly plan-specific and associated with substantial uncertainty. The risk in dotted region is undefined
Table 5
Selected studies of 10 or more patients treated with bilateral whole kidney irradiation (non-TBI)
Author | Number of patients | Disease | Chemotherapy | Dose (Gy) | Dose per fraction (Gy) | Incidence of injury | Endpoint |
|---|---|---|---|---|---|---|---|
Kunkler (1952) | 55 | seminoma | – | 23 | 0.92 | 2/18 (11 %)^ | RF (sBP > 160 mm + albuminuria) |
ovarian cancer (5) | none | 28 | 1.12 | 18/25 (51 %)^ | RF (sBP > 160 mm + albuminuria) | ||
Avioli (1963) | 10 | gynecologic cancer (8) | none | 7.5–16.5 | 0.5–1.1 | 0/5 | No change in GFR; no HTN or RF |
sarcoma (1), seminoma (1) | – | 20–24 | 1.0–1.2 | 4/5 | Reduced GFR (75-83 %), no HTN or RF | ||
Irwin (1996) | 60 | ovarian cancer | none | 7–23 | 1–1.25 | 5/60 | New HTN |
NHL, carcinoid | – | No change in CrCl | |||||
Schneider (1999) | 56 | ovarian | Cisplatin (n = 25) | 5–17 | 0.65–1.15 | 71–76 % | Reduced CrCl by > 2 mL/min/year |
5.2 Dose Volume (Partial Kidney Irradiation)
Nephrectomy may be associated with subclinical elevations in serum creatinine and late chronic kidney injury of the remaining kidney, as opposed to “nephron sparing” partial nephrectomy (Lau et al. 2000); (McKiernan et al. 2002). Similarly, partial kidney irradiation may cause less overall reduction of kidney function than would whole kidney irradiation. It is important to define the limits of irradiated kidney volume that may result in later injury. This analysis is complicated by the secondary effects of local kidney injury and scarring that may lead to hypertensive injury of the remaining kidney volume (Table 6).
Bilateral uniform kidney doses |
|---|
TBI: Mean kidney doses ≤10 Gy (in 5–6 fractions), dose rate ≤10 cGy/min a |
Other: Mean kidney doses <15–18 Gy (over 5 weeks) b |
Non-uniform kidney recommendations (25 fractions) |
|---|
Maximally spare as much of kidney volumes as possible (<6 Gy) |
Each kidney mean dose <18 Gy (over 5 weeks) |
If one kidney mean dose >18 Gy, maximally spare other kidney (V6 Gy <30 %) |
Combined partial kidney irradiation (25 fractions) |
|---|
V28 Gy < 20 % c |
V23 Gy < 30 % c |
V20 Gy < 32 % d |
V12 Gy < 55 % e |
There are many studies describing partial kidney tolerance to irradiation, using a variety of endpoints for kidney injury (ranging from subclinical to clinical renal failure) (Kunkler et al. 1952); (Thompson et al. 1971); (Jansen et al. 2007); (Willett et al. 1986); (Burman et al. 1991); (Nevinny-Stickel et al. 2007); (Kim et al. 1984); (Birkhead et al. 1979; Varlotto et al. 2006); (Dewit et al. 1993; Kost et al. 2002); (Flentje et al. 1993); (Kim et al. 1984; Welz et al. 2007); (Kim et al. 1980); (Avioli et al. 1963); (LeBourgeois et al. 1979). The dose/volume/outcome relationship, and resultant dose volume constraints are summarized in Table 6, and Figs. 7 and 8. The recent QUANTEC review concluded that the risk of clinically relevant renal dysfunction will be <5 % if the percent volume of kidney receiving ≥12 Gy (V12) is <55, percent volume of kidney receiving ≥20 Gy (V20) is <32 %, percent volume of kidney receiving ≥23 Gy (V23) is <30 %, and percent volume of kidney receiving ≥28 Gy (V28) is <20 % (Marks et al 2010, Dawson et al 2010).
Fig. 8
a Dose-dependent loss of kidney function, from a study of 108 children who underwent nephrectomy, predominantly for Wilms’ tumor, who received radiation therapy to the contralateral remaining entire or partial kidney, made from data from Mitus et al. published in 1969 (Mitus et al. 1969). The percent of patients with impaired creatinine clearance (CrCl) is shown, defined as <63 ml/min/m2, relative to dose delivered. The width of the bars represents the range of doses delivered in each subgroup. 29 of 70 patients developed renal impairment following low doses (8–12 Gy); 15 of 27 patients developed renal injury following 12–24 Gy, and 10 of 11 patients who received more than 24 Gy developed renal injury. b Modified dose response curve for increased creatinine or hemolytic uremic syndrome following total body irradiation from Cheng et al. (2008), with permission. Open diamonds represent the fitted data points for studies that included adults alone or adult/pediatric mixed populations (with or without nephrotoxic (NT) drugs). The solid squares represent the fitted data points for the same population excluding those treated without NT drugs, cyclosporine, teniposide, or fludarabine. The fractionation schemes were converted into “equivalent” doses delivered in 6 fractions at a dose rate of 10 cGy/min, as described by Cheng et al. (2008). Model 3 includes all patients treated with or without NT drugs, while model 4 excludes patients treated with NT drugs (modified from Cheng et al. 2008 with permission)
Related posts:
Stay updated, free articles. Join our Telegram channel

Full access? Get Clinical Tree


