Fig. 30.1
Paieon’s C-THV system using first aortogram and marking orientation of the aorta
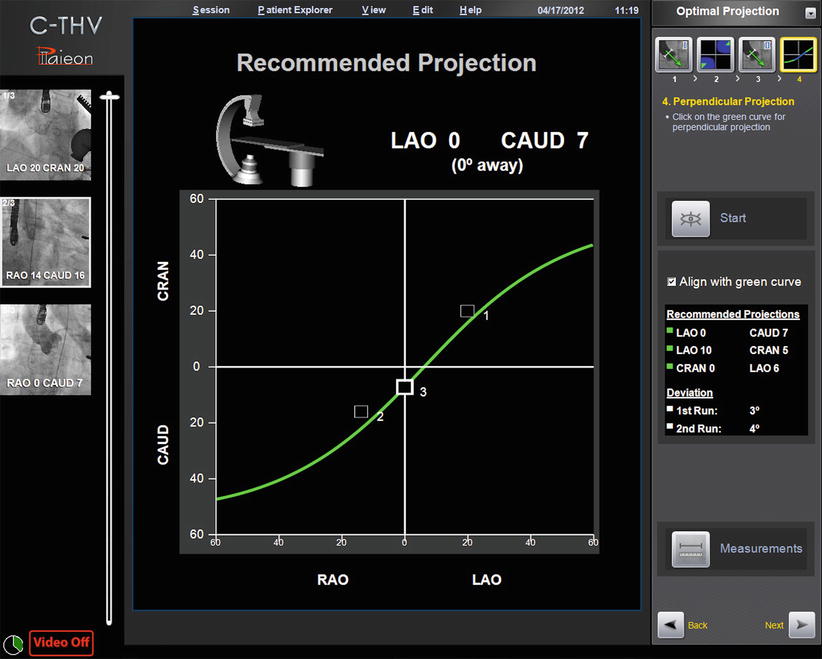
Fig. 30.2
Paieon’s C-THV system showing multiple angle of perpendicularity based on two angiograms (#1 and 2). Angiogram #3 is on the curve and represents the projection chosen by the operator
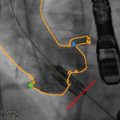
The C-THV system can also be used as an adjunctive imaging tool during valve positioning. Its ability to track calcification with real-time fluoroscopy allows the system to display a target line representing the aortic annulus plane (Fig. 30.3). During THV positioning, a yellow line denotes the annulus, while two green lines localize to the zone of the THV that is to be positioned at the annular level (Fig. 30.4).
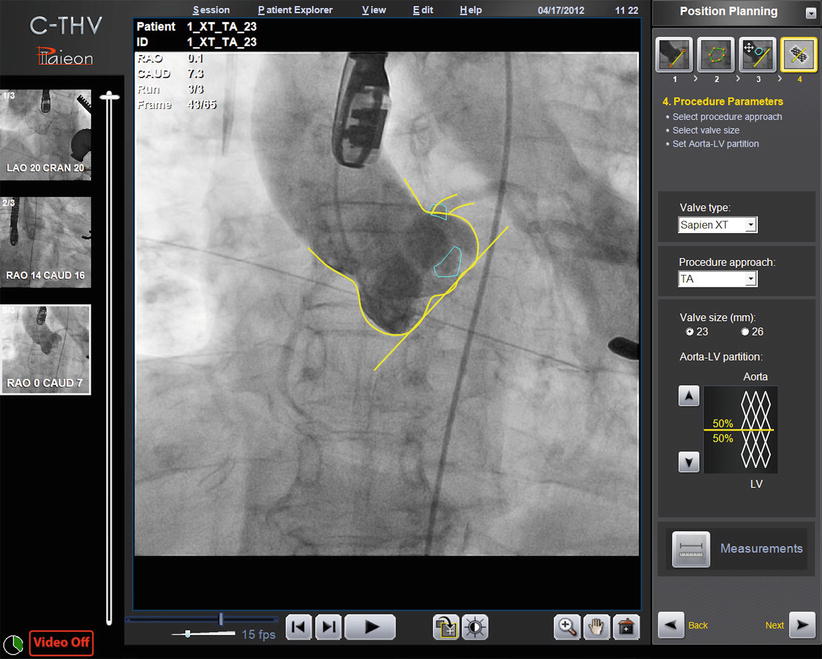
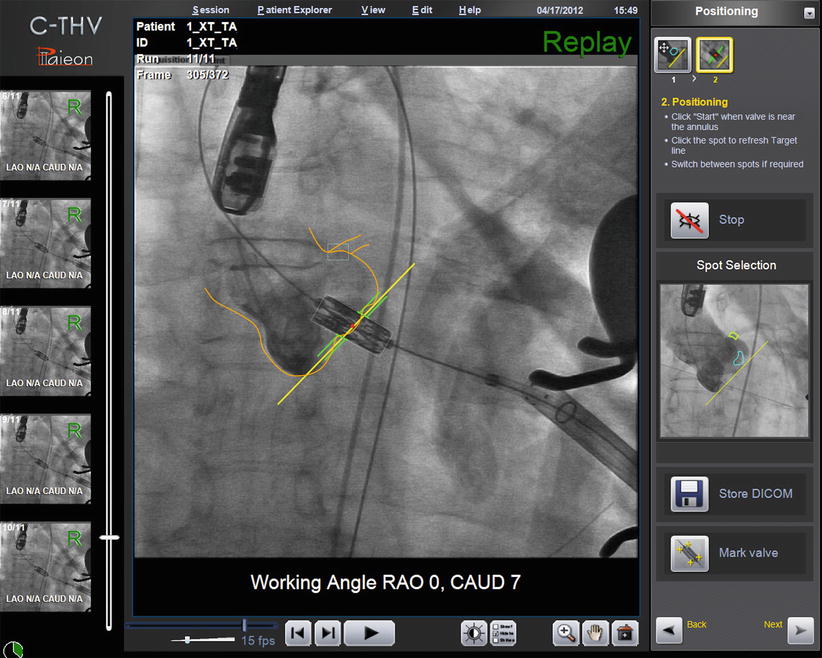

Fig. 30.3
Paieon’s C-TVH system showing contour tracking and the annulus target line

Fig. 30.4
Paieon’s C-THV system during THV positioning. The contour of the aorta and the annulus line are shown in yellow. The green lines represent the middle of the THV, which should be deployed at the level of the aortic annulus. The system allows different configuration of the green lines (e.g., 60 % aortic, 40 % ventricular)
Finally, the C-THV system allows post-deployment measurements in order to assess THV expansion (Fig. 30.5). This modality has not yet been validated clinically although in rare cases has allowed operators to recognize THV under-expansion. Given these attributes, the Paieon system has been used as a research tool to evaluate additional stent expansion after balloon expandable THV post-dilatation [11].
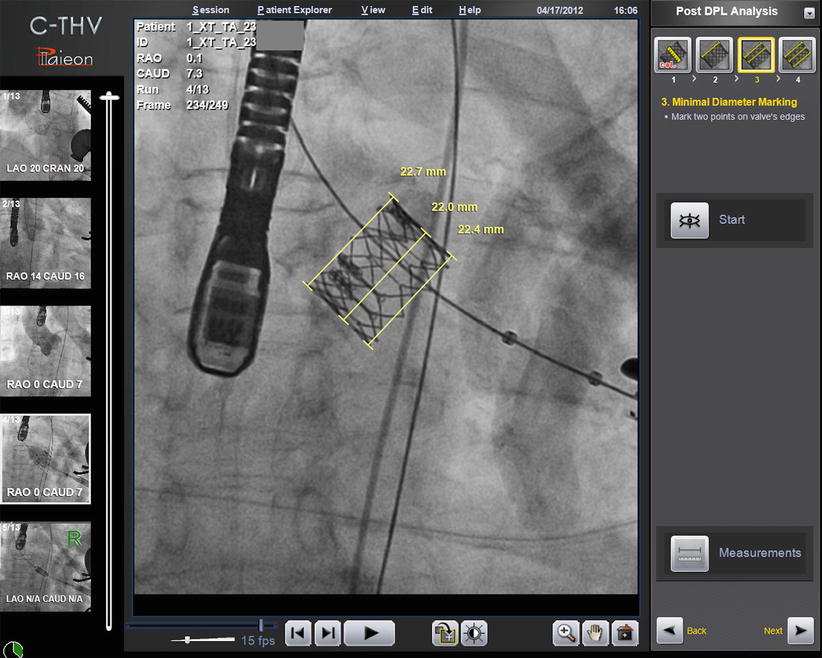

Fig. 30.5
Paieon’s C-THV system post-deployment analysis showing inflow, mid, and outflow dimension of the THV stent
Rotational Angiography
Rotational angiography is a technology that utilizes an X-ray tube and flat panel detector system to acquire and allow construction of 3D images of both vascular and soft tissue structures. This is accomplished by rotating the C-arm around the patient (200–220°) while collecting an array of equally spaced 2D X-ray projection images and then using algorithms to reconstruct a 3D image. This technology is now available from many manufacturers of cardiac catheterization laboratory suites: Siemens AG (Erlangen, Germany), GE Healthcare (Chalfont St Giles, UK), and Philips Healthcare (Best, the Netherlands). While this technique was at first limited to imaging high-contrast structures such as bone and contrast-filled vessels, the availability of flat panel detectors has enabled the ability to obtain CT-like images of soft tissue. This technology has recently been adapted for imaging dynamic structures such as the beating heart [12].
This adaptation of rotational angiography to the beating heart consists of making multiple sweeps (as opposed to the single sweep used for imaging static structures) while recording the ECG—such that a single arc of image data can be collected for one phase of the cardiac cycle via retrospective gating—and a 3D image for that phase can then be reconstructed. Rotational angiography has been successful at imaging heart structures including the four cardiac chambers, pulmonary outflow tract, pulmonary veins, and proximal coronary arteries. With the use of rapid ventricular pacing during aortography, single-sweep imaging of the ascending aorta can be performed with excellent resolution. This new technology has now been applied to TAVR. It has been combined with software dedicated to identify the plane of the aortic annulus and aortic dimensions in various packages (Syngo X Workstation, Siemens Healthcare; Innova 3D cardiac, GE Healthcare; HeartNavigator, Philips Healthcare). Evidence of its utility predicting projection angles and for annular dimension assessment is accumulating.
Evidence Supporting Use of Rotational Angiography
Bai et al. evaluated radiation dose of MDCT compared to rotational angiography or C-arm CT, or DynaCT (Siemens AG, Erlangen, Germany) [13]. For all scanning protocols evaluated, a significant reduction in organ dose with DynaCT was observed as compared to MDCT with comparable image quality. More recently, Binder et al. evaluated the efficacy of angiographic 3D reconstruction using DynaCT to predict optimal deployment projection for TAVR and compared it with MDCT [14]. 3D angiography (3DA) images were acquired during rapid ventricular pacing (160–180 bpm) and a breath hold. A 6 F pigtail catheter positioned in the noncoronary cusp was used to inject 32 mL of contrast at 8 mL/s (or 20 mL of contrast diluted with 40 mL of normal saline injected at 15 mL/s). Volume sets from rotational angiograms were reconstructed using a dedicated workstation (SyngoX Workstation, Siemens Healthcare, Erlangen, Germany) that automatically depicted the aortic valve cusps and generated a circle indicating the annular plane (Fig. 30.6). Predicted projections were compared with post-deployment projections showing superposition of anterior and posterior stent struts. 3DA was obtained in 40 patients (68 % also had a MDCT) with image quality was inadequate in 1 patient. There was a significant correlation between 3DA and MDCT for prediction of perpendicular views (r = 0.682; p < 0.001). The shortest distance from the post-deployment perpendicular prosthesis projection to the regression line was shorter for 3DA (5.1 ± 4.6°) than for MDCT (7.9 ± 4.9°; p = 0.01). Despite these small differences, this study confirmed the feasibility of 3DA to identify a perpendicular angle.
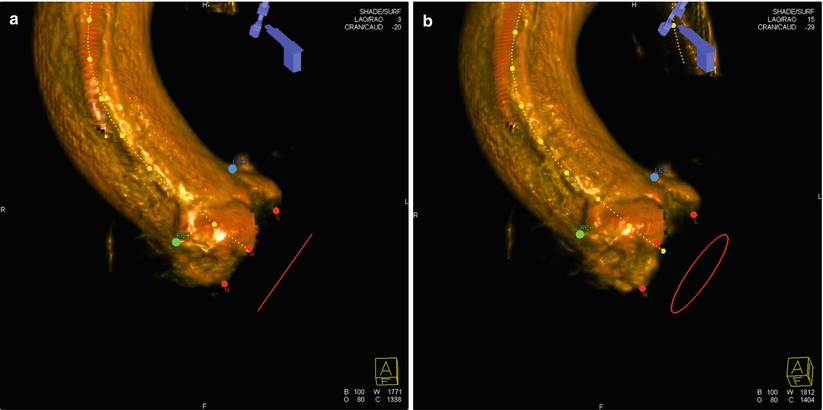

Fig. 30.6


Rotational angiography using DynaCT and the Syngo software for 3D reconstruction. The red dots represent the nadir of each cusp. The blue dot represents the ostium of the left main coronary artery and the green dot the ostium of the right coronary artery. In panel (a), all cusps are aligned on the same plane and the red circle is seen as a line. In panel (b), the circle is seen since the cusps are not aligned in the same plane
Stay updated, free articles. Join our Telegram channel

Full access? Get Clinical Tree


