Edwards Sapien XT
Medtronic CoreValve
Annulus size and prosthetic valve size
18–22 mm Ë 23 mm valve
20–23 mm Ë 26 mm valve
21–25 mm Ë 26 mm valve
24–27 mm Ë 29 mm valve
25–27 mm Ë 29 mm valve
Sinus of Valsalva diameter
N/A
>27 mm
Sinotubular junction diameter
N/A
<43 mm
Distance to the coronary ostia
>10 mm
>10 mm
Aortic Annulus Anatomy
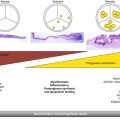
The aortic annulus is an elliptoid structure that is a part of the fibrous skeleton of the heart, which functions to support the valve and the aortic root against high pressures that occur during left ventricular systole (Fig. 25.1). The aortic annulus is a complex three-dimensional structure, which is usually described as semilunar and crown-like [21, 22] (Fig. 25.2). The aortic valve leaflets are attached throughout the length of the aortic root, forming the “three-pronged coronet,” while the hinges form the supporting structure creating a crown-like ring [22] (Fig. 25.3). The base of this crown represents the inlet from the left ventricular outflow tract into the aortic root [22], and the top of the crown represents the outlet of the aortic root into the descending aorta [22]. The aortic annulus measurement, regardless of modalities used, is assessed at the base of the crown in systole.
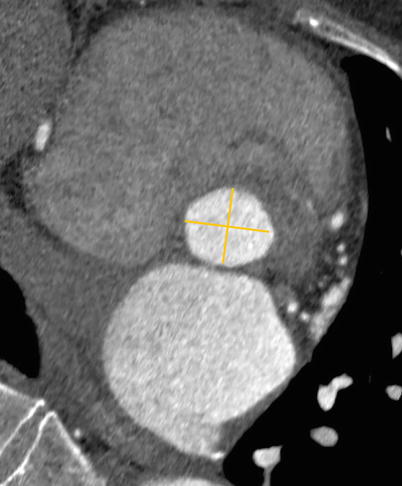
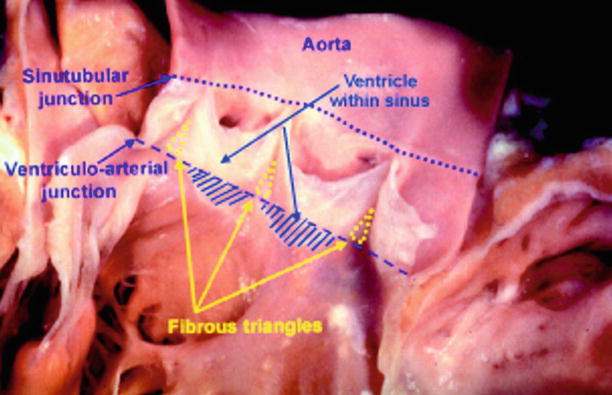
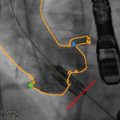
Fig. 25.1
Double oblique transverse reconstruction of the aortic root below the commissural insertion in an 83-year-old female with severe aortic stenosis, demonstrating an elliptical structure (the yellow lines demonstrate the minimal and maximal annular diameter)
Fig. 25.2
The aortic root has been opened through a longitudinal incision across the area of aortic-mitral valvar continuity and spread open to show the semilunar attachments of the valvar leaflets
Fig. 25.3
Diagram of aortic root anatomy showing its considerable length along with coronet shape and location of various annular planes
The ring of collagenous tissue that forms the aortic annulus ring surrounds and supports the aortic orifice. The noncoronary and left coronary leaflets are parts of the fibrous tissue, which along with the anterior leaflet of mitral valve, form the fibrous trigones [22]. These trigones anchor the roof of the left ventricle to the aortic-mitral valvular unit. This complex anatomy along with its obliquely aligned and ovoid structure leads to obstacles in performing measurements using different imaging modalities.
Aortic Annulus Measurement: Comparison of Different Imaging Modalities
Traditionally, two-dimensional (2D) echocardiography has been the most utilized method for measuring aortic annulus based on its availability. The current American Society of Echocardiography and European Association of Echocardiography recommend measuring the aortic annulus from inner edge to inner edge in mid-systole using parasternal long-axis view on the transthoracic echocardiography (TTE) while zooming in on the left ventricular outflow tract (LVOT) [23]. In addition, the aortic annulus can be measured at the long axis (120° view) using 2D transesophageal echocardiography (TEE). Unfortunately, despite its wide availability, 2D TTE and TEE have several limitations, including diameter measurements being based on a single annular plane as well as the assumption of circular annular geometry, when in fact the annular geometry is often oval in shape.
A recent study by Ng et al. compared the 2D circular, 3D circular, 3D planimetered annular, and LVOT areas by TEE, with MDCT planimetered areas used as a “gold standard” in 53 patients undergoing TAVR with the Edwards Sapien valve for treatment of severe symptomatic AS [24]. The mean MDCT planimetered annular area (4.65 ± 0.82 cm2) before TAVR was significantly higher than 2D TEE circular (3.89 ± 0.74 cm2, p < 0.001), 3D TEE circular (4.06 ± 0.79 cm2, p < 0.001), and 3D TEE planimetered annular areas (4.22 ± 0.77 cm2, p < 0.001). The 3D TEE planimetered annular areas had the best agreement with respective MDCT planimetered areas.
These investigators also assessed the clinical significance of underestimating the aortic annular cross-sectional areas and noted that based on recalculated preoperative aortic valve areas using 3D TEE circular, 3D TEE planimetered, and MDCT planimetered annular areas, a respective 10, 25, and 25 % of patients were recategorized into moderate aortic stenosis based on current guidelines [24]. Furthermore, it was also noted that following TAVR, the MDCT planimetered (4.65 ± 0.82 vs. 4.20 ± 0.46 cm2, p < 0.001) and 3D TEE planimetered (4.22 ± 0.77 vs. 3.62 + 0.43 cm2, p < 0.001) annular areas decreased, due to the “new effective” aortic annulus, assuming the internal dimensions of the circular prosthetic valve. Finally, Ng et al. noted that although 3D TEE can avoid the circular geometric assumptions made by 2D and 3D circular measurements (by directly performing planimetry of the cross-sectional annular/LVOT areas), it still underestimated annular areas by up to 10 % compared to respective MDCT planimetered areas, based on the CT’s superior spatial signal-to-noise ratio [24].
Two additional studies also compared echocardiography versus MDCT with direct intraoperative sizing. Kempfert et al. assessed aortic annular size in 26 patients with severe AS undergoing standard SAVR [25]. They measured maximal, minimal, and mean diameter using MDCT, as well as measuring “effective diameter.” The “effective diameter” was defined as the diameter of a circle with the exact same area as the measured area of the annular circumference reconstructed from the MDCT data set. They noted the best agreement between intraoperative direct sizing and MDCT effective diameter as well as end-systolic echocardiographic diameters, although the MDCT effective diameter was larger. However, they noted that in patients with oval-shaped annulus, the MDCT effective diameter had the best agreement in intraoperative sizing [25]. A second study by Dashkevich et al. compared aortic annular diameter measured with MDCT and TEE versus direct intraoperative measurements using a Hegar dilator, in 33 patients with severe aortic stenosis undergoing SAVR [26]. They found that the calculated average diameter by MDCT correlated very well with intraoperative measurements (r = 0.923, p < 0.001) and with the size of implanted valve (r = 0.867, p < 0.001), while correlation of TEE and intraoperative measurements was only satisfactory (r = 0.523, p = 0.002) [26]. They also noted that TEE tended to underestimate the dimensions of aortic annulus.
The aortic annulus is routinely larger when measured by MDCT compared to 2D or 3D TEE measurements. Further, the discordance between MDCT and TTE or TEE is greater than the differences between TTE and TEE [27]. The differences in size could be related to geometrical assumptions by echocardiography that the aortic annulus is circular. A study by Tops et al. evaluated aortic annulus diameter in 169 patients, who had undergone 64-slice MDCT for evaluation of coronary artery disease [28]. They noted that in 47 % of patients the difference between coronal and sagittal diameters was ≥3 mm, indicating an oval-shaped aortic annulus [24]. Another study by Delgado et al. also noted significant difference between mean coronal (25.1 ± 2.4 mm) and sagittal (22.9 ± 2.0 mm) diameter (p < 0.001) in 53 patients with severe aortic stenosis undergoing TAVR [29].
However, it is important to note that the aortic annulus is a dynamic structure and is noted to become less ellipsoidal and more circular during systole [30]. A study by Hamdan et al. evaluated the deformation dynamics of the aortic annulus in 35 patients with aortic stenosis and 11 normal subjects undergoing 256-slice computed tomography [30]. They noted that in both subjects with normal and stenotic valves, the minimum diameter increased in systole and the ellipticity index decreased. However, despite these dynamic changes, the perimeter increase was negligible in patients with calcified valves (0.56 ± 0.85 %; p < 0.001) and small even in normal subjects (2.2 ± 2.2 %; p = 0.01). These findings are consistent with another study by Bertaso et al., which also demonstrated a small (<1 mm) but statistically significant difference in aortic annulus dimensions between diastole and systole in patients with severe AS referred for TAVR [31].
In addition to its dynamic nature across the cardiac cycle, the annular size is also dependent on left ventricular function [32]. Ng et al. compared mean aortic annular diameter and geometries between 90 patients with severe AS and 111 controls based on MDCT measurements [32]. It was noted that patients with severe AS had similar aortic annular dimensions and geometries when compared to controls, even after correcting for baseline differences in age and body surface area (BSA). However, severe AS patients with LV dysfunction [left ventricular ejection fraction (LVEF) <50 %] had significantly larger mean aortic annular diameter (26.4 ± 1.9 vs. 24.5 ± 2.1 mm, p < 0.001) compared with patients with preserved LVEF [32]. The authors noted that male gender and larger body surface area were independent determinants of larger aortic annulus diameter.
Clinical Significance: Aortic Annulus Measurement by MDCT
Despite absolute differences in between aortic annular measurements between MDCT, TTE, and TEE, the significance of these differences as well as impact on procedural success remains unclear. Traditionally, aortic annulus measurements are performed using 2D TTE and TEE. Messika-Zeitoun et al. analyzed how the annulus diameter measurements using different imaging modalities might influence the TAVR strategy based on manufacturer’s recommendation in 45 patients with severe AS referred for TAVR [27]. As previously mentioned, although the overall correlation between the methods was good, the difference between MDCT and TTE or TEE was larger than the differences between TTE and TEE. Furthermore, even though the overall agreement between TTE and TEE was good (kappa = 0.68), the TAVR would have been different in 17 % of patients. The agreement between MDCT and TTE or TEE was significantly lower (kappa = 0.28 and 0.27, respectively); however, the decision based on MDCT measurements would have modified TAVR strategy in ≥40 % of patients [27]. Thirty-four patients underwent implantation based on TEE, which was successful in all but one patient with moderate to severe regurgitation.
Multiple studies have evaluated the correlation between the degree of PAR and the aortic annulus measurement using MDCT. Buzzatti et al. assessed the role of CT for evaluation of the degree of aortic regurgitation in 115 patients undergoing TAVR [33]. They noted that significant aortic regurgitation was directly related to annulus diameters, especially maximum and minimum diameters. Prosthesis-annulus oversizing, defined as the ratio between prosthesis size and mean annular size, was associated with a reduction in PAR, with a cutoff of 7 % as the limit below which the degree of aortic regurgitation increased. Another study by Wilson et al. analyzed 3D aortic annular dimension using MDCT for prediction of paravalvular aortic regurgitation following TAVR in 109 consecutive patients undergoing TAVR with a balloon-expandable aortic valve [34]. Moderate or severe PAR was again noted to be associated with prosthesis undersizing, defined as the prosthesis diameter minus mean diameter. They also found that the aortic valve prosthesis was undersized relative to MDCT-derived mean diameter and area in 35.3 and 45.1 % of cases, respectively [34]. In addition, the authors noted that oversizing of the prosthesis may reduce the risk of moderate or severe PAR. A third study by Jilaihawi et al. evaluated the discriminatory value of MDCT annular measures for post-TAVR paravalvular aortic regurgitation compared to 2D echocardiographic measures [35]. They noted that maximal diameter minus prosthesis size based on MDCT had the highest discriminatory value for PAR (receiver-operating characteristic area under the curve = 0.82, 95 % confidence interval: 0.69–0.94; p < 0.001), while traditional echocardiographic measures were nondiscriminatory [35]. The authors also noted that the prospective application of a MDCT-guided annular sizing approach resulted in less moderate or severe PAR after TAVR than traditional echocardiographic measures (7.5 % vs. 21.9 %; p = 0.045). The authors concluded that 3D cross-sectional measures using CT, should be the new gold standard for aortic annular evaluation for TAVR.
Related posts:
 Transcatheter Aortic Valve Replacement: Current Evidence from Large Multicenter Registries
 Positron Emission Tomography Evaluation of Aortic Stenosis
 Pathologic Findings in Aortic Stenosis
 Fusion Imaging for TAVR
 Aortoiliofemoral Assessment: MDCT
 Valve-in-Valve for Transcatheter Aortic Valve Replacement: Do Imaging Requirements Change?
Stay updated, free articles. Join our Telegram channel

Full access? Get Clinical Tree


