Fig. 14.1
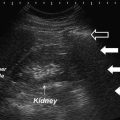
A 48-year-old female with a right congenital pelvic kidney and 1 cm stone. Note that there are no usual boundaries such as liver or spleen
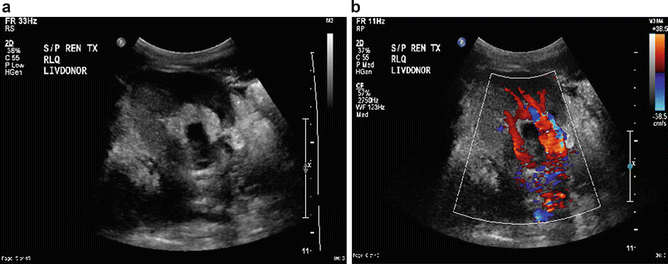
On the other hand, transplant kidneys are commonly placed extraperitoneally in the right or left lower quadrants. This anatomic arrangement provides for an easy imaging target since the distance between the skin and the kidney is short, without bowel interposition. The transplant kidney ureters are implanted into the bladder, commonly in the anterior lateral location using a modified Lich-Gregoir technique. Depending on the technique of anastomosis, there may be a nipple artifact in the bladder, which can be detected via ultrasound. Stones can be formed at this site which produces an echo during imaging. Doppler application reveals significant twinkle artifact [1] (Figs. 14.2 and 14.3).
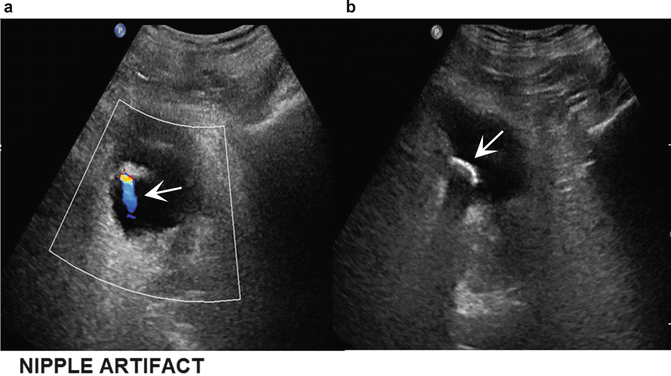
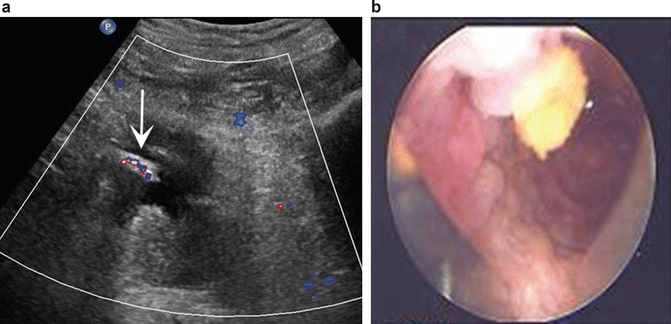
Fig. 14.2
Stone at the stump of a ureteral implant (b) with echo and posterior shadowing (arrow). Note the “twinkling” artifact with the Doppler wave (a)
Fig. 14.3
A nipple artifact (a) at the anterolateral aspect of the bladder on sonography (arrow) represents the location of an implanted ureter. Endoscopic view of stone (arrow) formation at implant (b) site
Post surgery, the hilar anatomy of a transplant kidney differs from the native kidney. In these kidneys, the pelvis is more anterior, whereas the artery and vein are situated more posteriorly. Ultrasound imaging of the transplant kidneys is performed from the anterior abdominal wall with the patient in the supine position. In the post-transplant kidney, the renal artery and vein have a different orientation. The renal artery is anastomosed to either the internal iliac end to end or external iliac artery end to side. The renal vein is anastomosed to the external iliac vein end to side. The knowledge of this altered anatomy is critical for ultrasonographer. A basic allograft ultrasound evaluation is usually performed 24–48 h post transplant unless indicated sooner due to clinical findings. A detailed examination protocol usually includes renal size, assessment of echogenicity, collecting system, ureter, and evaluation of fluid collections. Doppler imaging should assess flow in the renal and iliac vessels. Intrarenal vessels are also assessed along with flow quantification, RI, PI, and systolic to diastolic ratio [2].
Renal transplant sizes are similar to native kidneys; however, gradual increase of its dimensions can be seen over the first few weeks by up to 32 % of the initial length by the fourth week [3].
Doppler evaluation of the transplant kidney and renal vasculature is usually the first method for studying the kidney during the postoperative period for routine follow-up or when there is dysfunction noted in the graft. These applications include the assessment for rejection, renal artery stenosis, and thrombosis of the renal artery or vein. Obviously some of the drainage complications in a transplant kidney such as ureteral obstruction, leakage, urinoma, and lymphocele can also be identified with ultrasound imaging [4].
Peak systolic velocity (PSV) in transplant kidneys is usually 100 ± 25 cm/s. In cases of renal artery stenosis (RAS), the PSV is between 180 and 200 cm/s.
Renal aortic ratio (RAR) is another tool to assess the degree of renal artery stenosis, and it is calculated from the following equation:
RAR is considered normal up to 3.0, but a ratio of more than 3.5 generally indicates renal artery stenosis [5].
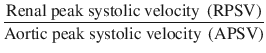
RI: A resistive index of more than 0.9 usually indicates renal transplant dysfunction. Causes of elevated RI in renal transplants are shown in (Fig. 14.4).
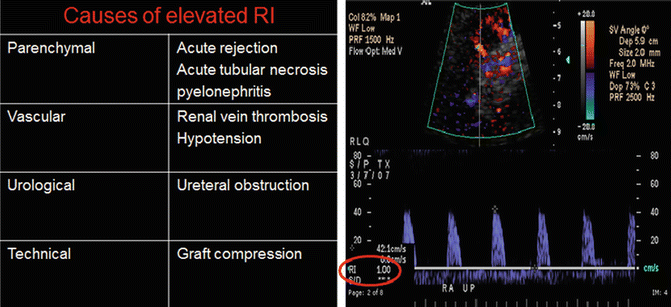
Fig. 14.4
Table showing causes of elevated RI. Doppler evaluation showing RI of 1.00 indicated a lack of diastolic blood flow: a classic finding in renal vein thrombosis (right image)
Power Doppler ( PD ), also known as nondirectional Doppler, is useful for assessing low flow states, or when optimal Doppler angles cannot be obtained. PD is 3–5 times more sensitive in depicting flow than the color Doppler imaging in all arteries (CDI) [6, 7]. Unlike CDI, PD does not provide information relative to velocity or direction of the blood flow. In transplant kidneys, PD is an invaluable tool for the evaluation of vascular thrombosis, occlusion of vessels, and evaluation of the parenchymal flow. Unlike the CDI red and blue color scheme, PD typically has a single salmon color appearance (Fig. 14.5a, b). The color schema can be changed by the sonographer. Color red is customarily assigned to arterial and color blue to venous flow. Newer versions of some of the ultrasound machines have the capability of performing directional power doppler (eFLOW) (Fig. 14.7e).
Fig. 14.5
(a) Color Doppler with red and blue bar indicating the flow towards (red) in this case egress of urine towards transducer and (blue) away. (b) Due to lack of flow on color power Doppler (salmon) color is used to assess the flow to a transplant kidney
Contrast-Enhanced Ultrasound ( CEUS ): Gray scale with color Doppler imaging remains the initial basic diagnostic procedure of transplant kidneys. Although color Doppler can assess renal arterial and venous flow, it cannot display subtle microvascular tissue perfusion which is crucial for evaluation of acute and chronic allograft dysfunction. Real-time contrast-enhanced ultrasound using gas-filled microbubbles can visualize and also quantify renal blood flow and perfusion in small arterioles and capillaries [8]. Microbubbles act as a contrast agent by creating surface between the fluid phase in blood at the outside and gaseous phase at the inside. This change of impedance and reflection enhances echogenicity of blood by a factor of 500–1000. This modality is not yet used widely in the United States. The gas is exhaled through the lungs within 20–30 min and the shell is metabolized in the liver [9]. This agent is not excreted in the urinary tract and thus cannot provide excretory urography and should not be used in patients with severe cardiopulmonary disease where as impaired renal function is not a contraindication. Impaired renal function is not a contraindication. Indications for CEUS in renal transplant include assessment of renal blood flow, vasculopathy, small peripheral infarcts, and necrosis. CEUS proved to be helpful in patients with acute rejection by showing delayed parenchymal perfusion. CEUS also has some values in prognosticating allograft function. Finally this modality also has some applications in space occupying and inflammatory lesions.
In one study 91 patients were evaluated after living renal transplant within the first week and 6 months of transplant. Resistive Index (RI), Pulsatility Index (PI), End Diastolic Velocity (EDV), graft length, and parenchymal volume were measured. It was concluded that lower RI, PI and higher EDV at 1 week predicted a better graft function at 6 months post transplantation [10]. A recent retrospective study reviewed 575 renal transplant ultrasound obtained within 4 h of surgery. The authors examined major vascular abnormalities: lack of renal artery or vein flow, elevated PSV >300 cm/s, parvus tardus waveforms, and markedly decreased or no color parenchymal flow identified the cases most likely to benefit from immediate reoperation [10].
Shear Wave Elastography ( SWE ): Shear Wave Elastography (SWE) and its variants referred to as Real Time Sonoelastography (RTS), Super Sonic Shear Imaging (SSI), Time Stress Imaging (TSI) Transient Elastography (TE) and Shear Wave Dispersion Ultrasound Vibrometry (SDUV) are the latest additions to ultrasound imaging. This is an emerging sonographic technique that permits noninvasive measurement of tissue stiffness. SWE uses focused acoustic energy pulses to produce microscopic tissue displacement which includes perpendicular shear waves that are sonographically tracked as they travel through tissue. Harder and stiffer tissues have been shown to have increased shear wave velocities. Estimates of tissue Young’s module (YM) which is expressed in Kilopascals (kPa) are derived from shear wave velocity. The ultrasound monitor has vertical color bar similar to Doppler indicating soft (benign) versus stiff (hard) tissue (tumor, fibrosis). Elastography has been shown to be a good tool for identifying fibrosis. There is a dynamic display of pressure distribution as well. In a different model of this technology, the pulses are delivered mechanically by the operator which requires a learning curve. SWE is approved in the USA for assessment of liver fibrosis in cirrhosis and outside the USA it has already been used extensively in imaging of breast and thyroid and is being evaluated for other clinical uses as well. SWE has been used for assessment of chronic kidney disease as well as renal transplants. In urology, it also has potential value in testicular and prostate imaging. Transrectal sonography with doppler and grayscale elastography can be considered a multiparametric prostate ultrasound. Patients with CKD show higher tissue stiffness with renal fibrosis as a plausible explanation. In native kidneys, the shortest distance to the kidney should be chosen to provide better images with several variables. BMI and kidney depth are the main variants. Renal allograph due to their superficial position in pelvis allows to eliminate the above variants thus rendering SWE as a valuable tool for assessment of chronic allograft dysfunction secondary to progressive interstitial fibrosis and tubular atrophy. In another study SWE results of allografts cortical stiffness was performed along with renal biopsy. This quantitative measurement showed to be promising as a noninvasive tool to evaluate global histological deterioration. In another study elastography could identify stages of renal graft damage. One study showed 94.5 % success in assessing kidney stiffness and with newer studies there appear to be adequate data to use elastography as a noninvasive method to evaluate renal allograft fibrosis , one of the first signs of graft dysfunction [11–19].
Ultrasonic Findings in Transplant Complications
Renal Cell Carcinoma : This is not a common finding in transplanted kidneys (Fig. 14.6a–d). The incidence of RCC in atrophic native kidneys is 1.1–1.55 % versus 0.22–0.25 % in transplanted kidneys [20] (Fig. 14.7a–e).
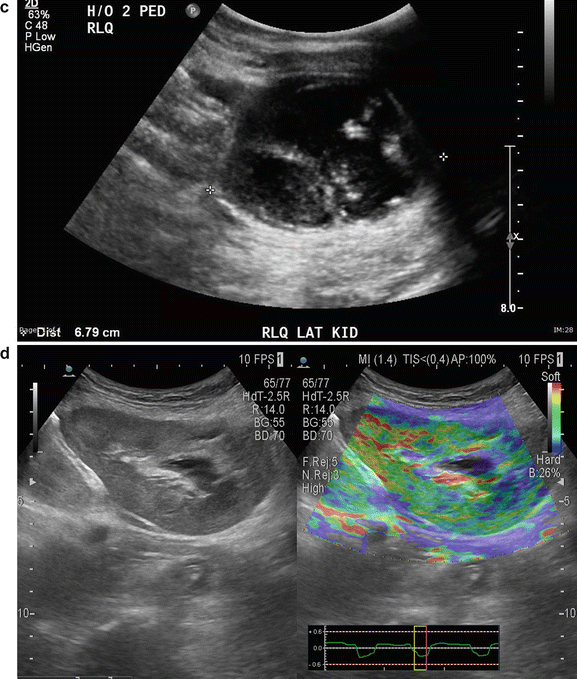
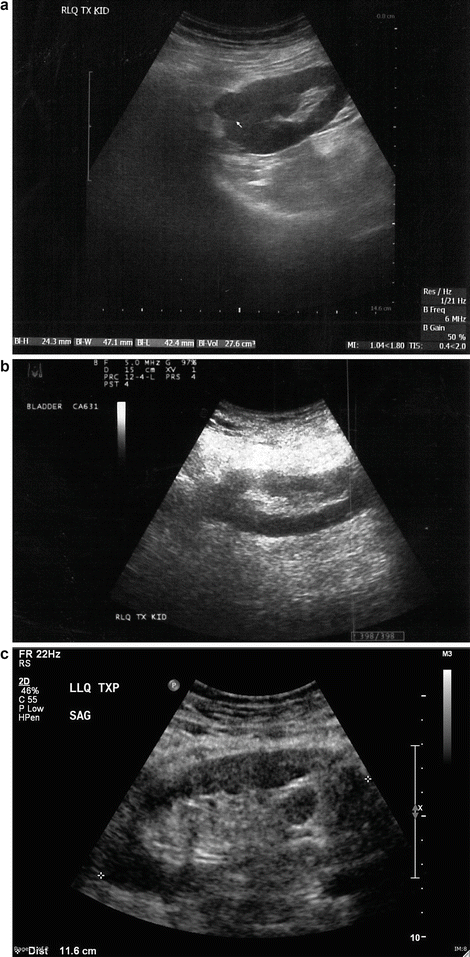
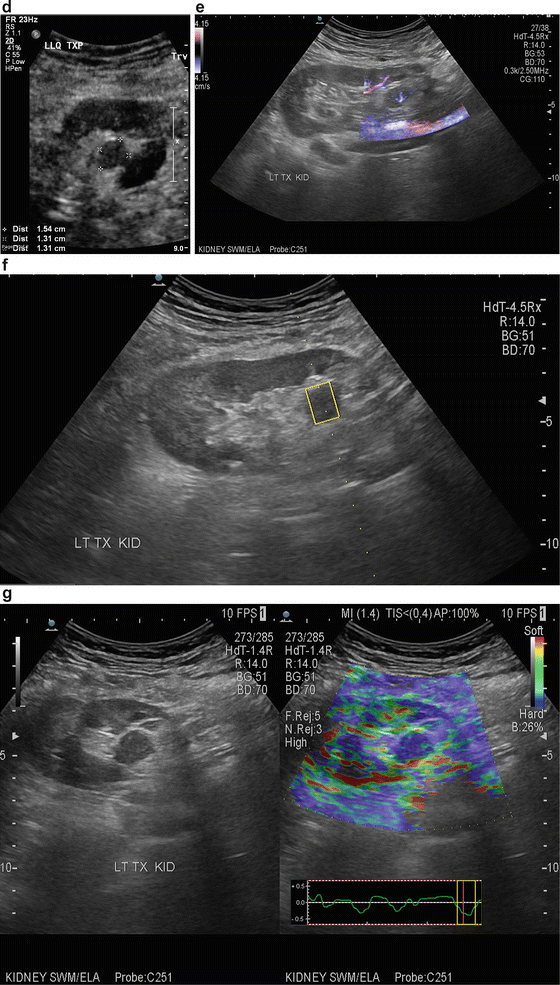
Fig. 14.6
(a) A 64-year-old female with a double pediatric kidney allograph in RLQ. (b) The lateral superior component shows a solid mass. (c) Image of the lateral kidney after microwave ablation of renal cell carcinoma. (d) Elastography of the medial noninvolved kidney shows homogenous parenchyma. The center of the kidney with the fluid represents a softer image
Fig. 14.7
(a) An 83-year-old male s/p bilateral autotransplantation for bilateral renal cell carcinoma at age 72 there was a recurrence in the RLQ which was resected. (b) At age 82 appearance of the RLQ kidney after partial nephrectomy. (c) At age 82 patient developed another recurrence in LLQ-transplanted kidney saggital view. (d) LLQ-transplanted kidney cross section view showing measurement. (e) eFLOW (sensitive power Doppler) shows presence of central flow in the lesion. (f) Shear wave measurement of the lesion. (g) Shear wave elastography of the LLQ allograft shows “tissue hardness” discrepancy. The suspected lesion is dominantly blue suggestive of tumor versus the normal parenchyma showing softer color
Transitional Cell Carcinoma : This is a very rare finding in transplanted kidneys except in southeast Asia where consumption of Chinese herbs containing aristolochic acid shows a high incidence of this disease [21]. Special follow-up attention should be given to recipients who had a high-risk donor such as history of smoking, diagnosis of urothelial carcinoma after donating a kidney and if the recipient has been exposed to such risk factors.
Acute tubular necrosis ( ATN ): In this condition, the kidney is grossly edematous, echo poor, with a lack of corticomedullary differentiation. RI is elevated to over 0.8 (Fig. 14.8). Nuclear scan is the primary imaging modality for ATN assessment .