Fig. 13.1
Schematic diagram indicating an obstructed right kidney with associated elevated resistive index
Several vascular studies use the pulsatility index parameter which is a measure of variability of blood velocity in a vessel. It represents the difference between peak systolic and minimum (end) diastolic velocities divided by the mean arterial velocity during a cardiac cycle. Assessment of RI and PI in patients with renal disease can identify patients with slow and fast progression of renal failure [35].
Diuretic Doppler ultrasound is a modification of conventional Doppler sonography to assess physiological responses of obstructed and nonobstructed kidneys to diuretic stimulation. Furosemide-enhanced diuresis leads to significant increases in the RI of obstructed kidneys, while having no effect on that of nonobstructed kidneys in adults or children. Saline loading followed by furosemide results in a divergent response with an increased RI in obstructed and a decreased RI in nonobstructed kidneys. Other factors causing elevated RI are medical renal disease, diabetic nephropathy, and external factors such as fasting and exsanguination. Recent studies documented decrease in RI with increasing heart rate and stable blood pressure and increasing RI with pulse pressure widening [36–39].
Contrast Enhanced ultrasound (CEUS) of kidneys during pregnancy has been reported only before scheduled termination of pregnancy. It may be a good tool for assessment of placental vascular insufficiency. Laboratory animal studies in pregnant rats has also shown value of this modality in evaluation of placenta [40, 41].
Resistive index is usually normal in a pregnant patient. The elevation of obstruction-related RI is thought to be due to increased renal vascular resistance secondary to elevated prostaglandins. It is recommended that, for the assessment of RI, patients should avoid the use of NSAIDs prior to ultrasound imaging. NSAIDs may interfere with interpretation which may be due to blocking prostacyclin synthesis resulting in decreased renal blood flow and mask the expected changes in RI [42]. Several NSAIDs (e.g., ketorolac, indomethacin) have been shown, in animal models, to reverse both the early vasodilation and subsequent vasoconstriction of acute ureteric obstruction [43, 44]. Measurement of RI is usually most evident during the first 6–48 h of obstruction. A difference of more than 0.1 from side to side is suggestive of obstruction. The overall sensitivity of RI for the assessment of obstruction is 42–100 %, and it is less sensitive for partial versus complete obstruction.
Anteroposterior Diameter (APD)is another method for assessing obstruction in a gravid kidney. APD is the measurement of renal pelvic dilation. Pathological obstruction is suspected if the cross-sectional measurement of the renal pelvis exceeds 27 mm on the right or 18 mm on the left during the second and third trimester. It is therefore imperative to obtain both sagital and cross-sectional images of the gravid kidney. Pathological obstruction is suspected if the APD measurement exceeds 18 mm on the right and 15 mm on the left side during the first trimester. The cross-section measurement of the renal pelvis should be in the midpole where the maximum dilation can best be assessed [45] (Figs. 13.2 and 13.3). The frequency of developing hydronephrosis is not related to the number of pregnancies [15, 46]. These changes should be interpreted in correlation with subjective and objective clinical manifestations (Table 13.1). Predominately left renal pelvic dilation with left flank pain suggests obstruction. Right flank pain with minimal to no pelvic dilation suggests no pathological obstruction (Figs. 13.4).
Fig. 13.2
Diagram depicting renal pelvic measurements
Fig. 13.3
Sagittal (a) and transverse (b) midpole ultrasound images of a pregnant patient with right flank pain, APD measurement of 27 mm is indicative of obstruction
Table 13.1
The grading of hydronephrosis during pregnancy
Grading | |
|---|---|
Grade 0 | Hydronephrosis 0–5 mm, minimal separation of central echo complex |
Grade 1 | Hydronephrosis 6–10 mm |
Grade 2 | Hydronephrosis 11–15 mm |
Grade 3 | Hydronephrosis equal or more than 16 mm. A large sonolucent sac occupies a major portion of the kidney |
Fig. 13.4
Thirty-year-old female, G2P1, at 28 weeks of gestation, presenting with left flank pain. The right kidney (RK) shows no hydronephrosis, whereas the left kidney (LK) demonstrates calyceal dilation (arrows)
Renal Pelvic APD and Calyceal Measurements Suggesting Obstruction
In early pregnancy, there is no significant difference in calyceal dilation. With the increase of gestational age, the degree of hydronephrosis increases on the right side and decreases on the left [47] (Table 13.2).
Table 13.2
AP renal pelvic and calyceal measurements suggesting obstruction
Right kidney (mm) | Left kidney (mm) | Calyceal diameter (mm) | |
|---|---|---|---|
First trimester | >18 | >15 | >10 |
Second and third trimester | >27 | >18 | >10 |
Example: Grade 1 hydronephrosis is detected bilaterally in 53 % of patients. For grade 2, the ratio changes to 35 % on the right and 14 % on the left. The following graph shows the mean calyceal diameter of the right and the left kidneys as plotted against gestational age (Table 13.3). Similar to measurement of mother’s kidneys, the obstetric ultrasound protocol requires assessment of fetal hydronephrosis. Ante Natal Hydronephrosis (ANH) is also classified based on APD. The values indicating obstruction are obviously significantly smaller due to the smaller size of fetal kidney. Table 13.4 presents a modified current classification and measurements [48].
Table 13.3
This table describes renal calyceal dilation as it relates to gestational age
Gestational age (week) | Observed percentiles | Adjusted percentiles | ||||||
|---|---|---|---|---|---|---|---|---|
Right | Left | Right | Left | |||||
50th | 70th | 90th | 90th | 50th | 75th | 90th | 90th | |
4–6 | 0.0 | 3.0 | 5.0 | 2.1 | 1.4 | 2.4 | 3.4 | 0.1 |
7–8 | 0.0 | 0.0 | 5.0 | 0.0 | 0.3 | 3.2 | 4.5 | 2.2 |
9–10 | 0.0 | 0.0 | 4.0 | 0.0 | 1.2 | 4.0 | 5.7 | 3.5 |
11–12 | 0.0 | 5.0 | 7.0 | 6.0 | 2.0 | 4.9 | 7.0 | 4.5 |
13–14 | 0.0 | 5.8 | 8.0 | 6.9 | 2.7 | 5.7 | 8.4 | 5.3 |
15–16 | 0.0 | 1.0 | 8.9 | 4.9 | 3.0 | 6.7 | 9.8 | 6.0 |
17–18 | 5.0 | 9.5 | 12.0 | 8.8 | 3.7 | 7.6 | 11.2 | 6.6 |
19–20 | 0.0 | 8.0 | 11.0 | 7.7 | 4.2 | 8.6 | 2.6 | 7.1 |
21–22 | 5.0 | 9.0 | 13.8 | 6.8 | 4.6 | 9.6 | 13.9 | 7.1 |
23–24 | 8.0 | 12.0 | 15.0 | 8.2 | 4.9 | 10.5 | 15.1 | 7.9 |
25–26 | 7.0 | 13.0 | 16.7 | 8.0 | 5.3 | 11.4 | 16.2 | 8.2 |
27–28 | 7.0 | 13.0 | 21.0 | 9.0 | 5.6 | 12.2 | 17.2 | 8.4 |
29–30 | 7.0 | 11.0 | 16.0 | 9.0 | 5.9 | 13.0 | 18.0 | 8.6 |
31–32 | 8.0 | 15.5 | 19.4 | 8.2 | 6.1 | 13.7 | 18.7 | 8.7 |
33–34 | 4.5 | 13.0 | 20.5 | 8.5 | 6.4 | 14.3 | 19.3 | 8.8 |
35–36 | 6.0 | 15.0 | 19.0 | 8.0 | 6.6 | 14.8 | 19.7 | 8.9 |
37–38 | 5.0 | 14.0 | 20.4 | 8.0 | 6.8 | 15.2 | 19.8 | 8.9 |
39–42 | 7.0 | 14.0 | 17.0 | 9.2 | 7.1 | 15.5 | 19.8 | 8.7 |
Table 13.4
Classification of ANH using APD measurement
Second trimester (mm) | Third trimester (mm) | |
|---|---|---|
1-mild | ≤7 | ≤9 |
3-moderate | 7–10 | 9–15 |
5-severe | ≥10 | ≥15 |
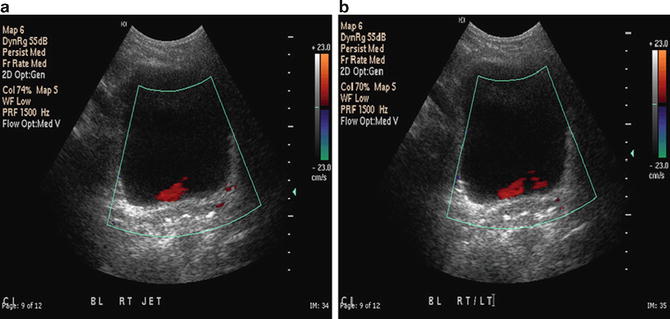
Ureteral Jets : One of the more recent applications of Doppler is imaging of the base of the bladder and trigone for detection of pulsatile (peristaltic) egress of urine from the ureteral orifices (Fig. 13.5). Ureteral jets can be well documented even after placement of double pigtail ureteral stent (Fig. 13.6a, b). This application is quite useful in assessing the patency of the ureter. Ureteral jets can be assessed during the follow-up and observation period of medical expulsive therapy, in anticipation of spontaneous stone passage. This application is very valuable in management of pregnant patients with renal colic as it eliminates radiation exposure. Presence, clinical utility, value, and accuracy of ureteral jets, at times, remain controversial. This is due to the significant variability of ureteral jets frequency in normal volunteers [49–53]. Presence of stones in the distal ureter can easily be documented with grayscale ultrasound and Doppler showing twinkle artifact. From a clinical point of view if there is adequate ureteral jets and patient is not in severe pain or septic, observation, pain management and Alpha blockers (Medical Expulsive Therapy) can be considered. A recent study indicated that an Alpha blocker was safely used in 28 pregnant women with renal colic as part of medical expulsive therapy (MET) [54] (Fig. 13.7a, b).
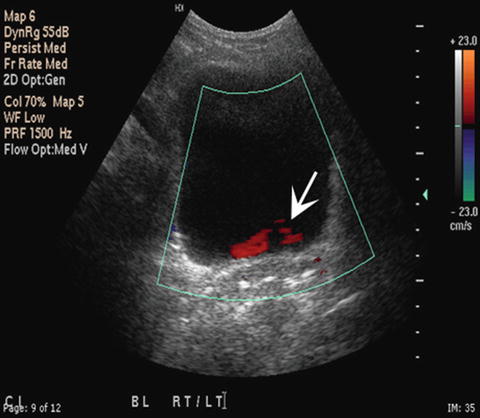
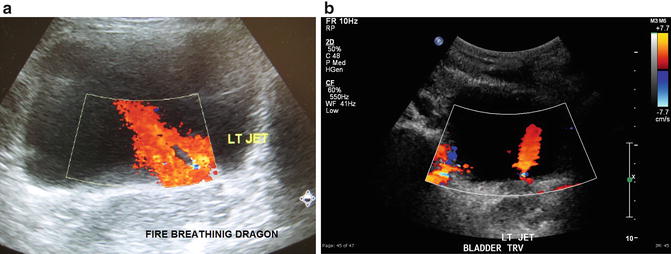
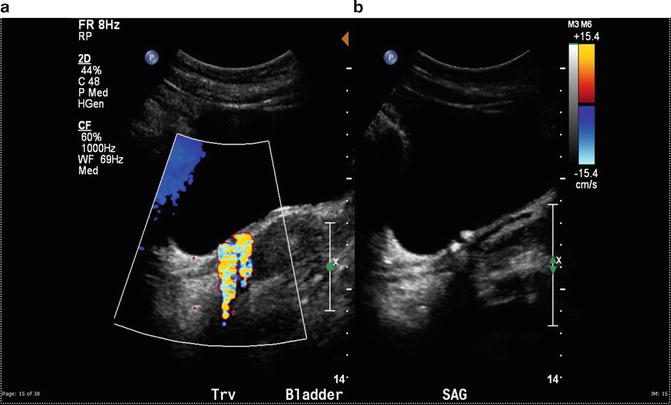
Fig. 13.5
Ureteral jets in the previous patient, note sluggish jet from the left side (arrow)
Fig. 13.6
(a) A strong left ureteral jet: pulsatile egress of urine into bladder gives the appearance of a dragon-breathing fire. (b) A strong left ureteral jet (arrows) in a patient with a left double pigtail ureteral stent. Note that the direction of the jet is slightly toward left of bladder and vertical secondary to changes in the orientation of the orifice with the stent in place
Fig. 13.7
Patient with history of right flank pain managed with MET. The right shows twinkle artifact arising from two distal ureteral stones. Continued Doppler evaluation reveals strong right ureteral jet ruling out significant obstruction
The drawback to the assessment of ureteral jets is that it may add significant scanning time to a standard renal bladder study, but in the case of a pregnant patient this is the most viable option. In well-hydrated patients ureteral jets can often be documented within a few minutes of scanning the bladder. To indicate that there is an absence of ureteral jets, adequate scanning time needs to be allowed. Usually a minimum of 10 min is recommended to adequately document absence of ureteral jets [53]. Thirty minutes may be required to document asymmetry of jet frequency in order for it to be a true finding. The patients must be adequately hydrated. The urine density differences contribute to visualization of ureteral jets [51]. Some of the other theories discussed in relation to ureteral jets include that frequency decreases during normal pregnancy. Findings suggestive of ureteral obstructions are asymmetry of ureteral jets and absence or sluggish continuous flow from the affected side. Lack of ureteral jets suggesting obstruction is after 10 min of observation with no obvious flow in a well-hydrated patient whereas in partial obstruction, there is sluggish trickling along the trigone versus strong upward jet toward opposite bladder wall.
Some of the above-mentioned signs that are indicative of obstruction can be seen in asymptomatic pregnant women. They may be attributed to diminished ureteral smooth muscle tone and extrinsic ureteral compression by the gravid uterus. There is no correlation between the degree of hydronephrosis and mean jet frequency [53] (Fig. 13.8). Transvaginal sonography demonstrating a dilated distal ureter or presence of a stone can further document obstruction specifically if combined with Doppler showing twinkling artifact [55–57] (Fig. 13.9). Transvaginal ultrasound orientation is not a single orientation. The intracavitary transducer is end fire and can create images in different orientations: Upward (similar to transrectal) or downward (transabdominal) views of the bladder. The operator should provide orientation of images for radiologist’s interpretation.