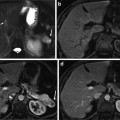
Fig. 1
Forty-five-year-old female who presents for liver ultrasound due to right upper abdominal pain. (a) Grayscale sonographic image demonstrates a hyperechoic lesion in the right hepatic lobe (arrow) with imaging characteristics of a hemangioma. (b) Color Doppler imaging of the lesion demonstrates no substantial central flow within the lesion and some peripheral vascularity. This appearance is common for hemangiomas and is likely related to the very slow blood flow within the central dilated vascular channels of the lesion
Contrast-enhanced US can be performed to help in the characterization of hemangiomas that present equivocal imaging findings on grayscale US [7]. Hemangiomas demonstrate a reproducible and specific enhancement pattern at contrast-enhanced US that closely reflect the imaging appearance with other contrast-enhanced cross-sectional imaging techniques. This includes demonstration of peripheral nodular enhancement of the lesion in the arterial phase that expand in a centripetal pattern during the hepatic venous phase and beyond, often progressing to complete fill-in of the lesion. Although the speed of enhancement may differ in different lesions, likely reflecting differences in the circulatory time of contrast material in various lesions, the degree of enhancement of the peripheral nodules classically exceeds that of the adjacent liver parenchyma. This sustained enhancement, in which the lesion has an echogenicity equal to or greater than that of the liver through the portal venous phase and beyond, is a requisite for a confident diagnosis. Complete enhancement does not always occur, especially in large lesions, which often undergo central thrombosis of the intralesional venous sinusoids.
Multidetector-Row Computed Tomography
With the recent advent of multidetector-row computed tomography (MDCT) scanners, substantial anatomic volumes can be acquired within a short scan time, with submillimeter section thickness and virtually no penalty in increased radiation dose. With the assistance of test bolus or bolus-tracking techniques for monitoring the contrast material bolus transit time, these technologic advances have led to image acquisition during peak vascular enhancement, with almost uniform enhancement along the entire scanned volume, reduced motion artifacts, and the capability to generate high-resolution reformations in any desired plane. As a result, the incidental detection of hemangiomas in an asymptomatic patient has become a relatively common finding during radiologic examinations performed for indications other than evaluation for liver disease. The main goal of imaging is to firmly establish a diagnosis to avoid unnecessary, aggressive management and to minimize patient distress and anxiety.
At precontrast CT, hemangiomas manifest as a hypoattenuating lesion relative to the liver. However, because hemangioma may be hyperattenuating in the setting of diffuse fatty liver disease, lesion’s isoattenuation relative to aorta and intrahepatic vessels has been used as a more reliable finding for the diagnosis of hemangioma on precontrast CT. Central calcifications may occur in giant hemangiomas and are better identified before intravenous administration of iodinated contrast media. At contrast-enhanced CT, hemangiomas classically show peripheral, discontinuous, nodular enhancement, with centripetal progression of lesion’s enhancement (Fig. 2). The enhancing areas of hemangiomas are isoattenuating to aorta during the hepatic arterial phase and to the blood pool during the hepatic venous and delayed phases [5, 8]. When all typical criteria are observed, lack of complete lesion enhancement on the delayed-phase imaging should not dissuade from the diagnosis of hemangioma. Giant hemangiomas usually lack complete enhancement on delayed-phase imaging owing to thrombosis or sclerosis of the central portion of the tumor or insufficient imaging time to complete lesion filling.
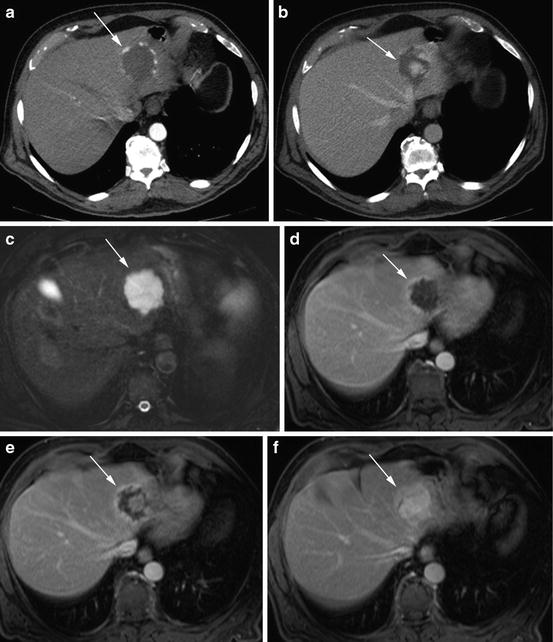
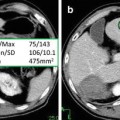
Fig. 2
Seventy-four-year-old male with no significant past medical history presents for CT of the abdomen and pelvis for follow-up of a pancreatic cystic lesion. (a, b) Axial contrast-enhanced CT (CECT) images of the liver, acquired in the arterial and portal venous phases, respectively, show a left hepatic lobe lesion with progressive centripetal nodular enhancement (arrow). (c) Axial T2-weighted (T2W) 3D fast spin echo (FSE) with fat saturation (FS) reveals the lesion in the left hepatic lobe to be homogeneously hyperintense (arrow) relative to the background liver. (d, e) Axial T1-weighted (T1W) 3D gradient recalled echo (GRE) images with FS acquired in the portal venous and late venous phases (approximately 70 and 120 s after administration of Gd-BOPTA, respectively) show progressive peripheral nodular enhancement within the lesion (arrow), similar to the CT enhancement pattern. (f) Axial T1W 3D GRE with FS image acquired in the equilibrium phase (approximately 5 min after administration of Gd-BOPTA) shows complete fill-in of the lesion (arrow), confirming that it is a hemangioma
In rare circumstances, small hemangiomas may demonstrate very slow enhancement following administration of intravenous contrast material, showing persistent hypoattenuation relative to the liver on all imaging phases. This uncommon finding has been explained as a slow fill-in of the large vascular spaces of the lesion. Identification of even a single small focus of enhancement (also known as the “central dot sign”) allows confident diagnosis in some of these atypical lesions [9].
Magnetic Resonance Imaging
With the recent introduction of fast imaging sequences that allow breath-hold imaging of the liver during short acquisition times (less than 20 s), and substantial reduction in the cost per examination, MR imaging has been advocated by some as the modality of choice in the noninvasive work-up of focal liver lesions. Compared to CT, major advantages of MR imaging include higher soft-tissue contrast resolution, greater sensitivity to intravenous gadolinium-based contrast agents, excellent depiction of fluid-containing structures (e.g., the biliary tree, gallbladder, or cystic lesions), and the absence of ionizing radiation. The latter attribute of MR imaging can be an effective strategy to limit the radiation burden from CT examinations, most importantly in children and young adults.
Most hepatic hemangiomas can be confidently characterized at MR imaging, using a combination of T2-weighted and T1-weighted sequences before and after contrast material administration. The hallmark of these lesions is the very long T1 and long T2 values derived from the blood pooling within the vascular channels, which is responsible for lesion’s low signal intensity on T1-weighted images and markedly high signal intensity on T2-weighted images. Many studies have emphasized the importance of acquiring heavily T2-weighted imaging in the diagnosis of hepatic hemangiomas at imaging [10]. While the use of fat suppression increases the conspicuity of these lesions on T2-weighted images, this improvement is not necessarily accompanied by an improved characterization of these liver tumors. Although less common, metastases from neuroendocrine tumors, mucinous colorectal cancer, and, occasionally, breast cancer may also manifest high signal intensity on T2-weighted images, thus mimicking hepatic hemangioma. Although correlation with lesion characteristics on other imaging sequences allows confident differential diagnosis, percutaneous lesion biopsy may be still necessary in a small number of indeterminate cases.
With recent advances in technology, diffusion-weighted (DW) MR imaging has been increasingly used in abdominal imaging applications, including liver lesion characterization. Black-blood diffusion images (using low b values) allow suppression of the signal from the intrahepatic vessels improving detection of focal liver lesions, as compared to a standard T2-weighted sequence. This improvement is related to improved image contrast and lack of blurring with single-shot spin-echo echo-planar imaging [11]. In addition, preliminary evidence suggests that the diffusion information provided by imaging at higher b values may also improve characterization of focal liver lesion. Previous studies showed that hepatic hemangioma (and simple hepatic cysts) manifest a typical imaging pattern on DW imaging, including high signal intensity on DW images at low b values (e.g., b = 0 s/mm2), strong signal intensity on DW images at high b value (e.g., b = 500 s/mm2), and substantially higher ADC values relative to the background liver. This appearance is remarkably different from that of malignant liver neoplasms, which classically demonstrate mild to moderate hyperintensity on DW images at low b values, which persist at higher b values. ADC values of malignant liver neoplasms are also typically lower compared with those of the surrounding liver parenchyma.
The enhancement pattern of hepatic hemangioma on contrast-enhanced MR imaging using conventional extracellular gadolinium contrast agents is comparable to that seen at multiphasic contrast-enhanced CT (Fig. 3). The greater sensitivity of MR to intravenous gadolinium-based contrast agents, particularly with the use of optimized fat-suppressed T1-weighted sequences, may improve visualization of smaller peripheral foci of enhancement in small hemangiomas with slow flow and conceivably result in better characterization of these lesions.
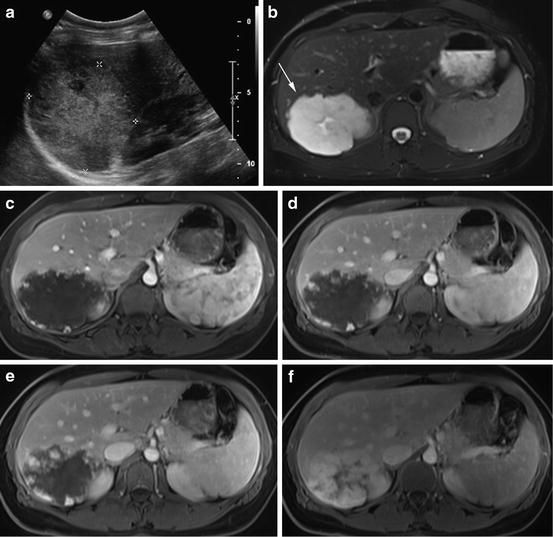
Fig. 3
Thirty-nine-year-old female who presents for further evaluation with MR for liver lesion seen on ultrasound. (a) Grayscale sonographic image demonstrates a hyperechoic lesion in the right hepatic lobe without any evidence of a hypoechoic halo. (b) Axial T2W FSE with FS image prior to the administration of Gd-BOPTA reveals a large hyperintense lesion in the posterior segment of the right hepatic lobe (arrow) with area of increased signal centrally. (c) Axial T1W 3D GRE with FS image acquired in the arterial phase (approximately 25 s after administration of Gd-BOPTA) shows peripheral nodular enhancement with this lesion. (d) Axial T1W 3D GRE with FS image acquired in the portal venous phase (approximately 70 s after administration of Gd-BOPTA) shows some increased nodular enhancement of the lesion. (e) Axial T1W 3D GRE with FS image acquired in the late venous phase (approximately 3 min after administration of Gd-BOPTA) shows the lesion to progressively fill in with contrast. (f) Axial T1W 3D GRE with FS image acquired in the delayed phase (approximately 10 min after administration of Gd-BOPTA) shows the lesion to nearly completely fill with contrast. This is the characteristic appearance of hemangiomas using extracellular contrast agents. Note that the blood pool remains bright on these images, compatible with the fact that hemangiomas will follow the signal of the blood pool
More recently, the introduction into daily clinical practice of hepatocyte-specific gadolinium-based MR contrast media has offered the possibility to simultaneously provide information of a standard MR imaging examination with the additional functional data during the liver-specific phase of imaging. The combination of functional and morphologic information improves the detection and characterization of liver tumors. Gadolinium benzyloxypropionictetraacetate, or Gd-BOPTA (MultiHance, Bracco Diagnostics Inc., Princeton, NJ), and gadolinium ethoxybenzyl diethylenetriaminepentaacetic acid, or Gd-EOB-DTPA (Eovist/Primovist, Bayer Pharmaceuticals, Wayne, NJ), are two commonly used examples of this category of contrast agent. Gd-EOB-DTPA, which was approved by US Food and Drug Administration (FDA) for focal liver lesion detection and characterization in 2008, has a substantially greater uptake by the hepatocyte and excretion through the hepatobiliary pathway compared to Gd-BOPTA (approximately 50 % compared to 5 % in patients without impaired hepatic function) [12]. This contrast dynamic characteristics result in stronger and more rapid enhancement of the liver and biliary system during the hepatobiliary phase, with a peak enhancement approximately 20 min after contrast material injection [13–15] compared to 40–120 min for gadobenate dimeglumine [16–20]. While early imaging during the hepatobiliary phase is beneficial, theoretically leading to improved workflow considerations [21] and possible decreased examination costs due to the potential ability to characterize lesions in a single MR time slot, the rapid hepatic uptake of Gd-EOB-DTPA may potentially create a pitfall in the assessment of the enhancement pattern of hepatic hemangiomas [22]. Recent evidence has shown that these lesions are commonly hypointense relative to the high signal intensity background liver on images acquired during the delayed and, in some cases, the portal venous phases. This appearance can be confusing and be potentially misinterpreted as evidence of washout within a lesion, a finding commonly associated with other liver lesions such as adenoma, hepatocellular carcinoma, and liver metastases (Figs. 4, 5, and 6). Consideration of imaging characteristics during the other imaging phases of enhancement as well as on the precontrast T2-weighted and DW images is critical for the confident differential diagnosis of these hepatic lesions.
Get Clinical Tree app for offline access
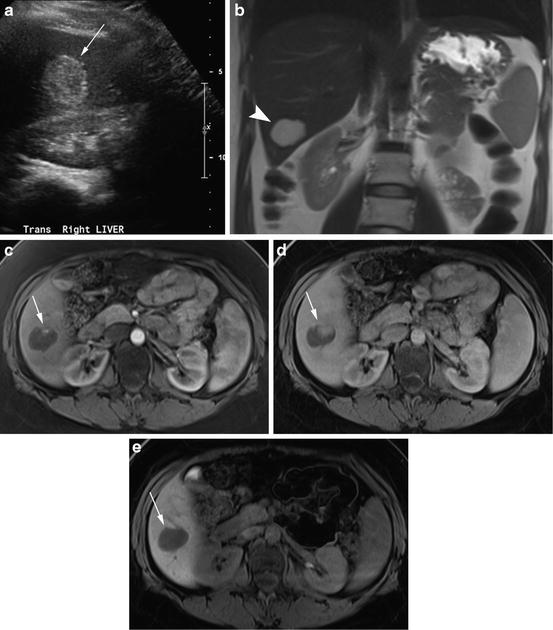
Fig. 4
Thirty-eight-year-old female who presents for MR imaging to further evaluate a liver lesion seen on ultrasound. (a) Grayscale sonographic image demonstrates a homogeneously hyperechoic lesion in the right hepatic lobe (arrow) adjacent to the right kidney. (b) Coronal half-Fourier acquisition single-shot turbo spin-echo (HASTE) images reveal a corresponding well-circumscribed T2 hyperintense lesion in the right hepatic lobe (arrowhead). (c) Axial T1W 3D GRE with FS image acquired in the arterial phase (approximately 25 s after administration of Gd-EOB-DTPA) shows a small amount of peripheral nodular enhancement within this lesion (arrow). (d) Axial T1W 3D GRE with FS image acquired in the portal venous phase (approximately 70 s after administration of Gd-EOB-DTPA) shows additional high signal within the lesion, corresponding to progressive enhancement (arrow). (e) Axial T1W 3D GRE with FS image acquired in the hepatocyte phase (approximately 10 min after administration of Gd-EOB-DTPA) shows the lesion to be hypointense to the liver parenchyma (arrow), related to the decreased dose of Gd-EOB-DTPA versus conventional extracellular agents, shorter plasma half-life as well as increased hepatobiliary uptake [22]
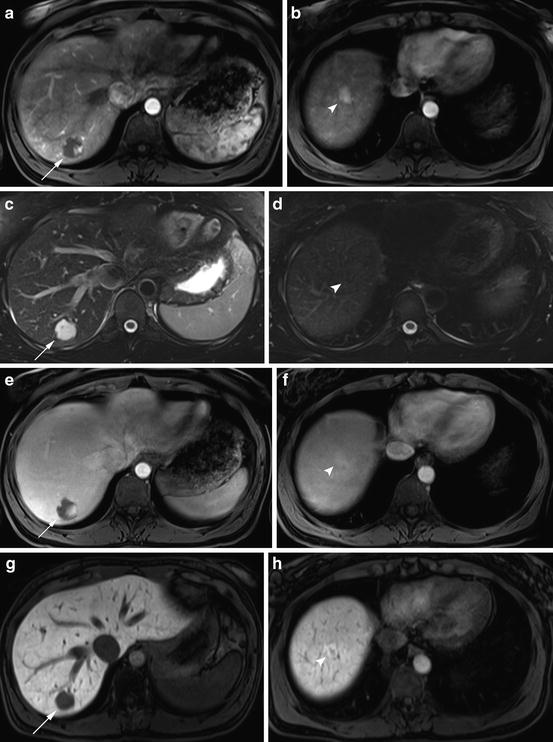
Fig. 5
Thirty-eight-year-old female who presents abdominal MR examination due to elevated total serum bilirubin. (a, b) Axial T1W 3D GRE with FS images at two different levels of the liver acquired in the arterial phase (approximately 25 s after administration of Gd-EOB-DTPA) shows a lesion with peripheral nodular enhancement in the posterior segment of the right hepatic lobe (arrow) as well as a hyperenhancing lesion in the hepatic dome (arrowhead). (c, d) Axial T2W FSE with FS images at the same levels in the liver reveals a hyperintense lesion in the right hepatic lobe (arrow) corresponding to the first lesion on the arterial phase images. Note that the hyperenhancing focus more superiorly in the liver is not definitely seen on the T2W image (arrowhead denoting the region of interest). (e, f) Axial T1W 3D GRE with FS images acquired in the portal venous phase (approximately 70 s after administration of Gd-EOB-DTPA) shows more nodular enhancement of the first lesion in the posterior segment of the right hepatic lobe and near isointensity of the second lesion in the hepatic dome to the surrounding parenchyma. (g
 Resonance Imaging of Adenocarcinoma of the Pancreas
 Visualization of Hypoxia, Proliferation and Glucose Metabolism in Non-small Cell Lung Cancer and Its Metastasis
 Imaging Characteristics of Hepatocellular Carcinoma
 Cortex Segmentation on Computed Tomography
 Liver Segmentation Without Prior Statistical Models
 Surface Registration Using Ricci Flow


Related posts:
Resonance Imaging of Adenocarcinoma of the Pancreas
Visualization of Hypoxia, Proliferation and Glucose Metabolism in Non-small Cell Lung Cancer and Its Metastasis
Imaging Characteristics of Hepatocellular Carcinoma
Cortex Segmentation on Computed Tomography
Liver Segmentation Without Prior Statistical Models
Surface Registration Using Ricci Flow
Stay updated, free articles. Join our Telegram channel
Full access? Get Clinical Tree
