Artifacts and Normal Variants in FDG PET
Paul Shreve
Chuong Dac Huy Bui
Advances in positron emission tomography (PET) capability and widespread recognition of the value of fluorodeoxyglucose (FDG) PET in oncology and has led to the routine whole-body (CF torso) imaging in most oncologic indications of FDG PET. The high FDG uptake by most malignancies relative to the level of FDG distributed throughout much of the body facilitates identification of malignant neoplasm. Compared to conventional anatomic approaches alone, whole-body FDG PET permits much more rapid and accurate identification of the presence and extent of malignant disease. Focal FDG tracer accumulation due to cancer, however, must be distinguished from normal, normal variant, and benign pathological sources of FDG uptake. This is a principal task in the interpretation of whole-body FDG PET scans applied to oncologic diagnosis.
FDG tracer uptake depicts tissue glucose metabolism. Hence, in addition to the abnormal glucose metabolism associated with malignant neoplasm, both normal variations in glucose metabolism and increased glucose metabolism due to a variety of pathologies are revealed on FDG PET. Interpretation of whole-body FDG PET thus requires knowledge of normal and normal-variant patterns of FDG uptake as well as familiarity with the many benign pathologic causes of increased FDG uptake. Frequently both anatomic and physiologic knowledge is needed to reliably identify sites of FDG uptake as normal, variant, or benign pathological etiologies.
Normal Whole-body Fluorodeoxyglucose Distribution
On whole-body PET performed between 1 and 2 hours following intravenous administration of FDG, the brain, heart, and urinary tract are the most prominent sites of tracer accumulation (Fig. 8.3.1). The brain, an obligate user of glucose, is always prominent relative to the rest of the body. Both supratentorial and infratentorial gray matter are FDG avid, and the level of FDG uptake is in the range typical of FDG-avid malignancies. The myocardium is of similar FDG avidity in the fed state, but with sufficiently long fast (typically greater than 12 hours), the myocardium metabolism shifts to fatty acids as a source of energy, and the myocardial uptake becomes largely indistinguishable from blood pool tracer activity. FDG follows a urinary excretory route, hence in the absence of aggressive hydration, diuretics, and urinary bladder catheterization, FDG is present in the bladder and to varying degrees the upper urinary tract.
Elsewhere, tracer activity is distributed at low levels in recognizable anatomic structures on attenuation-corrected images (Fig. 8.3.1). Cardiac and mediastinal great vessel blood pool is discernable against the very low tracer activity of the lungs (Fig. 8.3.2). Glandular tissue of the breast is associated with low-level uptake, slightly greater than blood pool, in younger women. The liver and spleen are associated with slightly higher FDG activity than blood pool levels and are reliably identified in the abdomen, as are the kidneys. The pancreas is normally not discretely identified. Bowel is seen to varying degrees, as is the stomach due to widely variable levels of FDG uptake in the alimentary tract. Bone marrow normally is associated with FDG accumulation at levels higher than blood pool activity, hence vertebral bodies are reliably identified, as well as in major marrow containing skeletal structures such as the pelvis, hips, and sternum. In the neck lymphoid tissue associated with the palatine tonsils is consistently FDG avid and typically clearly identified (Fig. 8.3.3). The parotid and submandibular salivary glands are discernable by uniform low-level FDG activity. Muscles of vocalization within the larynx, specifically the posterior cricoarytenoid and vocalis muscles, are commonly seen on routine whole-body scans. Musculature at the base of the tongue, just within the lower anterior mandible, is almost always seen. Cervical spinal cord is identifiable with uniform low-level FDG uptake (Fig. 8.3.3).
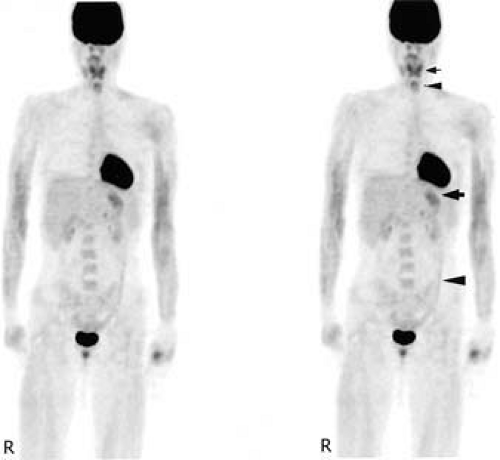 Figure 8.3.1. Normal whole-body distribution of fluorodeoxyglucose (FDG) 1 hour following intravenous tracer administration. Attenuation-corrected anterior maximum intensity projection image. Intense tracer activity is present in the brain, heart, and bladder. In the neck, palatine tonsil lymphoid tissue tracer activity (small arrow) and minimal laryngeal muscle activity (small arrowhead) is seen. Inferior to the heart is low-level gastric tracer activity (large arrow) and the outlines of the liver, spleen, and kidneys are discernable. Normal bone marrow tracer activity defines vertebral bodies and the pelvis. Vertical linear tracer activity in the left abdomen and pelvis is the descending colon (large arrowhead). Mild increased tracer activity is seen in the arm musculature. |
Normal Variant Fluorodeoxyglucose Distribution
Myocardium
Uptake of FDG in myocardium in patients who have fasted 4 to 18 hours is variable, ranging from uniform and intense, to nearly absent. In the fed state, FDG uptake in intact myocardium is intense, on the order of brain gray matter. With a sufficient fast, myocardium will shift energy metabolism from glucose to fatty acids (1), and demonstrate little FDG uptake; however, in practice, even with overnight fasting, FDG uptake in myocardium is not reliably absent. There is some evidence that an all-protein diet the day before an FDG study enhances the shift of myocardial metabolism to fatty acids. With contemporary dual modality of PET with computed tomography (CT) and image reconstruction algorithms, the presence of intense FDG uptake in the myocardium does not generally present limitations in interpretation of the lungs and mediastinum, except for abnormalities associated with the pericardium or directly adjacent lung. The transition from the intense FDG uptake of dominant glycolytic myocardial metabolism to absent FDG uptake of dominant fatty acid metabolism is frequently nonuniform (Fig. 8.3.4). The base of the left ventricular myocardium tends to be the last portion to lose glucose avidity. Such irregular FDG left ventricular myocardial distribution can be observed in patients who have fasted 4 to 18 hours, yielding apparent discrete foci at the base of the heart that could be misinterpreted as FDG-avid mediastinal lymph nodes if anatomic relationships are not appreciated. In addition, atrial myocardium is sometimes discernable, and again irregular FDG distribution can occur, yielding apparent small focal abnormalities in the mediastinum (Fig. 8.3.5). In the fed state, right ventricular myocardium is typically seen at low levels, but can become as prominent as the left ventricular myocardium in the setting of right ventricular hypertrophy, such as seen with pulmonary hypertension.
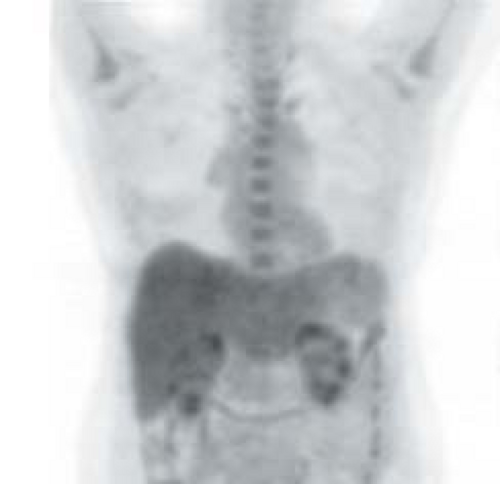 Figure 8.3.2. Normal distribution of fluorodeoxyglucose in the chest 90 minutes following intravenous tracer administration. Attenuation- corrected anterior maximum intensity projection image. Blood pool tracer activity in the great vessels defines the contours of the mediastinum. Lung tracer activity is uniform and very low, reflecting blood pool. Normal breast glandular tissue is discernable in this young female. Myocardial uptake in this fasted patient is equivalent to mediastinal background activity. Normal liver and spleen tracer activity is seen in the upper abdomen. |
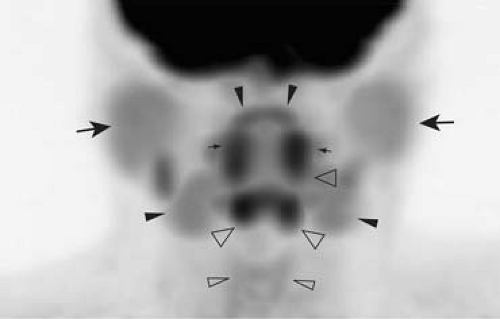 Figure 8.3.3. Normal distribution of fluorodeoxyglucose in the neck 90 minutes following intravenous tracer administration. Attenuation-corrected fine matrix anterior maximum intensity matrix image. The parotid glands (large arrow) and submandibular glands (large arrowhead) are defined by uniform low-level tracer activity. Intense tracer activity in the palatine tonsils (small arrows) is nearly always present, while the lingular tonsil portion of the Waldeyer ring is sometimes discernable (small arrowheads). Intense tracer uptake is almost always seen in the musculature at the base of the tongue, comprising the genioglossus, hyoglossus, and anterior belly of the digastric muscles (large open arrowheads). Usually the muscles of vocalization (posterior cricoarytenoid and vocalis muscles) are also seen (small open arrowheads). |
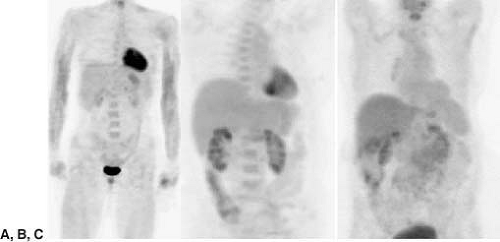 Figure 8.3.4. Variable appearance of myocardial tracer activity in fasting patients. Attenuation-corrected anterior maximum intensity projection images. A: Fully retained myocardial fluorodeoxyglucose (FDG) tracer uptake with uniform tracer activity throughout the myocardium. B: Heterogeneous myocardial FDG tracer activity with relatively preserved tracer activity towards the base of the heart. C: When myocardium has fully shifted to fatty acid metabolism in response to fasting, FDG tracer activity is uniformly low, equivalent to mediastinal background activity. |
Skeletal Muscle
At rest, skeletal muscle relies on fatty acid oxidative metabolism for energy. With increased energy demand, glycolysis becomes the major source of energy for skeletal muscle depending on relative oxygen delivery and tissue oxidative capacity. Fast twitch muscle fibers, with sparse mitochondria and limited oxidative capacity, are associated with consistent high glucose demand; extraocular muscles routinely demonstrate elevated FDG accumulation (2). Skeletal muscle composed of slow twitch fibers will demonstrate glucose uptake when under active contraction or following glycogen depletion. Hence, skeletal muscle under active contraction during the FDG uptake phase (largely the first 30 minutes after tracer administration) will demonstrate elevated FDG accumulation. Further, skeletal muscle under heavy use prior to injection of FDG may also exhibit FDG uptake, likely related to replenishment of glycogen stores (3). For this reason, patients are typically advised to refrain from heavy exercise the day prior to their FDG PET examination, and following FDG administration, to sit semirecumbent or lie quietly. Since insulin increases muscle uptake of glucose, insulin given prior to, or immediately after, FDG administration will result in diffusely increased muscle uptake (Fig. 8.3.6) (4).
Low-level uptake in the forearm muscles is relatively common (Fig. 8.3.1). Major truncal muscles can be prominent with patients who have been physically active even hours before FDG injection (Fig. 8.3.6). Heavy ventilatory efforts associated with physical exertion or pulmonary disease commonly result in identifiable intercostal muscles and diaphragmatic crura (Fig. 8.3.7) (5). The symmetry and configuration of muscle FDG uptake generally permits correct identification on the FDG PET images alone; however, the FDG uptake does not always involve the entire muscle. Imbalance in muscle groups due to disease or associated treatment such as surgery can result in focal asymmetric FDG uptake, which in certain locations such as the neck, can lead to potential misdiagnosis (6). Asymmetric or isolated major muscle FDG uptake can be confounding in the shoulder girdle musculature. The teres minor is commonly seen when patients are scanned in an arms-by-the-side positioning and should not be confused with metastasis or other pathology in the shoulder region. Identification of the muscle origin of FDG activity is greatly facilitated by review of the registered and aligned images provided on PET/CT acquisitions.
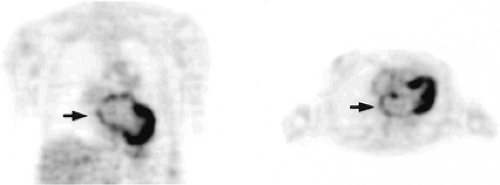 Figure 8.3.5. Atrial muscle fluorodeoxyglucose uptake. Attenuation-corrected coronal and transaxial images. Tracer uptake in atrial muscle can be resolved (arrow), especially in patients with valvular disease or heart failure, and may appear irregular with somewhat focal regions of tracer activity. |
Speech during the uptake phase of FDG increases FDG activity in the laryngeal muscles and the tongue (7). Laryngeal musculature uptake is, in the absence of prior related surgery or unilateral recurrent nerve palsy, nearly always symmetrical and hence readily appreciated as normal. The principal muscles seen are the posterior cricoarytenoid muscles and the vocalis muscles (Fig. 8.3.8). The unilateral absence of FDG activity in the vocalis and cricoarytenoid muscles is a sign of unilateral recurrent laryngeal nerve palsy (Fig. 8.3.9), such as due to tumor mass in the mediastinum or neck.
Tongue uptake varies from mild to intense, typically involves the entire tongue or top of the tongue, and is easily recognizable on maximum intensity projection and sagittal images. Isolated focal uptake can be seen, however. Prior surgery involving the tongue can yield focal asymmetrical muscle uptake, which may be indistinguishable from residual or recurrent malignancy (Fig. 8.3.10). Muscle flaps in the tongue will result in focal tracer uptake indistinguishable from recurrent neoplasm on the FDG PET images. Careful and experienced review of the corresponding CT images (preferably registered and
aligned from a PET/CT scan) and surgical and treatment history is often essential in distinguishing benign from malignant sources of focal FDG tracer activity in the posttreatment neck.
aligned from a PET/CT scan) and surgical and treatment history is often essential in distinguishing benign from malignant sources of focal FDG tracer activity in the posttreatment neck.
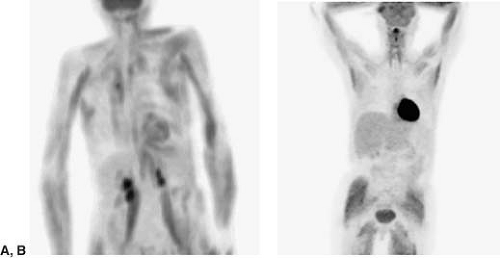 Figure 8.3.6. Skeletal muscle fluoro-deoxyglucose (FDG) uptake. A: Attenuation-corrected anterior maximum intensity projection image shows major truncal and upper body skeletal muscle FDG uptake in a patient who performed heavy physical labor hours prior to the FDG administration. B: Diffuse skeletal muscle uptake due to endogenous insulin response to a sugar-containing meal or beverage just prior to FDG administration. Note intense myocardial activity, reflecting the myocardial shift to glucose metabolism in response to insulin. A similar pattern of skeletal and myocardial muscle FDG uptake occurs when exogenous insulin is given just prior to FDG administration. |
Brown Adipose Tissue
Brown adipose tissue (BAT) is abundantly present in infancy and diminishes with age. BAT expresses a unique mitochondrial uncoupling protein that permits direct heat generation rather than adenosine triphosphate (ATP) production from fatty acid oxidation in response to cold exposure, ingestion of food, or increased sympathetic activity. This process requires an increased supply of ATP, which in turn is provided by an increase in glycolytic metabolism. With routine use of PET/CT, it is now recognized that surprisingly intense increased FDG activity can localize to adipose tissue (most likely BAT) in the neck, supraclavicular regions, axillae, paravertebral locations at the thoracic spine, mediastinum, and occasionally subdiaphragmatic and perinephric fat (Fig. 8.3.11). This phenomenon is seen more often in young patients, females, and slender patients, appears to occur more frequently in the months with colder outdoor temperatures, and is correlated with patient anxiety (8). Activated BAT may also explain increased FDG uptake in lipomatous hypertrophy of interatrial septum. This rare normal variant can mimic malignancy in the mediastinum, but can usually be
correctly identified with PET/CT–generated registered and aligned images. Close attention to controlling the patient’s level of anxiety and the environmental temperature (at least 25°C) for 15 minutes to 2 hours before FDG injection as well as during the FDG uptake phase can significantly reduce FDG uptake in brown fat in the neck and paravertebral area (9,10,11). Drugs such as propranolol and reserpine reduce brown fat uptake by blocking adrenergic receptor–mediated stimulation of BAT (12).
correctly identified with PET/CT–generated registered and aligned images. Close attention to controlling the patient’s level of anxiety and the environmental temperature (at least 25°C) for 15 minutes to 2 hours before FDG injection as well as during the FDG uptake phase can significantly reduce FDG uptake in brown fat in the neck and paravertebral area (9,10,11). Drugs such as propranolol and reserpine reduce brown fat uptake by blocking adrenergic receptor–mediated stimulation of BAT (12).
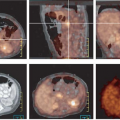
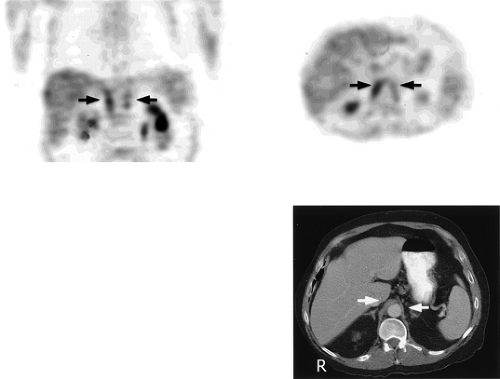 Figure 8.3.7. Respiratory muscle fluorodeoxyglucose (FDG) uptake. Coronal and transaxial attenuation-corrected FDG PET images and corresponding transaxial CT image showing tracer uptake in the diaphragmatic crura (arrow). Elevated ventilatory efforts during the FDG uptake phase, such as in patients with severe chronic obstructive pulmonary disease, may result in FDG uptake in intercostal and diaphragmatic muscles. Focal tracer uptake in the paraspinous diaphragmatic crura typically will have an elongated configuration on coronal images and is readily localized and identified on registered and aligned CT images. |
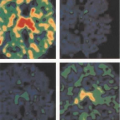
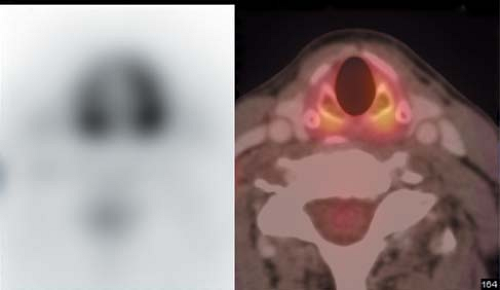 Figure 8.3.8. Normal fluorodeoxyglucose (FDG) uptake in the muscles of vocalization. Transaxial attenuation-corrected FDG PET image and PET/CT fusion image reveals symmetrical focal FDG activity posteriorly corresponding to the posterior cricoarytenoid muscles and uniform tracer activity, extending at the level of the true vocal cords corresponding to the vocalis muscles. |
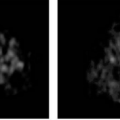
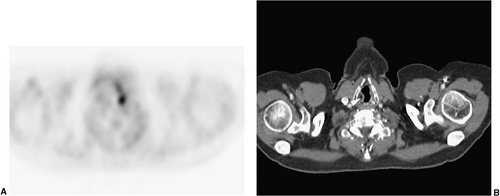 Figure 8.3.9. Abnormal asymmetric fluorodeoxyglucose uptake in the muscles of vocalization. A: Absent tracer activity is observed at the right posterior cricoarytenoid and vocalis muscles, while normal tracer activity is observed in the left posterior cricoarytenoid and vocalis muscles on the transaxial attenuation-corrected PET images. B: The registered and aligned CT image also reveals the flaccid right true vocal cord (white arrowhead) in this patient with a right-sided mediastinal mass, causing right recurrent laryngeal nerve palsy. |
Alimentry Tract
FDG uptake in the alimentary tract, from the esophagus to rectosigmoid colon, is widely variable both in terms of distribution and intensity. The etiology of FDG uptake in the alimentary tract is presently not understood and may reflect different normal and benign pathologic phenomenon in different portions of the alimentary tract. The esophagus occasionally is associated with
low-level activity throughout its extent (Fig. 8.3.12). Relatively intense fusiform and extended FDG uptake occurs in the presence of esophagitis (Fig. 8.3.13), which is indistinguishable from the configurations of esophageal cancer when the cancer has extended along the lymphatic plexus of the esophagus. It should be noted that esophagitis is common and often asymptomatic; hence, FDG uptake in the esophagus, when segmental and even intense, is not specific for esophageal malignancy. A focal area of FDG tracer uptake, especially when seen with focal thickening or asymmetric mass on CT, should be considered suspicious for neoplasm. A small focus of FDG activity is frequently seen at the gastroesophageal junction, probably related to the lower esophageal sphincter, and when no corresponding abnormal thickening or mass on CT is present, generally should not be presumed to be related to malignancy.
low-level activity throughout its extent (Fig. 8.3.12). Relatively intense fusiform and extended FDG uptake occurs in the presence of esophagitis (Fig. 8.3.13), which is indistinguishable from the configurations of esophageal cancer when the cancer has extended along the lymphatic plexus of the esophagus. It should be noted that esophagitis is common and often asymptomatic; hence, FDG uptake in the esophagus, when segmental and even intense, is not specific for esophageal malignancy. A focal area of FDG tracer uptake, especially when seen with focal thickening or asymmetric mass on CT, should be considered suspicious for neoplasm. A small focus of FDG activity is frequently seen at the gastroesophageal junction, probably related to the lower esophageal sphincter, and when no corresponding abnormal thickening or mass on CT is present, generally should not be presumed to be related to malignancy.
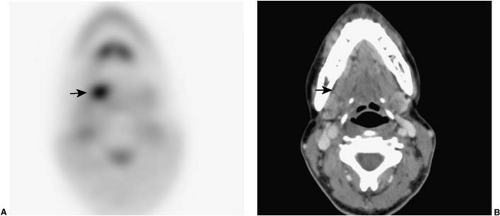 Figure 8.3.10. Focal fluorodeoxyglucose (FDG) uptake in the tongue. Transaxial attenuation-corrected FDG PET and transaxial CT images of a postoperative tongue reveal a small focus of abnormal FDG tracer activity at the right tongue base (A) (arrow) with no corresponding mass or abnormal enhancement on the CT images (B) (arrow). The partial resection of tongue muscle associated with the resection of a primary tongue neoplasm can cause imbalance in tongue musculature, resulting in focal physiologic skeletal muscle FDG tracer uptake. |
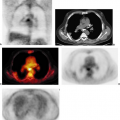
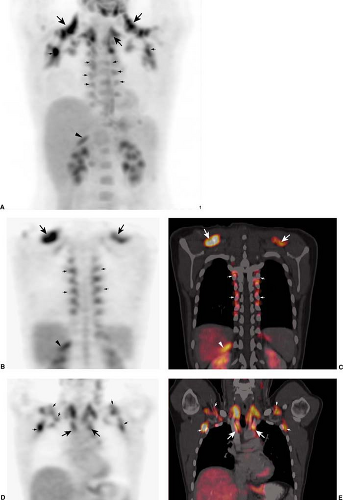 Figure 8.3.11. Brown adipose tissue (BAT) fluorodeoxyglucose (FDG) uptake. Anterior attenuation-corrected maximum intensity projection FDG PET (A) and coronal attenuation-corrected FDG PET (B,D) and PET/CT fusion images (C,E). Intense FDG tracer uptake is present in fat at the base of the neck, upper mediastinum (large arrows), supraclavicular region, axilla, paravertebral (small arrows), and upper abdomen retroperitoneal fat (small arrowheads). Properly registered and aligned PET and CT images allow for reliable identification of FDG tracer uptake in brown adipose tissue and distinction from pathologic lymph node tracer uptake, such as in the mediastinum, neck, supraclavicular fossa, and axilla. |
The normal stomach commonly shows FDG uptake, usually somewhat greater than FDG activity in the liver, and readily identifiable based on location and configuration (Fig. 8.3.14A). Gastric FDG uptake can be intense and, if the stomach is contracted, appear as an isolated FDG-avid mass. Location and configuration of the stomach, as well as distribution of FDG uptake in the gastric wall, can be variable, in some instances requiring careful reference to registered and aligned CT images to confirm the gastric origin of the FDG uptake. Gastric lymphoma and gastric carcinoma are thus not reliably diagnosed on FDG PET alone. The propensity for gastric FDG uptake is maintained in hiatal hernias, and hence FDG tracer activity in the lower mediastinum must be correlated with CT images.
Bowel, particularly the right colon (Fig. 8.3.14B), commonly demonstrates FDG uptake. The bowel uptake appears to be in the wall, and may reflect to varying degrees active smooth muscle, metabolically active mucosa, bowel wall lymphoid tissue, swallowed secretions, or colonic microbial activity. Tracer uptake is typically segmental or contiguous in the colon, and the appearance on maximum intensity projection images can be reminiscent of radiographic contrast studies of the colon (Fig. 8.3.14B). Small bowel
FDG activity is usually lower in intensity than FDG activity observed in the colon and is typically seen in the lower pelvis (Fig. 8.3.14B), with continuous or segmental components to its appearance assisting in proper identification.
FDG activity is usually lower in intensity than FDG activity observed in the colon and is typically seen in the lower pelvis (Fig. 8.3.14B), with continuous or segmental components to its appearance assisting in proper identification.
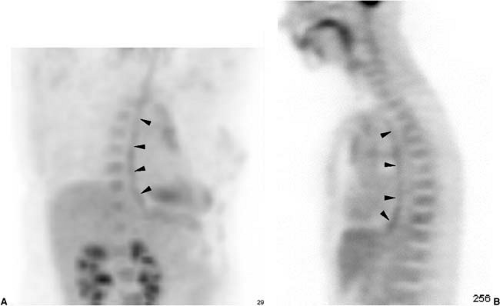 Figure 8.3.12. Normal esophageal fluorodeoxyglucose uptake. Attenuation-corrected anterioblique maximum intensity projection (A) and sagittal image (B) show uniform mild tracer uptake along the course of the esophagus (arrowheads). |
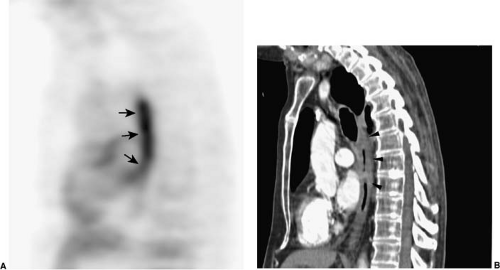 Figure 8.3.13. Segmental fluorodeoxyglucose (FDG) uptake due to esophagitis. Attenuation-corrected sagittal FDG PET (A) and sagittal reformat CT images (B) show an intense segment of tracer uptake in the midesophagus (small arrows), corresponding to diffuse esophageal wall thickening (arrowheads), due to postradiation treatment of the mediastinum-related esophagitis. Similar segmental FDG tracer uptake in the lower esophagus can occur due to reflux esophagitis. Esophageal cancer, while usually focal, can, however, present as a segment of tracer uptake and esophageal wall thickening. |
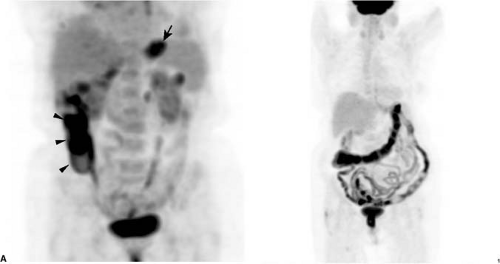 Figure 8.3.14. Physiologic fluorodeoxyglucose (FDG) activity in the stomach and bowel. Attenuation- corrected anterior maximum intensity projection images. A: Diffuse tracer in the partially contracted stomach (arrow) and diffuse tracer activity in the right colon (arrowheads). The stomach is usually associated with low-level tracer activity, but tracer uptake can be moderately intense. Physiologic FDG tracer uptake in the colon is variable, with the right colon more commonly seen and with variable intensity. B: Extensive physiologic FDG tracer uptake can be present throughout much and large bowel and long segments of small bowel. The relationships and course of tracer-avid bowel loops are best appreciated on rotating maximum intensity projection images, and registered and aligned CT images acquired on PET/CT readily confirm the bowel origin of the tracer activity. |
Focality of FDG uptake in either large or small bowel can be confounding, as peritoneal metastatic implants or mesenteric lymph node pathology may be entirely indistinguishable. Careful review of registered and aligned CT images can be essential for assigning isolated focal FDG uptake in the abdomen or pelvis to physiologic bowel tracer activity versus adjacent lymph nodes or serosal implants (Fig. 8.3.15). Focal FDG tracer activity, particularly when more intense than background liver activity within the bowel lumen
adjacent to colon wall, frequently corresponds to pathology, either villous adenomatous polyp or primary colon cancer, requiring further evaluation such as endoscopic examination (13,14). Sometimes a corresponding nodule can be identified on CT, but often no convincing CT abnormality is identified on routine CT, even with contrast enhancement. Inflammatory bowel disease is known to cause diffuse or segmental FDG uptake (15), and the FDG PET appearance tends to be of a featureless tubular structure, analogous to radiographic depictions (Fig. 8.3.16). Characteristic CT signs of inflammatory bowel disease, when present, allow for reliable distinction between benign physiologic FDG tracer uptake and inflammatory bowel disease (Fig. 8.3.16). Non-distended colon can also appear thickened and demonstrate physiologic FDG uptake. Some centers have reported reduction of bowel FDG uptake using smooth muscle relaxants immediately prior to FDG administration (16) or isosmotic bowel preparations the evening prior to the examination (17), although this is not routinely practiced at most centers.
adjacent to colon wall, frequently corresponds to pathology, either villous adenomatous polyp or primary colon cancer, requiring further evaluation such as endoscopic examination (13,14). Sometimes a corresponding nodule can be identified on CT, but often no convincing CT abnormality is identified on routine CT, even with contrast enhancement. Inflammatory bowel disease is known to cause diffuse or segmental FDG uptake (15), and the FDG PET appearance tends to be of a featureless tubular structure, analogous to radiographic depictions (Fig. 8.3.16). Characteristic CT signs of inflammatory bowel disease, when present, allow for reliable distinction between benign physiologic FDG tracer uptake and inflammatory bowel disease (Fig. 8.3.16). Non-distended colon can also appear thickened and demonstrate physiologic FDG uptake. Some centers have reported reduction of bowel FDG uptake using smooth muscle relaxants immediately prior to FDG administration (16) or isosmotic bowel preparations the evening prior to the examination (17), although this is not routinely practiced at most centers.
Related posts:
Stay updated, free articles. Join our Telegram channel

Full access? Get Clinical Tree


