The accurate and reproducible assessment of cardiac function is a fundamental aim of noninvasive cardiac imaging. It forms the foundation upon which much of the assessment and management of myocardial dysfunction, ischemia, viability, remodeling, valvular, and other cardiac disorders are based. In this chapter, we discuss the importance of the measurement of global cardiac function, compare techniques, show differences according to magnetic fields, provide a practical step-by-step guide to its assessment by cardiovascular magnetic resonance (CMR) and describe new techniques that can be used for the assessment of cardiac function.
The Population Impact of Cardiac Dysfunction
Cardiac dysfunction can result from a broad spectrum of organ-specific and multisystem disorders. The defining property that all these disorders have in common is impairment of the ventricle’s ability to eject blood, which, in its broadest sense and omitting any discussion of semantics, is known as heart failure. Heart failure is common, with approximately 1.5% to 2% of the population below 65 years old being affected, rising to 6% to 10% of those older than 65 years. It afflicts 4.8 million people in the United States, with 400,000 to 700,000 new cases developing each year. It is the leading cause of hospital admission in people older than 65 years of age, and despite the fact that survival has improved over time, the death rate remains high: ≈50% of people diagnosed with heart failure will die within 5 years. The number of any-mention deaths attributable to heart failure was approximately as high in 1995 as it was in 2011, although projections show that the prevalence of heart failure will increase 46% from 2012 to 2030, resulting in over 8 million people 18 years old and older with heart failure in the United States. Consequently, heart failure is an enormous consumer of health care budgets in the Western world, and treatments to prevent occurrence, to slow its progression, or to prevent repeated hospitalizations can have an important economic impact.
The Importance of Measuring Cardiac Function
A single assessment of cardiac function can provide important diagnostic and prognostic information, whether in the setting of postinfarction recovery, left ventricular (LV) hypertrophy, or chronic heart failure. As well as improving symptoms and quality of life, treatment of heart failure aims to decrease the likelihood of disease progression that could result in costly hospital admissions and ultimately death. To allow early evaluation and alteration of an individual patient’s management, serial studies need to be performed using a technique that not only is accurate but also has good interstudy reproducibility. This principle also applies in considering study populations of trial therapies.
Techniques for Assessing Cardiac Function
Bedside clinical assessment of cardiac function is generally poor, and electrocardiogram (ECG) findings are nonspecific, although the presence of an entirely normal ECG has a 95% likelihood of normal systolic function. In the search for a better assessment, it is worth considering the ideal imaging technique. This would provide a noninvasive, accurate, and reproducible assessment of cardiac function without exposure to ionizing radiation. It would be widely available and would be time- and cost-effective. Although no technique meets these ideals, there are clear differences between modalities that merit discussion.
Echocardiography
Echocardiography is a widely available but less than ideal imaging technique for quantifying cardiac function because the image acquisition is operator and acoustic window dependent. The quantification of ventricular function is limited by a priori geometric assumptions that may provide a reasonable assessment in the normal ventricle but are less reliable in remodeled hearts, owing to complex irregular shape changes. M-mode echocardiography was developed in the early 1970s and was immediately applied in practice for LV function assessment, because of its simple algorithm and noninvasiveness. In this technique, mid-LV diameters are measured in the minor axis ( Fig. 16.1 ), and volumes are obtained by cubing these values (thereby cubing the errors). Functional estimates, such as fractional shortening and ejection fraction (EF), are then derived from these diameters and volumes, respectively. This method assumes a number of facts that are not always true: that the minor-axis view is strictly perpendicular to the LV long axis, that a single view is representative of all the myocardial segments, and that contraction is uniform throughout the ventricle. Two-dimensional echocardiography (2DE), with the ability of imaging the heart in tomographic views, considerably improved the accuracy of LV volume measurement, providing the opportunity to derive the cardiac function from cardiac volumes by the area-length and modified Simpson’s method of discs ( Fig. 16.2 ). This, however, relies on assuming that the left ventricle has a uniform shape with no regional wall motion abnormalities and on good visualization of the entire endocardial border, which is frequently not possible, although several software-based algorithms for automatic endocardial border detection and online calculation of LV volume have been developed. For example, in a multicenter study that required good-quality echocardiograms as an entry criterion, the echo core laboratory was unable to perform a confident two-dimensional (2D) analysis in 31% of patients. Thus being the most frequently used modality in clinical practice, echocardiography has gained limited acceptance in clinical trials, owing to its moderate reproducibility and accuracy to define LV ejection fraction (LVEF), because of geometric assumptions, poor acoustic windows, foreshortening of the ventricle, and inadequate discrimination of the endocardial border. Overall, the practical difficulties of quantifying global function by echo are underlined by the fact that, in the “real world,” it is often simply estimated by the clinician performing the imaging. This is highly subjective but can be clinically valid with experience. Other echocardiographic methods, derived from Doppler analysis, have been validated for evaluation of global myocardial performance that do not require geometric assumptions and do not rely on endocardial border delineation. These include for instance the Tei index, which is less load dependent, the d P /d t , which requires mitral regurgitation to be present, and tissue Doppler mitral annular systolic velocity. However, these methods require a good alignment of the ultrasound beam with flow or myocardial motion and have not been really implemented for daily clinical use. Some years ago, two advances in echocardiography helped improve accuracy and reproducibility of ventricular function assessment. On the one hand, contrast echocardiography has been shown to allow improved assessment of LV volumes and LVEF, with low interobserver variability, thanks to better endocardial border delineation, thus improving the assessment of LV dimensions and wall motion ( Fig. 16.3 ). On the other hand, three-dimensional (3D) echocardiography has emerged as a more accurate and reproducible approach to LV quantitation by removing the need for geometric assumptions and eliminating the errors caused by foreshortened apical views. Volumetric analysis of real-time 3D echocardiographic data allows fast dynamic measurement of LV volumes. 3D echocardiography has good reproducibility and good agreement with CMR measurements of LVEF, whereas the agreement of volumes is worse. Although in the past this technique needed a stable cardiac rhythm and constant cardiac function during a moderately long acquisition, recent developments have allowed a full pyramidal dataset to be acquired in a single heartbeat, during a short breath-hold, thus eliminating motion artifacts, and without the need for off-line reconstruction. Still, issues such as its low temporal resolution, lateral attenuation, dependency on acoustic window and on endocardial border delineation, and practicality in clinical practice still remain to be fully assessed as more experience is gained. The use of contrast may overcome some of these limitations. A recent multicenter study has shown that contrast administration on 3D echocardiography results in improved determination of LV volumes and reduced interreader variability. Finally, speckle-tracking imaging is a relatively new tool to assess LV function through measurement of myocardial strain, with a high temporal and spatial resolution, and a better inter observer and intraobserver reproducibility compared with Doppler strain. It is angle independent, not affected by translation cardiac movements, and can assess simultaneously the entire myocardium along all the 3D geometrical (longitudinal, circumferential, and radial) axes. Again, there are pitfalls such as low spatial and temporal resolution of this technique, reproducibility problems across vendors, and lack of wide availability of the technique, which currently is used in the clinical setting, mainly for monitoring cancer therapy–related cardiotoxicity.


Nuclear Cardiology
Nuclear cardiology with radionuclide ventriculography with either Tc-99m-labeled red blood cells or human serum albumin is commonly used to measure ventricular function by measuring the LVEF, with high accuracy and reproducibility, but it has relatively low spatial and temporal resolution, and preparation and scanning times are relatively prolonged. In addition, ventricular volumes are difficult to measure and are rarely performed clinically, and ventricular mass cannot be obtained. Furthermore, the accuracy of the LVEF obtained with a multigated acquisition (MUGA) scan decreases in patients with irregular heart rhythms. Last but not least, with this scan the patient is exposed to an amount of radiation of up to 6 mSv, which is roughly twice the normal background radiation a person receives in 1 year. Consequently, this technique is very rarely used today for ventricular function analysis, not even for monitoring cardiotoxicity of cancer therapies which used to be its main indication. The use of gated perfusion single-photon emission computed tomography (gSPECT) has allowed the development of 3D solutions to global and regional ventricular function, and this has achieved widespread use, especially in the United States. This technique is most useful when perfusion needs to be assessed, and it adds prognostic value to the stress perfusion assessment ; however, it is very rarely performed solely to assess ventricular function ( Fig. 16.4 ). This technique has good reproducibility both for ejection fraction and ventricular volumes, but there are a high number of variables that can affect accuracy, and must be carefully taken care of, including (1) acquisition variables, such as count density per frame, frame rate, or acquisition protocol; (2) processing variables, including reconstruction algorithm, filtering, automation, definition of endocardium and epicardium, definition of hypoperfused walls and valve plane; and (3) patient-dependent variables like heart rate variability, arrhythmia, patient motion, extracardiac uptake close to the LV, small and large left ventricles, and hypoperfused areas. There is special concern in both small and large ventricles because of the limited spatial resolution and the problems of assigning, either manually or automatically, a ventricular border in areas of transmural infarction and thinning where counts are very low. Tc-99m sestamibi ECG-gated SPECT can predict ventricular remodeling in patients with ischemic cardiomyopathy, but 3D echocardiography seems to be more accurate than gated SPECT for estimation of LV remodeling. With respect to radiation dose, advances in hardware, including ultrahigh-sensitivity detectors, dedicated geometry, shorter scan times and optimized reconstruction, and software, with implementation of improved reconstruction algorithms, have obtained total radiation doses of 4.2 to 6.8 mSv. Recently, ECG-gated F-18 fluorodeoxyglucose positron emission tomography ( 8 F-FDG PET) has been shown to be reasonably accurate for measurement of cardiac function, but this technique is expensive, time consuming, and is usually performed only in viability studies. Typical radiation doses for cardiac 18 F-FDG PET scans are now around 7 mSv. Importantly, for all these nuclear cardiology techniques, the need for repeated radionuclide doses in follow-up studies is highly problematic, especially for research, in which radiation exposure must be justified in a milieu of competing technologies and public pressure in general to limit radiation burdens.

Computed Tomography
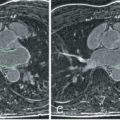
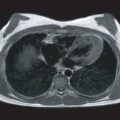
Electron beam tomography has been used in the past to study both function and perfusion, but technical questions prevent its clinical role. Multidetector computed tomography (MDCT) of the heart is a rapidly developing technique that is used mainly to evaluate the coronary arteries. It can also be used for evaluating global and regional ventricular function, with presumably higher accuracy than SPECT, 2D/3D echocardiography and cineventriculography, and with good agreement with CMR. The acquisition time is short and postprocessing tools allow fast and semiautomatic determination of LV function parameters from MDCT data with two methods, the ventricular threshold method and, in analogy to known CMR evaluation approaches, myocardial analysis ( Fig. 16.5 ). It cannot be considered a first-line modality, owing to the exposure to radiation, the use of potentially nephrotoxic contrast, and the low temporal resolution (80–200 ms), but it may be used for accessory dynamic information in patients undergoing computed tomography (CT) coronary angiography. New ultralow-dose CT scanners can acquire a study for coronary artery assessment with as low as 1 mSv , but for ventricular function, retrospective ECG-gated helical acquisition must be used, which increases the radiation dose significantly. Some reference ranges have been established for this technique. MDCT reproducibility for volumes and function is lower than that with CMR, with an interobserver variability of 4.2% for end-diastolic volume, 5.4% for end-systolic volume, and 4.1% for LVEF.

Cardiovascular Magnetic Resonance
CMR has some fundamental advantages over other imaging techniques, which have fueled the growing enthusiasm for its use in clinical practice and research. CMR offers accurate and reproducible tomographic, static, or cine images of high spatial and temporal resolution in any desired plane without exposure to contrast agents or ionizing radiation. As such, true two-chamber and four-chamber and short-axis views can be easily and rapidly acquired to allow a visual, qualitative assessment of function, similar to that of echocardiography. The main advantage of CMR, however, lies in its quantitative accuracy and reproducibility.
There are two main methods for measuring the end-diastolic and end-systolic volumes. The earliest semiquantitative method was an adaptation of the echo area-length method, in which the volume of the left ventricle is assumed to constitute an ellipsoid. With a single apical four-chamber view, the area (A) of the LV endocardial border can be traced, as well as the length (L) from the apex to the mitral annulus. The volume (V) for systole and diastole is then easily calculated: V = 0.85 A 2 / L . A more accurate adaptation uses both long-axis planes (vertical and horizontal long axis [VLA and HLA, respectively]) to measure two perpendicular areas and lengths: V = (0.85 × area 1 × area 2)/smaller length ( Fig. 16.6 ). Although this offers a simple and time-efficient volume analysis, it suffers from the same limitations that echocardiography has: the need for geometric assumptions and the inability to take into account regional differences in wall motion. An example of a distorted heart postinfarction is shown in Fig. 16.7 .


A better method of measuring volumes and thereby function is by the use of Simpson’s rule. A stack of contiguous tomographic slices are acquired that encompass the entire left ventricle. The ventricular volume is equal to the sum of the endocardial areas multiplied by the distance between the centers of each slice ( Fig. 16.8 ). The volumes that are obtained by this method are independent of geometric assumptions and dimensionally accurate. At one time, it was common to use a stack of transverse images for this measurement, but although this makes it easy to define the mitral valve plane and thereby the true base of the LV, it is also subject to considerable partial volume effects, especially in the inferior wall. For this reason, more recently, short-axis slices were employed, and nearly all sites specializing in CMR have adopted this practice ( Fig. 16.9 ). The question has been raised as to whether or not the right ventricular (RV) volumes should be measured in the axial orientation because this appears to have better interobserver and intraobserver reproducibility. Yet the interstudy reproducibility of RV measurements in the short-axis orientation is good, with differences not clinically significant and in practice, this orientation allows the LV and RV dimensions to be measured simultaneously. Rotational long-axis views have also been proposed as an alternative to short-axis-derived methods because it has been suggested that they would have less partial-volume effects and would be less time consuming, but this method has not gained wide acceptance so far.


In the past, to achieve full 3D coverage of the ventricle using conventional free-breathing gradient echo cine sequences, a total scanning time of 30 minutes or more was required, but on modern scanners with fast imaging, a single cine can be acquired in just one breath-hold of about 8 to 10 seconds, with good spatial and temporal resolution, allowing the whole stack of images to be acquired in 5 to 8 minutes. This also has the considerable additional advantage of reducing breathing and movement artifacts. Moreover, real-time steady-state free precession (SSFP) imaging can acquire all the ventricular slices in just one breath-hold with acceptable accuracy and image quality. In patients who are unable to hold their breath consistently or who are orthopneic, solutions using the same sequence with more signal averages or combined with navigator echo imaging have been shown to be successful, during free breathing, with a slight increase in the acquisition duration.
In addition to the left ventricle, it is important to remember the right ventricle, as its function is also known to be an important determinant of prognosis, both in coronary artery disease and in heart failure, congenital heart disease, and pulmonary disease. Global RV function is difficult to assess adequately by echocardiography, whereas radionuclide ventriculography suffers from assumptions concerning projection of overlapping structures unless research techniques such as first-pass techniques with ultra-short half-life isotopes are used. CMR does not experience such problems, and RV function and mass are well characterized. The right ventricle is discussed in greater detail in Chapter 39 .
From Gradient Echo to Steady-State Free Precession Cine Sequences
Gradient recalled echo (GRE) cine sequences were the first ones to be implemented, but nowadays their use is limited to situations where SSFP sequences are suboptimal, usually in patients with implanted devices that cause significant artifacts. SSFP sequences rephase the transverse magnetization that undergoes dephasing during phase encoding and readout between radiofrequency (RF) pulses; therefore imaging occurs when all transverse and longitudinal magnetization components are at steady state. SSFP cine imaging eliminates blood saturation artifacts and makes the cines independent of in-flow enhancement and based on the ratio of T2 to T1. This results, compared with GRE, in higher signal-to-noise ratio (SNR) and substantially improved blood-myocardium contrast, which may allow easier delineation of the endocardial borders. At the epicardial border, fat-myocardium delineation is also improved.
The SSFP sequence runs at its best with ultrafast gradients because a very short repetition time (TR) is required to reduce the sensitivity of the sequence to movement artifact. Because of these characteristics, LV end-diastolic and end-systolic volumes are larger and LV mass is smaller with SSFP than with GRE. In terms of reproducibility, only EF shows differences favoring SSFP, whereas SSFP and GRE are equal for volumes and mass reproducibility.
Nowadays, improved performance is no longer gained through improvements in gradient hardware. The introduction of parallel imaging, either image based such as sensitivity encoding (SENSE) or k -space-based such as generalized autocalibrating partially parallel acquisitions, provides alternative means for increasing acquisition speed. By using information from multiple receiver coils, images can be reconstructed from a sparsely sampled set of data, allowing for 2- to 3-fold acceleration of the imaging process. However, further increases in acquisition speed are difficult to achieve for current clinical field strengths and typical fields of view. More recently developed methods are based on temporal undersampling, k-t broad-use linear acquisition speed-up technique (BLAST) and k-t SENSE, have been proposed that significantly improve the performance of dynamic imaging, taking into account the similarity of image information at different time points during a dynamic series. These methods improve temporal resolution (5- to 8-fold acceleration) or spatial resolution for a given amount of acquisition, and they also enable the acquisition of 3D k-t BLAST SSFP cine sequences in one breath-hold that can be used for ventricular function assessment. Another recently developed method is unaliasing by Fourier-encoding the overlaps using the temporal dimension (UNFOLD), which works by forcing aliased signals to behave in specific ways through time, so unwanted signals are detected and removed, thus reducing the amount of acquired data. This method can in theory be used with k-t SENSE and k-t BLAST to accelerate the acquisition and/or to suppress artifacts in free breathing. All these techniques are very promising but still in development, and no specific data on their use in LV function assessment are available.
Steady-State Free Precession Cine Sequences at 1.5 T vs. 3 T Magnetic Fields
There is an overall quantitative improvement in SNR for myocardium and blood at 3 T, as well as variable increase of blood-to-myocardium contrast-to-noise ratio (CNR). These SNR improvements can be translated into higher speed because they facilitate the use of parallel imaging, with higher acceleration factor and multichannel RF receiver coils, with less noise and almost identical parameters for SSFP imaging at both magnetic fields. However, accelerated acquisition results in the loss of SNR and in the introduction of noise nonuniformly, and there are some challenges that need to be addressed, including B 0 and RF inhomogeneity, limitation of flip angle and minimum achievable TR, longer T1, shortened T2* and off-resonance effects because of magnetic susceptibility gradients, which together combine to offset the advantages from SSFP at 3 T, when a reproducible image quality for cine SSFP is important for the evaluation of ventricular function ( Fig. 16.10 ). Comparative analyses of LV function indexes, mass, and volume using cine SSFP has shown no significant difference in values obtained at 3.0 T compared with 1.5 T. Nonetheless, reference values for LV function parameters have been published. Importantly, CNR between blood and myocardium seems to be reduced in the RV at 3.0 T relative to LV, which may affect reproducibility of RV functional evaluation.

Accuracy and Reproducibility of Cardiovascular Magnetic Resonance
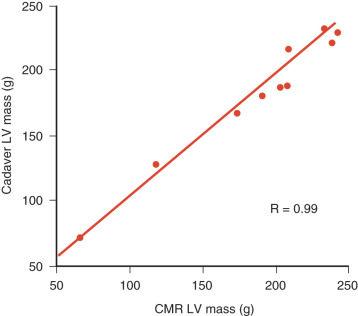
It is now widely accepted that CMR offers the reference standard for the noninvasive assessment of cardiac function, being both accurate ( Figs. 16.11 to 16.14 ) and reproducible in normal as well as abnormal ventricles, both with nonbreath-hold and breath-hold techniques. This is illustrated in Fig. 16.15 , which shows the intraobserver, interobserver, and interstudy variability for volume and functional assessment by breath-hold CMR in dilated and normal ventricles, compared with conventional cine CMR.


CMR has been shown to have higher reproducibility than 2DE for LV end-systolic volume (4.4% to 9.2% vs. 13.7% to 20.3%, P < .001), LVEF (2.4% to 7.3% vs. 8.6% to 19.4%, P < .001), and LV mass measurements (2.8% to 4.8% vs. 11.6% to 15.7%, P < .001), and this higher reproducibility allows for sample size reductions of 55% to 93%. The excellent reproducibility of CMR versus 2DE can be illustrated by considering the sample size required for a drug trial designed to show a 10 g decrease in LV mass with antihypertensive treatment. A direct comparison of CMR with 2DE for reproducibility has shown that for an 80% power and a P value of .05, the sample size required would be 505 patients with 2DE but only 14 patients with CMR. Equally, we have found that to show a 5% difference in EF with a 90% power and a P value of 0.05 would require only 7 normal subjects or 5 patients with dilated ventricles. Similarly, CMR measurements of RV function parameters both in healthy subjects and in patients show good interstudy reproducibility (4.2% to 7.8% for RV end-diastolic volume, 8.1% to 18.1% for RV end-systolic volume, 4.3% to 10.4% for RV ejection fraction and 7.8% to 9.4% for RV mass), which was lower than that for the left ventricle for all measures but only significantly for EF. Three-dimensional echocardiography (3DE) and administration of contrast are claimed to improve accuracy and reproducibility. In a study that compared 2DE, 3DE, and contrast-enhanced 3DE (CE3DE) with CMR in subjects with poor acoustic window, CE3DE showed the best agreement with CMR and was claimed to be the only acceptable alternative for CMR. In terms of reproducibility, another study compared interreader variability for LV EF measurement with 2DE, 3DE, CE2DE, CE3DE, and CMR and obtained a variability of 14.3% for 2DE and 3DE, 8.0% for CE2DE, 7.4% for CE3DE and 7.9% for CMR, then showing that 3DE requires contrast application as much as 2DE to reduce interreader variability. With respect to the right ventricle, a recent study has shown that 3DE underestimates RV volumes, with no significant differences in ejection fraction. Reproducibility has significant implications for research and in particular for pharmaceutical companies, for which CMR offers a more cost-effective and time-effective research tool.
A Practical Guide to Functional Cardiovascular Magnetic Resonance
In modern medicine, a balance must be struck between the information that can be gained from an investigation and the resources it demands. The following protocol is designed to be as efficient as possible in gaining the volumetric data from the ventricles of the heart (see Chapter 15 ). Fig. 16.16 illustrates the sequence of pilot images used to achieve imaging in the long axis of the left ventricle and thereby the true short axis. A coronal pilot is first taken and used to acquire transverse pilots, which show both the mitral valve and the apex of the left ventricle. By taking a plane through the center of the mitral valve (halfway between the back end of the septum and the back end of the lateral wall) and the tip of the apex, the vertical long axis (VLA) is acquired. This VLA is used to plan the horizontal long axis (HLA), by again using a plane through the center of the mitral valve (halfway between the back of the anterior and inferior walls) and the tip of the apex. It should be noted that it is common to find centers describing planes that are parallel to the septum for the VLA and parallel to the inferior wall for the HLA, but these are not correct because they are likely to lead to the long-axis plane not passing through the center of the basal ring of the LV, and they may lead to an offset from the tip of the apex, which is also undesirable. This can lead to problems planning the short-axis cuts to adequately cover the full extent of left and right ventricles; in addition, it reduces the reproducibility of the short-axis plane positioning for repeated studies. Finally, the short-axis slices are placed on the HLA to encompass the heart. To achieve the most reliable results, which are the most reproducible, attention to detail is required. First, if the short-axis cuts are to be acquired by using a breath-hold cine sequence, then the VLA and HLA must also have been acquired by using a breath-hold and at end expiration. Second, in using breath-hold techniques, it is more reproducible to ask the patient to hold the breath at end expiration rather than elsewhere in the respiratory cycle; this applies to the pilots as well as to the cines. Third, the first short-axis plane should be placed at the base of the heart, covering the most basal portion of the left and right ventricles just forward of the atrioventricular (AV) ring, and it should be placed on the end-diastolic HLA image. Finally, further short-axis planes should then be planned to move apically from this plane until the apex is encompassed. Although it is possible to acquire the VLA and HLA as single pilot images instead of cines, there is little practical merit in this because the time for two breath-hold cines is small, and the contraction pattern in these two planes is very useful during qualitative assessment of ventricular function. Nowadays, with the development of 3D postprocessing software solutions for analyzing the cines, these long-axis cines are mandatory. Also, full 3D analysis of atria as well as ventricles is simple and practical with automated analysis, in which case cines encompassing the entire heart should be acquired.

Related posts:
 Use of Navigator Echoes in Cardiovascular Magnetic Resonance and Factors Affecting Their Implementation
 Acute Myocardial Infarction: Cardiovascular Magnetic Resonance Detection and Characterization
 Atherosclerotic Plaque Imaging: Coronaries
 Cardiac Iron Loading and Myocardial T2*
 Pulmonary Vein and Left Atrial Imaging
 Noncardiac Pathology
Stay updated, free articles. Join our Telegram channel

Full access? Get Clinical Tree


