Abstract
Echocardiography can assess both systemic blood flow and heart function. This chapter offers an overview of heart function assessment by conventional echocardiographic techniques in the newborn infant. Systemic blood flow is a dynamic and complex variable. The presence of persistent fetal shunts influences the assessment of systemic blood flow by left and right ventricular output. Hence the use of superior vena cava flow has been introduced as a surrogate measure of systemic blood flow in neonates with persistent fetal shunts. Cavity measures assess the cardiac function relative to the loading conditions. Fractional shortening and ejection fraction are the most common cavity indices of the left ventricle. The assessment of right ventricular size, volumes, and function is controversial because of the ventricle’s complex geometric structure. Finally, mitral and tricuspid annular plane systolic excursions assess the motion of the atrioventricular plane relative to the apex.
Keywords
blood flow velocity, Doppler, echocardiography, ejection fraction, fractional shortening, infant, mitral annulus plane systolic excursion, newborn, premature, superior vena cava, systemic circulation, tricuspid annulus plane systolic excursion, ventricular
- •
Echocardiography is useful for the assessment of systemic blood flow and myocardial function.
- •
Systemic blood flow is a dynamic, complex variable.
- •
Blood flow through persistent fetal shunts influences cardiac output measurements of systemic blood flow from both ventricles.
- •
Superior vena cava flow can be used as a surrogate measure of systemic blood flow in neonates with persistent fetal shunts.
- •
Fractional shortening and ejection fraction are the most commonly used indices of left ventricular cavity function.
- •
The assessment of right ventricular size, volumes, and function by echocardiography is controversial because of the complex geometric structure of the ventricle.
- •
Mitral and tricuspid annular plane systolic excursions assess the motion of the atrioventricular plane relative to the apex and are, respectively, indices of left and right ventricular systolic function.
- •
None of these indices of heart function are independent of load.
- •
It is important to interpret any (conventional) echocardiographic index of heart function in context with the clinical situation, loading conditions, and other echocardiographic indices.
Although monitoring itself cannot directly improve outcomes, it helps the intensivist to assess a patient’s hemodynamic status. Reliable methods to monitor cardiovascular and hemodynamic function are important for assessing circulatory disturbances and guiding optimal therapy. In clinical practice as well as in clinical research, echocardiography has been useful for this assessment. A complex integration of different echocardiographic modalities is necessary for the assessment of structure and dimension, blood flow, myocardial function, and loading conditions. Basic knowledge of physical and technical principles of the different modalities, sufficient operator skills, and experience measuring relevant echocardiographic indices—as well as a comprehensive understanding of normal physiologic and pathologic processes—are essential for the optimal use of echocardiography.
Traditionally echocardiography has been used to diagnose and monitor congenital heart disease and to screen for patent ductus arteriosus (PDA), primarily in preterm neonates. It is also useful for assessment of the hemodynamic status of newborns with abnormal cardiovascular adaptation, circulatory disturbances, myocardial dysfunction, pericardial or pleural effusion, thrombosis, and for assistance with the placement of central lines.
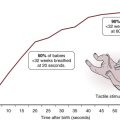
An understanding of the physiology of cardiovascular adaptation and the effect of different diseases and degrees of prematurity is a key factor for the interpretation of findings. The complex cardiorespiratory changes that take place during the transitional period from the fetal to neonatal circulation phenotype may be critical in both preterm and sick term infants. The onset of breathing promotes a rapid decrease in pulmonary vascular resistance, with a subsequent increase in pulmonary blood flow. The increased pulmonary venous return increases the left heart preload and enables the left heart to handle the raised afterload following cord clamping and disconnection of the low-resistance placental circuit. The impact of the timing of cord clamping on cardiovascular transition is discussed in Chapter 4 , Chapter 5 . Although the right ventricle (RV) plays the dominant role in fetal life, the left ventricle (LV) takes over after delivery.
Closure of the fetal shunts normally starts with functional closure of the foramen ovale due to the altered pressure difference between the two sides of the heart. However, a small left-to-right shunt across the foramen ovale may persist for a while after birth. The inverted pressure difference between the aorta and the pulmonary artery after birth reverses the shunting of blood through the ductus arteriosus from right to left to left to right. In term neonates, the functional closure of the ductus arteriosus normally takes place within the first 2 to 3 days of postnatal life, while the ductus venosus may persist for several days after birth.
A variety of conditions in the perinatal period—such as asphyxia, respiratory distress, sepsis, and metabolic and hematologic diseases—can disturb the transitional phase and affect the cardiovascular system. Persistent pulmonary hypertension of the newborn (PPHN) with persistent high pulmonary vascular resistance may be due to fetal and/or perinatal hypoxia, resulting in abnormal pulmonary vascular development, responsiveness to local vascular mediators, and/or to hypoxia caused by lung disease or apnea. PPHN is characterized by right-to-left shunting across the foramen ovale and ductus arteriosus and increased RV afterload, especially when ductal flow is restrictive. The latter may affect coronary blood flow and subsequently myocardial function; as a result, the decreased left ventricular filling further affects myocardial function. If left untreated, systemic circulatory failure (shock) may develop due to low systemic blood flow.
Preterm infants are especially vulnerable in the transitional circulatory phase (see Chapter 1 , Chapter 26 ). The fetal myocardium has a higher water content and is less organized than it is later in life. The immature myocardium is dominated by mononucleated myocytes, fewer sarcomeres, and different isoforms of contractile proteins. Consequently it is less compliant, has less contractile ability, and is less tolerant of the abrupt changes in preload and afterload at birth than the mature heart. In preterm neonates with a PDA, the effect of the gradually increasing left-to-right ductal shunting on cardiac performance has opposite effects on the pulmonary and systemic circulation. It contributes to the increased pulmonary blood flow immediately after birth, but a significant left-to-right shunt may impair systemic blood flow and cause a deterioration in cardiac performance and organ perfusion.
Assessment of Systemic Blood Flow by Ultrasound
Systemic blood flow is a complex dynamic variable with rapid fluctuations caused by changes in the functional activity and metabolic demand of the different organs. Doppler echocardiography offers direct and indirect measures of systemic and organ blood flow.
Blood flow by Doppler echocardiography is calculated as the product of the displacement of the velocity profile, called the velocity-time integral (VTI) of blood flow velocity; the cross-sectional area of the vessel at the site of the measurement; and the heart rate. VTI is measured by tracing the pulsed Doppler velocity signal and the cross-sectional area by measuring the diameter (D) and calculating the area as π × radius (D/2) 2 . Assuming a circular vessel with a constant cross-sectional area, blood flow (volume per time, usually mL/min) is calculated as VTI (for one heartbeat) × π × (D/2) 2 × heart rate. A prerequisite for this calculation is a laminar parabolic flow profile representative of long, straight blood vessels under steady flow conditions. Blood flow in neonates is usually indexed by weight (mL/kg/min). In obtaining the VTI, it is important to minimize the angle of insonation and to assess the diameter with the ultrasound beam perpendicular to the vessel at the true (maximal) diameter. An inappropriate angle will underestimate the VTI and overestimate the diameter. Owing to the squaring of the radius in the formula, inaccurate measures of the diameter may have considerable influence. It is recommended to average the measurements from a minimum of five cardiac cycles in order to minimize measurement error. Flow measurements are hampered by significant intra- and interobserver variability.
Left Ventricular Output
Left ventricular output (LVO) reflects the systemic blood flow in the absence of ductus arteriosus shunt. LVO velocity is usually measured at the aortic valve or in the ascending aorta from an apical or suprasternal window ( Fig. 11.1 ). The angle of insonation may be a challenge in neonates because the aorta exits the heart more horizontally in infants than in adults. A reproducible left outflow diameter is easier to achieve. There are different opinions about where to measure the diameter; from the low parasternal window at the hinge of the aortic valve cusps, at the systolic leaflet separation, or just beyond the sinus of Valsalva in the ascending aorta. It is important to perform serial measures in a consistent way. Accurate measures require assessment of the VTI and cross-sectional area at the same position within the heart. Several studies have validated flow measurements by VTI and cross-sectional area against other techniques. Importantly, LVO will overestimate systemic blood flow if there is left-to-right shunting across the ductus arteriosus; this is especially relevant in preterm infants with a large ductal flow. In PPHN with a large amount of right-to-left shunting, LVO may underestimate the systemic blood flow.

Right Ventricular Output
Right ventricular output (RVO) may be a more feasible index for systemic blood flow in neonates and especially in preterm babies. Even though RVO may be confounded by shunting across the foramen ovale, the atrial shunting is usually less than the ductal shunting ; impaired systemic blood flow is therefore extremely rare when the RVO is normal. Because the main pulmonary artery is directed in a posterior direction, it is usually possible to obtain an optimal insonation angle for velocity measurements from the parasternal view ( Fig. 11.2 ). The diameter measurement of the pulmonary artery is challenging. It is best obtained at the valve leaflet insertion from a parasternal short-axis or long-axis view.

The normal cardiac output from both the left and right ventricles in neonates is in the range of 150 to 300 mL/kg/min.
Superior Vena Cava Flow
Due to the influence of fetal shunts on cardiac output from both ventricles, assessment of superior vena cava (SVC) blood flow can be used as a substitute for or an additional measure of systemic blood flow. As the brain is one of the main target organs for adequate perfusion, a focus on the return of blood from the upper body and brain may be justified. However, one must use caution in using SVC flow to assess brain blood flow because, contrary to the adult, only around 30% of the blood in the SVC of a preterm neonate represents blood returning from the brain (see Chapter 2 ). A desirable angle of insonation for Doppler velocity measurement can be obtained from the low subcostal window ( Fig. 11.3 ). The SVC VTI often exhibits three peaks per heart cycle; one positive peak in systole, one positive peak in early diastole, and one (usually negative) peak in late diastole (during atrial systole). The original description of the technique recommends subtracting the significant negative peaks in assessing the VTI and averaging the VTI from 10 cardiac cycles because of the impact of respiration and the cardiac variations on the velocity profile (see Fig. 11.3 ). As for the other estimates of blood flow, it is important to assess the VTI and the cross-sectional area of the vessel from the same place. The diameter is best measured at the entrance into the right atrium—just prior to the “funneling” or opening up of the vessel into the right atrium—from a long-axis low- to midparasternal view at the inlet into the right atrium (see Fig. 11.3 ). SVC diameter varies more in size than the great arteries and an average of the maximum and minimum diameter over several heart cycles is recommended, either on a two-dimensional (2-D) image or by use of M-mode. Mean SVC flow increases from about 70 to 90 mL/kg/min from 5 to 48 hours postnatally; the normal range is suggested to be between 40 and 120 mL/kg/min.

The technique for measuring SVC flow by ultrasound has limitations. Although Doppler measures of arterial blood flow in the central circulation have good reproducibility and correlate well with invasive measures of blood flow, it is debated whether this is also the case for venous flow. The most important methodologic problems with the assessment of SVC flow relate to the uncertainty associated with calculating the cross-sectional area of the vein. The formula presupposes a perfectly round vessel and uses the square of the vessel diameter to calculate a static cross-sectional area. These geometric presuppositions and the squaring of linear data amplify measurement errors. A modification of the technique for measuring SVC flow was recently published. By interrogating SVC Doppler flow from a suprasternal window and measuring the cross-sectional area from a short-axis view where the maximum and minimum cross-sectional areas are directly traced, agreement with the magnetic resonance imaging (MRI)–derived SVC flow is better. Additionally, the measure has less inter-user variation. The middle panel of Fig. 11.3 shows the SVC in cross-section, where a direct area tracing may be measured.
No study has yet compared RVO or SVC flow by echocardiography against invasive measures in neonates. One MRI study found the SVC method to be inaccurate, but others have criticized the study for not fulfilling standard criteria for repeated measurement validations. Most guidelines for functional echocardiography in neonates do recommend the use of SVC flow, and it has been validated against longer-term outcomes.
Cavity Measures
Calculation of cavity function indices involves assessment of changes between the largest and smallest cavity measurements in the cardiac cycle (usually systole and diastole). Indices based on percentage change between measurements or sizes describe heart function relatively independent of heart size. More geometric assumptions are a prerequisite for the estimation of cavity sizes from unidimensional measurements compared with using two-dimensional measurements.
Cavity Measures of the Left Ventricle
LV function indices are the most frequently used indices of heart function in neonates. Despite growing evidence of its shortcomings and low ability for detecting pathology and maturational changes, the most frequently used cavity index in neonates is fractional shortening (FS). FS is assessed as the relative change in the internal diameter of the LV during the cardiac cycle. Diameters in systole and diastole relate closely to weight, whereas normal FS values are often 30% to 45% and exhibit little variation by weight. FS can be obtained from the parasternal or subcostal views using M-mode or two-dimensional images ( Fig. 11.4 ). Measurements from two-dimensional recordings enable the interrogation of lines crossing the ultrasound beams ( Fig. 11.5 ), but this also has lower time-resolution than M-mode images. The diameter is assessed perpendicular to the cavity at the tip of the mitral valve leaflets. Its use as a cavity measure has, as a prerequisite, normal LV geometry and symmetric contraction, including normal septal motion.


Ejection fraction (EF) is the fraction of end-diastolic volume ejected during systole. Guidelines acknowledge the estimation of EF by LV cavity areas from apical four-chamber and two-chamber views at end-systole and end-diastole by the Simpson biplane method. Biplane EF has shown better discriminating capabilities than FS in neonates. The Teich formula estimates the EF from the FS. The geometric assumptions for this formula are seldom met in pathologic states, and guidelines today do not recommend reporting EF estimates from FS.
Older assessment methods of EF, rarely used nowadays, include area-length methods and fractional change of LV area from apical four-chamber views.
Cavity Measures of the Right Ventricle
There are still controversies on how to assess RV size, volume, and function because of the RV’s complex geometric structure, and no accepted echocardiographic gold standard is available at present. Cavity measurements of the RV using ultrasound underestimate measurements by MRI, and the two modalities correlate poorly, especially in situations with volume overload. The fractional area change assesses the relative change in RV area during contraction; it is usually obtained from an RV-focused apical four-chamber recording by counterclockwise rotation from the standard four-chamber view to expand the RV cavity to its maximum area.
Use of Cavity Measures
Cavity measures assess the myocardial function relative to the loading conditions and are not per se indices of the contractile properties of the myocardium. Preload has a direct impact on most diastolic cavity sizes. A high preload tends to increase diastolic sizes. The diastolic cavity sizes are the denominators in the formulas and, if isolated, this would decrease the cavity functional indices. However, high preload also increases contraction due to the Frank-Starling effect, and the net effect of the increased preload is increased cavity functional indices in most clinical situations. Increased afterload tends to increase end-systolic sizes and hence to reduce the cavity functional indices. Factors within the myocardial wall can affect cavity measurements, as hypertrophic walls lead to smaller cavity measurements. The relative impact on the measurements could be higher in systole, leading to higher cavity functional indices.
Severe preload and afterload alterations will influence the measurements in different hemodynamic scenarios. A premature neonate with normal LV contractility for maturity and gestational age and with a large persistent ductus arteriosus might have LV function indices indicating normal or higher-than-normal function because of the high preload and low afterload. A neonate with normal RV contractility and PPHN might have reduced RV indices due to high afterload and possibly reduced LV indices due to low preload. In situations of reduced intrinsic myocardial contractility, cavity measures can be low in severe cases. Other studies have shown that cavity measures are relatively insensitive as heart function indices in clinical situations with reduced contractility, especially for unidimensional measurements.
Related posts:
 Point of Care Ultrasound in the Assessment of the Neonatal Cardiovascular System
 Hemodynamic Significance and Clinical Relevance of Delayed Cord Clamping and Umbilical Cord Milking
 Definition of Normal Blood Pressure Range: The Elusive Target
 Principles of Developmental Cardiovascular Physiology and Pathophysiology
 Speckle Tracking Echocardiography in Newborns
 Cardiac Magnetic Resonance Imaging in the Assessment of Systemic and Organ Blood Flow and the Function of the Developing Heart
Stay updated, free articles. Join our Telegram channel

Full access? Get Clinical Tree


