Fig. 1
A statistical atlas of the spatial distribution of gray mattr (GM) in a population of elderly healthy individuals. Hot colors indicate brain regions with the highest frequency/volume of GM in the population. A new individual’s spatial distribution of GM can be contrasted against this atlas, to identify regions of potentially abnormal brain atrophy
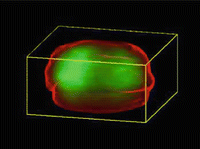
Fig. 2
A statistical atlas of the spatial distribution of prostate cancer obtained from co-registered prostatectomy specimens. Brighter green indicates areas of higher cancer incidence. This atlas can potentially be used to guide biopsy procedures aiming to obtain tissue from regions more likely to host cancer
Statistical atlases are quantitative analogs to the knowledge acquired by a radiologist during clinical training, in that they learn patterns from large number of scans, and represent anatomical or functional variability in a group of individuals. The two most common ways in which atlases are used are the following:
1)
To compare two groups of individuals, for example a group of patients with a specific disease and a group of healthy controls. Conventional approaches havse used standard linear statistics [40]. However, the more and more common use of multi-parametric or multi-modality images calls for more sophisticated statistical image analysis methods that determine often nonlinear relationships among different scans, and therefore lead to the identification of subtle imaging phenotypes. Section 3 discusses some of the approaches and challenges.
2)
To compare an individual with a group of individuals. For example, one might want to evaluate whether a patient with cognitive impairment presents the spatial pattern of brain tissue atrophy that is common to Alzheimer’s disease patients. The individual’s scans are then to be compared with the statistical atlas of AD patients. High-dimensional pattern classification methods are finding their way into the imaging literature more and more frequently, providing a new class of imaging-based diagnostic tools. Some of the work in this direction is discussed in Sect. 4.
A fundamental process in constructing a statistical atlas is that of registration, i.e. the process of bringing scans from different session and different individuals into a common spatial coordinate system, where they can directly be compared with each other and integrated into a statistical atlas. This process is described in Sect. 2.
2 3D and 4D Deformable registration
Image analysis methods have been studied in the literature during the past 15 years [3, 6, 12, 22, 26, 38, 46, 47, 50, 60, 65, 67, 69, 76, 77, 81]. One very promising approach for morphometric analysis is based on shape transformations that maps one template of anatomy (e.g. a typical brain, spinal, cardiac, or prostate image) to an image of interest. The resulting transformation measures the detailed differences between the two anatomies under consideration. So far, many methods have been proposed in the literature for obtaining the shape transformations, typically based on a method called deformable image registration.
The goal of deformable image registration is to find a transformation that maps every point in one image to its matching point in another image. Matching points should correspond to the same anatomical feature or structure. Also, the resulting shape transformation is usually required to be a diffeomorphism, i.e., a differentiable and invertible mapping between the domains of the two images. So far, various methods have been proposed for deformable image registration [1, 2, 6, 11, 18–20, 24, 31, 40, 42, 44, 49, 62, 68, 79, 81, 89, 90], which fall into three categories, i.e., landmark-based registration, intensity-based registration, and feature-based registration. Each of these methods has its own advantages and disadvantages, as descried below.
The landmark-based methods utilize the prior knowledge of anatomical structure and thus are computationally fast since they do not evaluate a matching criterion on every single voxel in an image. Generally, a human rater is required to define a number of identifiable landmark points on a template and to manually locate their corresponding points on each of the images that are subject to the analysis. The beginning of the modern phase of this approach in medical imaging could perhaps be dated back to 1989 with Bookstein’s work on landmark-based morphometrics [6]. Shape transformation is obtained by interpolating the mapping on the landmarks everywhere else in the image, using a thin plate spline model. This approach has been mainly used in 2D neuroimaging studies, often restricted to the corpus callosum, since not many anatomical structures lend themselves to 2D analysis. Moreover, defining landmarks in 3D with high accuracy and reproducibility is often a very difficult and impractical task, especially in large studies. Also, it is time-consuming to manually place a sufficient number of landmarks for accurate registration.
The intensity-based methods [11, 12, 17, 21, 36, 39, 60, 68, 79] aim to maximize the intensity similarity of two images, and can be fully automated since they do not require the construction of a specific anatomical model each time they are applied to a new problem. These methods assume that if a shape transformation renders two images similar, it implies anatomical correspondence between the underlying anatomies. This is a reasonable assumption, but it can easily be violated in practice, since two images can be made similar via shape transformations that do not respect the underlying anatomical correspondences.
Somewhat related to image intensity matching are the methods optimizing information theoretic criteria, in order to find appropriate shape transformations. The main advantage of these methods over intensity similarity methods is that they can be potentially used for multi-modality image registration, particularly when the tissue intensities are different in the different modality images. The most popular criterion used for multimodality image registration has been mutual information [68, 88, 91], which is maximized when the “predictability” of the warped image based on the template is maximized, and which tends to occur when the same tissue types in two images are well registered.
The feature-based registration methods formulate the image registration as a feature matching and optimization problem [16, 41, 85, 86]. A number of features, such as edges or curves or surfaces [15, 16, 29, 49, 65, 80, 81, 85], are typically extracted from the images via an image analysis algorithm, or simply drawn manually, and are then used to drive a 3D deformable registration method, which effectively interpolates feature correspondence in the remainder of the image. Feature-based methods pay more attention to the biological relevance of the shape matching procedure, since they only use anatomically distinct features to determine the shape transformation, whereas image matching methods seek the transformations that maximize the similarity of images, with little warranty that the implied correspondences have anatomical meaning. However, the latter approaches take advantage of the full dataset, and not only of a relatively sparse subset of features.
Deformable registration using attribute vectors: A method that has been previously developed by our group attempts to integrate the advantages of various methods and at the same time to overcome some of their limitations, by developing an attribute vector as a morphological signature of each point, to allow the selection of the distinctive points for hierarchically guiding the image registration procedure [71, 73, 74, 95]. This is the method called Hierarchical Attribute Matching Mechanism for Elastic Registration (HAMMER). HAMMER is a hierarchical warping mechanism that has three key characteristics.
First, it places emphasis on determining anatomical correspondences, which in turn drive the 3D warping procedure. In particular, feature extraction methods have been used for determining a number of parameters from the images, to characterize at least some key anatomical features as distinctively as possible. In [73], geometric moment invariants (GMIs) were particularly used as a means for achieving this goal. GMIs are quantities that are constructed from images that are first segmented into GM, WM and CSF, or any other set of tissues of interest. They are determined from the image content around each voxel, and they quantify the anatomy in the vicinity of that voxel. GMIs of different tissues and different orders are collected into a long attribute vector for representing each voxel in an image. Ideally, attribute vectors are made as distinctive as possible for each voxel, so that anatomical matching across individual brains can be automatically determined during the image registration procedure. Fig. 3 shows a color-coded image of the degree of similarity between the GMI-based attribute vector of a point on the anterior horn of the left ventricle and the attribute vectors of every other point in the image. The GMI attribute vector of this point, as well as of many other points in the brain, is reasonably distinctive, as shown in Fig. 3. We have also explored more distinctive attribute vectors, aiming at constructing even more reliable and distinctive morphological signatures for every voxel in the image. Toward this end, wavelet coefficients [95], multiple-scale histogram features [72], local descriptor features [92], or combinations of various local features [92] were computed for hierarchical characterization of images of multi-scale neighborhoods centered on each voxel [94, 95].
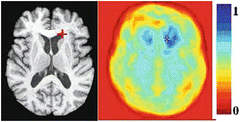
Fig. 3
The point marked by a cross has a relatively distinctive GMI-based attribute vector. The color-coded image on the right shows the degree of similarity between the attribute vector of the marked point and the attribute vector of every other point in the brain. 1 is maximum similarity and 0 is minimum similarity
Second, HAMMER addresses a fundamental problem encountered in high-dimensional image matching. In particular, the cost function being optimized typically has many local minima, which trap an iterative optimization procedure into solutions that correspond to poor matches between the template and the individual. This is partly due to the ambiguity in finding the point correspondences. For example, if many candidate points in an individual image have similar attribute vectors to that of a particular template voxel, then this introduces an ambiguity and thus local minima in the corresponding energy function. In contrast, with definition of a good set of attributes, there will be a few anchor points for which correspondences can be determined rather unambiguously, perhaps because each anchor point’s attribute vector is very different from all but its corresponding anchor point. In this way, correspondences on all other (non-anchor) points could be approximately determined via some sort of interpolation from the anchor points. This problem would not have local minima, since the cost function being minimized would be a lower-dimensional approximation involving only a few anchor points, compared to a cost function involving every single voxel in the two images under registration. HAMMER is exactly based on this fact, i.e., forming successive lower-dimensional cost functions, based initially only on key anchor points and gradually on more and more points. More points are considered as a better estimate of the shape transformation is obtained, thus potentially avoiding local minima.
Third, HAMMER is inverse-consistent, in terms of the driving correspondences. This means that if the individual is deformed to the template, instead of the converse, the mapping between any two driving points during this procedure would be identical. This feature is a computationally fast approximation to the problem of finding fully 3D inverse consistent shape transformations originally proposed by Christensen [48].
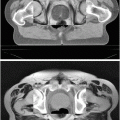
We have validated the HAMMER approach on brain images, and have found that it can achieve high accuracy, even in the presence of significant morphological differences between the two images being matched, such as differences in the cortical folding pattern of the brain. Fig. 4 show a representative example of the performance of HAMMER on MR images of elderly subjects from the Baltimore Longitudinal Study of Aging (BLSA) [66].
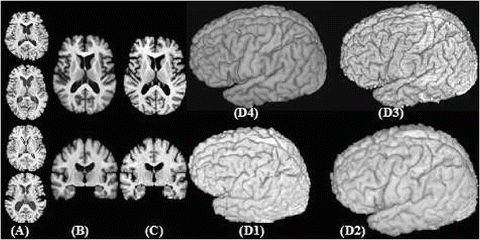
Fig. 4
Results using the HAMMER warping algorithm. (A) 4 representative sections from MR images of the BLSA database (B) Representative sections from the image formed by averaging 150 images warped by HAMMER to match the template shown in (C). (D1-D4) 3D renderings of a representative case, its warped configuration using HAMMER, the template, and the average of 150 warped images, respectively. The anatomical detail seen in (B) and (D4) is indicative of the registration accuracy
Longitudinal image registration: With a growing interest in longitudinal studies, which are important in studying development, normal, aging, early markers of Alzheimer’s disease, and response to various treatments, amongst others, securing longitudinal stability of the measurements is of paramount importance. However, in the longitudinal morphometric study, people would typically measure the shape transformation during each time point, and then examine longitudinal changes in the shape transformations. This approach is valid in theory, but limited in practice. This is because the independent atlas warping for each longitudinal scan typically leads to jittery longitudinal measurements, particularly for small structures such as the hippocampus of the brain, due to inconsistent atlas warping across different scans in a series [75]. Although smoothened estimates of longitudinal changes can be obtained by smoothing or regressing over the measurements along the temporal dimension, post hoc smoothed measurements will, in general, deviate significantly from the actual image data, unless smoothing is performed concurrently with atlas warping and by taking into account the image features. It is worth noting that the issue of longitudinal measurement robustness is particularly important in measuring the progression of a normal older adult into mild cognitive impairment, which makes it possible to have the ability to detect subtle morphological changes well before severe cognitive decline appears.
In order to achieve longitudinally stable measurements, we have developed 4-dimensional image analysis techniques, such as a 4D extension of HAMMER [75]. In this approach [75], all serial scans are jointly considered as a single 4D scan, and the optimal 4D deformation is determined, thus avoid inconsistent atlas warping across different serial scans. The 4D warping approach of [75] simultaneously establishes longitudinal correspondences in the individual as well as correspondences between the template and the individual. This is different from the 3D warping methods, which aim at establishing only the inter-subject correspondences between the template and the individual in a single time-point. Specifically, 4D-HAMMER uses a fully automatic 4-dimensional atlas matching method that constrains the smoothness in both spatial and temporal domains during the hierarchical atlas matching procedure, thereby producing smooth and accurate estimations of structural changes over time. Most importantly, morphological features and matches guiding this deformation process are determined via 4D image analysis, which significantly reduces noise and improves robustness in detecting anatomical correspondence. Put simply, image features that are consistently recognized in all time-points guide the warping procedure, whereas spurious features (such as noisy edges) that appear inconsistently at different time-points are eliminated. We have validated this approach against manually-defined brain ROI volumes by very well trained experts on serial scans [75], and we determined that it produces not only smoother and more stable measurements of longitudinal atrophy, but also significantly more accurate measurements, as demonstrated in [75].
Evaluation: The plethora of automated methods for deformable image registration has necessitated the evaluation of their relative merits. To this end, evaluation criteria and metrics using large image populations have been proposed by using richly annotated image databases, computer simulated data, and increasing the number and types of evaluation criteria [13]. However, the traditional deformable simulation methods, such as the use of analytic deformation fields or the displacement of landmarks followed by some form of interpolation [6], are often unable to construct rich (complex) and/or realistic deformations of anatomical organs. To deal with this limitation, several methods have been developed to automatically simulate realistic inter-individual, intra-individual, and longitudinal deformations, for validation of atlas-based segmentation, registration, and longitudinal measurement algorithms [10, 96].
The inter-individual deformations can be simulated by a statistical approach, from the high-deformation fields of a number of examples (training samples). In [96], Wavelet-Packet Transform (WPT) of the training deformations and their Jacobians, in conjunction with a Markov Random Field (MRF) spatial regularization, were used to capture both coarse and fine characteristics of the training deformations in a statistical fashion. Simulated deformations can then be constructed by randomly sampling the resultant statistical distribution in an unconstrained or a landmark-constrained fashion. In particular, the training sample deformations could be generated by first extensively labeling and landmarking a number of images [5], and then applying a high-dimensional warping algorithm constrained by these manual labels and landmarks. Such adequately constrained warping algorithms are likely to generate deformations that are close to a gold standard, and therefore appropriate for training.
The intra-individual brain deformations can be generated to reflect the structural changes of an individual brain at different time points, i.e., tissue atrophy/growth of a selected structure or within a selected region of a brain. In particular, the method proposed in [51] can be used to simulate the atrophy and growth, i.e., generating a deformation field by minimizing the difference between its Jacobian determinants and the desired ones, subject to some smoothness constraints on the deformation field. The desired Jacobian determinants describe the desired volumetric changes of different tissues or different regions. Moreover, by using the labeled mesh and the FEM solver [10], the realistic longitudinal atrophy in brain structures can be also generated, to mimic the patterns of change obtained from a cohort of 19 real controls and 27 probable Alzheimer’s disease patients.
3 Multi-parametric statistics and group analysis
Section 2 describes the process of spatial normalization, which brings images in the same coordinate frame. These can now be incorporated into a statistical atlas for group analysis as will be discussed next.
One of the most common applications of statistical atlases is to be able to compare two groups. These groups could be groups of patients with a specific disease and a group of healthy controls, or groups of subjects divided on the basis of age, gender or some other physical characteristic. Prior to performing any group-analysis, the images of the subjects to be used are spatially normalized to a subject chosen to be the template. The method adopted for spatial normalization and group-based analysis depends completely on the type of data (scalar or high-dimensional) used for representing the subjects.
3.1 Statistical analysis of scalar maps
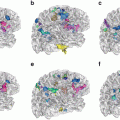
Traditionally, in the standard framework of voxel- and deformation-based analysis, scalar images, such as tissue density maps [2, 25] or Jacobian determinants [17, 29] are used for group analysis. In diffusion tensor images (DTI), one of the several scalar maps of fractional anisotropy or diffusivity [4] may be used to represent each of the subjects. These scalar maps of choice for representing the subjects are then smoothed by a Gaussian filter to: 1) Gaussianize the data, so that linear statistics are more applicable; 2) smooth out the noise; or 3) analyze the image context around each voxel, since structural changes are unlikely to be localized at a single voxel, but are rather more likely to encompass entire regions. Voxel-wise statistical tests, such as the general linear model, are then applied to the spatially normalized and smoothed data. The output is a voxel-wise map which identifies regions of significant difference based on some user-defined threshold. Statistical Parametric Mapping or SPM [40] has been a tool widely used for this purpose. Fig. 5 shows an example of voxel-based statistical analysis performed on a group of patients with schizophrenia versus a group of healthy controls, using MRI data. Similar analysis has been performed on anisotropy and diffusivity maps computed from DTI data [54, 55]. These regions can be further analyzed with respect to the clinical correlates, to determine the biological underpinnings of the group-changes.
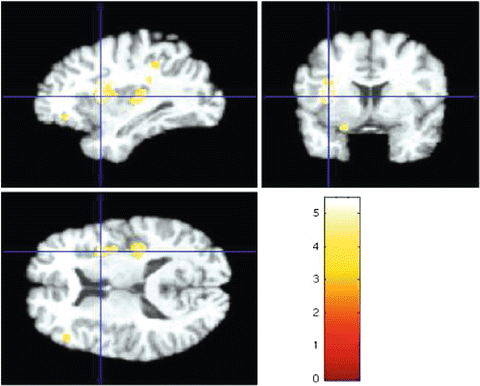
Fig. 5
Regions of difference between schizophrenia patients and healthy controls using voxel-wise application of linear statistics
In addition to the application of voxel-wise statistical tests, analysis can also be performed on a region wise basis, using regions that have been defined on a template or average atlas of subjects that has been created using the process of spatial normalization. By the process of spatial normalization, each of these regions can be warped to each of the subjects (or vice versa) and group-based analysis may be performed using region-based values of scalar quantities that characterize the effect of pathology on these regions. For example, tissue atrophy during the course of aging or as a manifestation of disease could be evaluated percentage-wise in each of the regions that have been outlined in the atlas of ROIs.
3.2 Statistical analysis of multi-parametric and multi-modal data
While the general linear model (GLM) has been used effectively for the statistical analysis of the scalar map representation of the subjects, with the increasing use of multi-parametric or multi-modality images, GLM with Gaussian smoothing does not suffice for several reasons. The simple spatial filtering and subsequent linear statistics are not a valid approach for the multi-parametric data such as tensors and multi-modality data as the high-dimensional, non-linear data at each voxel are typically distributed along sub-manifolds of the embedding space. In tensors, this embedding space could be in R6, if single voxel data is to be considered. In multi-modality data, the dimension of the embedding space will be the number of modalities combined to represent the data. Fig. 6 demonstrates this concept, for the case of tensors, but instead of ellipses, any high-dimensional structure could be used to emulate the voxel-wise structure of multi-modality data. The filtering and the subsequent statistics need to be performed on this underlying manifold. In addition, to the underlying structure of the data, another reason for the lack of feasibility of the GLM for this data is that the shape and size of a region of interest, such as a region of growth or abnormal morphological characteristics, is not known in advance; the way in which a disease process is likely to affect the local tissue structure of the brain is highly unlikely to follow a Gaussian spatial profile of a certain pre-defined size. Thus the two main challenges that we need to address in order to form statistical atlases of this higher dimensional data and follow it with group analysis are: 1) determining the true underlying structure of the data in the form of a non-linear manifold and 2) estimating the statistical distribution of the data on that manifold.
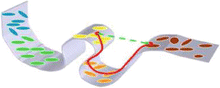
Fig. 6
 Patient-Specific Physical and Physiological Computational Models from Medical Images
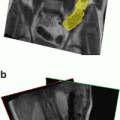 Image Processing for Analysis of Colon Motility
 of Topological Constraints in Medical Image Segmentation
 registration using mutual information
 and inter subject analyses of brain functional Magnetic Resonance Images (fMRI)
 Methods in Medical Imaging


Manifold structure of tensors. The gray surface represents the non-linear manifold fitted through the tensors or any high dimensional structure represented as ellipses. The green line represents the Euclidean distance between tensors treated as elements of R 6 and the red line represents the geodesic distance along the manifold that will be used for all tensor manipulations
Related posts:
Image Processing for Analysis of Colon Motility
registration using mutual information
and inter subject analyses of brain functional Magnetic Resonance Images (fMRI)
Methods in Medical Imaging
Stay updated, free articles. Join our Telegram channel
Full access? Get Clinical Tree
