Fig. 13.1
The figure shows the structure of three-compartment model to quantitatively assess the transportation rate constants related to FDG metabolism, where Cp, C1, and C2 are the compartments for plasma, free, and metabolized tracer, respectively. CPET represents what the scanner measures in a voxel or in a region of interest (ROI). The rate constants K1–k4 regulate the tracer transportation through the different compartments which could be a transfer from chemical species to another or from physical space to another physical space. Note that K1 is the perfusion and has units in ml/g/min, while k2–k4 have units in 1/min. The measured PET signal is contaminated by a fraction of tracer concentration in plasma, and this question is addressed by including a portion of the input function in the kinetic model equation (Adapted from Bentourkia [7])
In PET cardiac imaging, determination of myocardial blood flow and flow reserve can be measured using dynamic scanning of the heart region using some radiotracers such as O15-water, ammonia (N13), Rubidium-82 (Rb82), and other tracers that exhibit blood flow characteristics. Quantitation of myocardial blood flow using dynamic PET is reviewed in Chap. 19.
In neurology, dynamic PET has been a very useful tool in determination of important physiologic measures that reflect tracer receptor density, distribution volume, drug occupancy, and very instrumental tool in drug development [22]. In oncology, pharmacokinetic modeling provides valuable opportunities for measurements of receptor density of potential therapeutic targeting, determination of tumor blood flow, as well as measuring the efficacy of anticancer drugs [23].
Dynamic PET imaging-derived kinetic parameters, particularly transport (flow) and overall metabolic rate, have provided imaging endpoints for clinical trials at single-center institutions for years. However, dynamic imaging poses many challenges for multicenter clinical trial implementations from cross-center calibration to the inadequacy of a common informatics infrastructure [21]. Figure 13.2 illustrates the imaging workflow of static and dynamic PET image acquisition and data analysis. One recent study revealed that the influx rate constant Ki determined by Patlak graphical method in simulation and patient data has better contrast-to-noise ratio (a measure related to more reliable tumor detection), and this has remarkable advantage in lesions of high uptake surrounded by elevated but constant background levels such as liver lesions. Meanwhile, SUV performance was relatively poor [24]. Another study have used different methods for quantification of tumor activity (in a group of 40 patients with colon cancer metastatic to the liver) including SUV, Patlak graphical analysis, simplified kinetic model, and metabolic rate of glycolysis (MRGlu). Overall, Patlak was the best predictor of outcome and best discriminator between normal tissue and tumor results [25].

Fig. 13.2
Dynamic PET is used to determine valuable metabolic and functional parameters. The standard protocol relies on delineating regions of interest (ROIs) on a summed PET image reconstructed using the system model or a co-registered anatomical image. Time-activity curves (TACs) from the ROIs with collected information about tracer concentration in plasma (i.e., input unction, IF) are used in the kinetic model to derive the physiologic tracer parameters. The other way around is to calculate rate parameters directly from sinogram data with less noisy estimates (Modified from Muzi et al. [21])
Several attempts have been devised to correlate the kinetically derived tracer influx rate constant Ki to SUV measurements by either making strong assumptions that could be violated in practice or still function of the imaging time point [26, 27]. The measuring time point is very crucial in estimating the metabolic activity, and wide variation could be found in different malignancies and in individual patients; therefore, quantitative image interpretation should be cautiously undertaken. Benign and inflammatory lesion uptake time could be within 30–60 min, while malignant tissues exhibit wide variation across patients that may reach plateau after 4 h [28]. Thus, recommendations are often taken to be within 50–70 min and not much longer to minimize the effect of tracer decay [29–31].
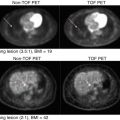
For example, dynamic F18-FDG PET imaging was found to accurately differentiate malignant from benign pulmonary lesions in patients with suspected malignant pulmonary lesions. SUV and visual assessment were outperformed by dynamic imaging data analysis in differentiating benign and malignant lesions [32]. However, whole-body dynamic PET imaging is not feasible at the moment due to limited axial field of view of most commercial PET scanners.
In a recent work, researchers proposed a new solution where dynamic whole-body imaging can be made feasible using the current PET/CT generation systems [24, 33]. It consists of a 6 min initial scan over the heart to extract the input function through image-based method to get rid of the cumbersome work associated with arterial catheterization. This action is followed by six passes of dynamic whole-body scanning including subsequent passes over the heart. Standard Patlak linear graphical analysis modeling is then applied at the voxel level to derive parametric images of Ki that reflects net tracer uptake [33]. The method looks interesting and combines between feasibility and advantages of dynamic quantitative features, but further work is needed to explore its potential in routine practice of patient diagnosis and therapeutic applications.
In Fig. 13.3 and in the SUV image, the patient was scanned with arms in the up position, according to the conventional whole-body PET protocol recommendations to limit the attenuation from the arms. However, for the whole-body dynamic protocol, the patient had to be scanned for approximately 45 min with arms down due to the lengthy period of the scan. It was observed that the additional attenuation that may be caused because of that position does not affect the quality of the data [24].
Fig. 13.3
Patlak analysis using six sequential whole-body PET scans. The last six whole-body dynamic frames are shown on the left side. On the right side: the SUV image, the K i parametric image derived from all six last frames, and the K i image after omitting the last two frames (Reprinted with permission from Karakatsanis et al. [24] and thanks to Dr Nicolas Karakatsanis for providing some clarification on the figure)
13.2.4 Static Versus Dynamic PET
As described, the net FDG influx rate constant Ki (mL blood/mL tissue/min) is a valuable quantitative measure that reflects the hexokinase and enzymatic capacity of the tumor cells. This measure was found to correlate with SUV measurements taking two conditions into account as outlined by Kotasidis et al. [26]:
- 1.
The time integral of plasma FDG concentration is proportional to the injected dose divided by body weight (BW), lean body mass (LBM), or body surface area (BSA) as defined in the SUV formula. However, this assumption is not always valid due to, for example, treatment intervention that might interfere or influence dynamics of FDG in plasma, and a simple correlation with injected dose and BW, BSA, or LBM would not be effective.
- 2.
Non-phosphorylated FDG that includes vascular and extravascular FDG should be negligible when compared to the phosphorylated FDG. This assumption can also be violated in FDG non-avid tumors where the vascular concentration and/or intracellular non-phosphorylated FDG are increased and the standard imaging time wouldn’t be appropriate. In post-therapy conditions, there is also a chance to find an elevated background activity that impacts the SUV uptake profile taken over time [26].
From the above described points, one should be very careful in using the SUV in assessing response to treatment or using the SUV as a surrogate biomarker in clinical trials. The assumption that SUV is correlated with the metabolic rate of glycolysis (MRglu) and thus can be used as surrogate biomarker specially in clinical trials requires validation studies as some new drugs modify the FDG differential uptake due to, for example, increased inflammatory processes in other areas away from the tumor site(s) [27]. In some situations, it has been reported that up to 40 % of FDG uptake occurs in non-tumor tissue in post-therapeutic evaluation [34].
Dual or multiple time point SUV measurement is an intermediate approach between static-based acquisitions and dynamic imaging. It considers the tumor uptake in timely spaced points instead of recording tumor uptake over a certain acquisition period while static because it doesn’t look at tracer kinetics during data acquisition. It provides a good means for characterizing a given pathology whether inflammatory (or benign lesion) versus malignant lesions as the former generally shows a pattern of constant or tracer washout, while the malignant tissue often has a persistent or even accumulating uptake pattern (see Fig. 13.4).

Fig. 13.4
General pattern of F18-FDG uptake in inflammatory and malignant lesions. Inflammatory cells exhibit a sort of transient retention and tracer washout, while cancer cells show a continuous tracer uptake over time (From Hess et al. [13] with permission from Springer Science + Business Media)
Dual time point can serve to improve test sensitivity by improving lesion contrast and test specificity by excluding patients with abnormal or suspected findings. Its utility has been demonstrated in a number of malignancies including bone, head and neck, lung, breast, and colorectal cancers and infection or inflammatory disorders [35–38]. However, further efforts need to be exercised along with elaborate guidelines emphasizing the specifics of dual or multiple time points in routine clinical practice [39].
13.3 Standardized Uptake Value (SUV)
SUV is the most commonly used quantitative index in clinical PET imaging. SUV formula is very simple and this form is widely acceptable.
 Activity concentration is a quantity derived from a region of interest or voxel taken at a certain single region where the metabolic activity is of considerable clinical value. It can be kBq/ml or μCi/ml or any other equivalent unit.
Normalized injected activity is the administered PET tracer (i.e., injected dose) normalized to patient body weight (BW), body surface area (BSA), or lean body mass (LBM), and decay corrected to the PET acquisition start time. Note that the injected activity (e.g., MBq or mCi) should have the same unit like the one measured from the image 2D ROI, voxel or volume of interest (VOI).
Advantages of SUV are more than onefold. It is easy to calculate, available, and implemented as a built-in tool in viewing or processing workstations of all modern PET/CT scanners. It doesn’t also require arterial blood sampling like other methods that rely on dynamic imaging and kinetic modeling as outlined earlier. It can principally be calculated at any single time point after tracer administration. There are several approaches devised to look for what is the most appropriate or representative voxel or group of voxels that accurately and reliably express metabolic activity within a given pathology. Therefore, there are a number of SUV variants that have been proposed in practice and will be discussed later.
Lesion contouring methods are also broad and range from very simple manual delineation to very sophisticated high-order automatic lesion segmentation. There are, however, some variables that need to be highlighted when attempts are made to work on PET data such as image noise, spatial resolution, image filtering, voxel size, degree of heterogeneity in the tumor, and uptake gradient within and outside the tumor relative to the background level [40]. Methods that can model or account for these variables while able to provide accurate and reproducible lesion segmentation can be the most preferable one for clinical adoption and standardization.
Substantial efforts have been carried out to address the problem of manual delineation that is prone to inter-subject and intra-subject variability. Several methods were developed for lesion segmentation task with different statistical or mathematical principles that may include thresholding; edge detection; watersheds; region growing; classifiers; clustering; gradient-based, fuzzy C-means or fuzzy locally adaptive Bayesian, Markov random field models; artificial neutral networks; deformable models; atlas-based methods; and others [41, 42]. Some studies were also conducted to address inherent differences and highlight the relative accuracies of those approaches [43]. However, there is no single optimal solution or consensus acceptable for all clinical problems in terms of accuracy, precision, and efficiency. This is particularly important in multicenter oncology studies where uniform delineation methods are required [44].
Investigators recognize that there is a substantial growing interest in applying fully automatic approaches that are clinically more feasible on efficiency and user-input levels [41]. Image segmentation in research could vary significantly based on the intended application and the adopted method together with the textural or morphological appearance of the oncologic lesions. Therefore, producing a benchmark database for validation and comparison of methods will be very beneficial for PET imaging detection tasks and image processing applications [41].
13.3.1 Drawbacks of SUV
Although the SUV has several quantitative and clinical implications, it has some potential drawbacks. It is simply a temporal and spatial oversimplification of the metabolic and biochemical process in question and doesn’t provide a detailed description of tracer kinetics within different tissue compartments [28, 45]. The injected tracer undergoes a number of biochemical interactions that are not accounted for using SUV measurements and through which it may be converted from one chemical species to another or from vascular space to interstitial space or vice versa. Meanwhile, the SUV picks up only the total signal coming from the area of interest where all or some of these processes are taking place [46]. The biodistribution of tracer in a given lesion might include delivery, uptake, retention, and clearance, and these processes can’t be separated by a single SUV metric. It is also impossible to separate the various components that contribute to the total signal such as specific binding, nonspecific binding, and free tracer in tissue [27].
Another quantitative shortcoming of SUV comes when using different radiotracers of tumor uptake that is not significantly different from healthy tissues. This situation stimulated researchers to look for alternative quantitative measures that potentially able to discriminate between pathologic lesion kinetics and other type of non-pathologic processes as demonstrated in 3′-[18 F]fluoro-3′-deoxythymidine (18 F-FLT) PET studies [11, 21].
13.3.2 SUV Variants
Quantitative PET and SUV metric has several levels of measurements based on the complexity of computation and the employed analytical methods [40]. The most commonly used SUV metrics are SUVmean, SUVmax, and SUVpeak. The former is defined using the abovementioned formula for SUV calculations where the numerator is taken as the mean FDG or PET tracer concentration within the region or volume of interest. Measurements of SUVmax consider the maximal pixel concentration within the selected lesion. The SUVmean is operator dependant and underestimates the true value especially in small lesions due to partial volume effect. On the other side, SUVmax is sensitive to noise as it increases positive bias as noise increases and a subject of debate in response to treatment monitoring [47, 48]. It has also some wrong implications and less representation in heterogenous tumor mass as more than SUVmax may exist within the same volume.
One study reported that the variability of SUVmax that can be attributed to image noise accounts for half of the overall variability [47]. They also reported that percentage change in SUVmax < 30 % is still within the uncertainty of repeated measurement, and a positive bias of SUVmax can be as high as 30 % for short acquisition time (high noise level), evaluated as 1 min per bed position [47]. SUVmean is much more variable due to operator-dependent factors including size and shape of mask delineation and location within or around a lesion, as well as the presence of tumor heterogeneity and variable level of background 18 F-FDG activity.
SUVpeak is the average SUV within a small, fixed-size region of interest (ROI peak) centered on a high-uptake part of the tumor. PET Response Criteria in Solid Tumors (PERCISTs) recommend SUVpeak taken for the lean body mass (i.e., SUL) as an index for tumor response [49]. It has several technical definitions as what are the most relevant ROI shape, size, and dimension. The shape can be square or cuboidal of side length of 7–15 mm. In terms of ROI geometries, it can be cylindrical, spherical, or even circular in diameters ranging from 9 to 17 mm [50]. For a given lesion, there might be more than one SUVpeak.
In a recent work, a number of 24 SUVpeak were used to look for the most appropriate variant in quantification of different tumor response using FLT as biomarker. ROI size was the most influential factor in SUVpeak variation when compared to ROI shape or location. In addition and generally, the intra-tumor SUVpeak tended to decrease, but its variation tended to increase as the size of ROIpeak increased [50]. Therefore, the SUVpeak ROI candidate should be optimally chosen based on well-defined specific criterion in favor of accurate assessment of patient response for individual tumor. One report revealed that SUVpeak was the most robust method when using varying reconstruction methods, especially in small lesions when compared to SUVmean and SUVmax [51]. In the same report, the latter two showed an increased variability in small lesions <5 ml, while SUVpeak remained more stable.
A robust and reliable estimate of SUV should be carried out based on standardized protocol and long-term observation on patient outcome. SUV measures are still “surrogate” biomarker and the accurate determinant, and reference gold standard is patient survival-based treatment response strategy [52]. In most cases, a number of lesion samples are taken to be quantified with less interest to cover all lesions and their metabolic volume or global metabolic activity leading to a relative sampling and assessment error based on the particular region selected. Nevertheless, a growing interest is currently being taken toward evaluating patients based on overall disease burden as follows in the next section.
13.4 Total Disease Burden
Total lesion glycolysis (TLG) is another metric that is used in quantifying total tumor burden. It is simply calculated by multiplying the SUVmean by the lesion volume. This is for a single lesion, but when considering the whole-body tumor burden, then the values of all lesions TLG are summed up. Total metabolic tumor volume (TMTV) on the other hand reflects the total volume of all lesions within the whole body. These measures look at the overall or gross metabolic activity of cancer cells and eventually could be a potential measure of disease status and better candidates for monitoring response to treatment in comparison to uptake measures such as SUV and its variants [53–55].
It was first proposed in patients with Alzheimer to assess disease burden in an age-matched comparison along with partial volume correction [56]. The MR segmented brain structures were multiplied with the mean cerebral glycolytic activity, and end results showed that partial volume-corrected metabolic rates per unit weight of the brain were not significantly different in these cohorts, but that total brain metabolism was significantly lower in patients with Alzheimer. In addition, their efficacy and predictive power in correlation with recurrence-free survival or overall survival have then been investigated in the field of oncology. In cardiology, combining the FDG PET data and CT morphologic imaging of the chest covering the aortic region was proposed in calculating the atherosclerotic burden for each segment of the aorta by multiplying SUV with wall volume [57]. The arterial wall volume was calculated with the help of the CT contrast data delineating the inner and outer area of the aortic segment that appeared on each axial CT slice then subtracting to get the net volume.
In small-cell lung cancer, high TMTV and TLG were associated with poor survival outcomes, and both were reported to be significant independent prognostic factor, whereas SVmean and SUVmax were poor measures and showed nonstatistical significance in survival [58]. This was true especially in patients with limited disease rather than extended disease. However, finding a proper and reliable but may be combined prognostic indices could help physicians in taking risk-adapted therapeutic decision and better follow-up treatment strategy. For instance, SUVmax and MTV measured on pretreatment 18F-FDG PET/CT in patients with oropharyngeal squamous cell carcinoma have shown to be independent variables in predicting clinical outcomes such as overall survival and disease-free survival [59].
In the context of head and neck cancer in response to chemoradiotherapy, multivariate analysis showed that high MTV (defined as tumor volume with SUV over 2.5) >25.0 mL and high TLG >144.8 g remained as independent significant predictors of incomplete response compared with low MTV and low TLG, respectively. However, predictive efficacy of pretreatment F18-FDG PET/CT varies with different primary sites and chosen parameters. Local response of laryngohypopharyngeal cancer was highly predictable by PET-/CT-based volume measurements [60].
Abgral et al. showed that the retention index (measured as percentage variation of SUVmax) and MTV measured for a cohort of head and neck squamous cell carcinoma patients using dual-phase (early-delay) technique were independently correlated with recurrence-free survival [61]. Global disease assessment will likely have great importance for improved pretreatment planning, patient selection for clinical trials, patient stratification, prediction of treatment response, and response assessment. Nevertheless, it was pointed out that the use of a whole-body metric involving TLG could be highly dependent on the severity of partial volume effect, and ignoring this pitfall in small lesions can greatly underestimate the total TLG compromising its potential prognostic value. However, this needs to be evaluated more thoroughly on an individual tumor basis [62].
Related posts:

Stay updated, free articles. Join our Telegram channel

Full access? Get Clinical Tree


