Jean Noel Buy1 and Michel Ghossain2
(1)
Service Radiologie, Hopital Hotel-Dieu, Paris, France
(2)
Department of Radiology, Hotel Dieu de France, Beirut, Lebanon
24.1 Introduction
24.2 Classification
24.3 Smooth Muscle Tumors
24.3.1 Leiomyomas
24.3.3 Leiomyosarcoma
24.3.4 Other Smooth Muscle Tumors
24.5.4 Vascular Tumors
24.5.5 Lymphomas
24.6.1 Adenomyosis
24.6.2 Adenomyoma
24.6.3 Adenomyotic Cyst
Abstract
1. At the beginning of the third week, an opacity formed by a thickened linear band of epiblast – the primitive streak – appears caudally in the median plane of the dorsal aspect of the embryonic disc.
24.1 Introduction
24.1.1 Embryologic Definition of Mesenchyme
1.
At the beginning of the third week, an opacity formed by a thickened linear band of epiblast – the primitive streak – appears caudally in the median plane of the dorsal aspect of the embryonic disc.
2.
Shortly after the primitive streak appears, cells leave its deep surface and form mesenchyme, a tissue consisting of loosely arranged cells suspended in a gelatinous matrix. Mesenchymal cells are ameboid and actively phagocytic.
3.
Mesenchyme forms the supporting tissues of the embryo, such as most of the connective tissues of the body and connective tissue framework of glands.
Some mesenchyme forms mesoblast (undifferentiated mesoderm) which forms the intraembryonic or embryonic mesoderm.
This chapter considers neoplasms of the uterus in which there is mesenchymal differentiation:
Either pure such as those derived from smooth muscle and endometrial stroma, or associated with epithelial elements such as adenofibroma and adenosarcoma.
The capacity of neoplasms arising in the uterus to form heterologous mesenchymal elements is a reflection of the potentiality of the uterine primordium, which is formed from an anlage of coelomic lining cells and subjacent mesenchymal cells (see Chap. 1).
Within the mesodermal primordium that is to become the uterus, the mesodermal components distinction between duct epithelium and mesenchyme is lost. The Müllerian duct epithelial cells seem to form part of the mesenchyme accompanying the duct before the formation of the uterus. A distinction between the precursors of the endometrium and myometrium is not possible. Neoplasms that subsequently arise in the uterus may express bipotentiality of their ancestry by forming a mixture of epithelial and mesodermal components.
24.2 Classification
Classification of mesenchymal tumors and diseases are presented in Table 24.1.
Table 24.1
Classification of mesenchymal tumors and diseases
1.Smooth muscle tumors |
1.1 Leiomyomas |
General features |
Specific subtypes of leiomyomas |
–Mitotically active leiomyoma |
–Cellular leiomyoma |
–Hemorrhagic cellular leiomyoma |
–Epithelioid leiomyoma |
–Myxoid leiomyoma |
–Vascular leiomyoma |
–Lipoleiomyoma |
Leiomyoma versus leiomyosarcoma |
1.2 Smooth muscle tumors of uncertain malignant potential |
1.3 Leiomyosarcoma |
–Usual leiomyosarcoma, epithelioid leiomyosarcoma, myxoid leiomyosarcoma |
1.4 Other smooth muscle tumors |
–Diffuse leiomyomatosis |
–Intravenous leiomyomatosis |
–Metastasizing leiomyoma |
–Disseminated peritoneal leiomyomatosis |
–Parasitic leiomyoma |
2.Endometrial stromal tumors |
–Endometrial stromal sarcoma |
–Endometrial stromal nodule |
3.Miscellaneous mesenchymal tumors |
–Homologous and heterologous sarcomas |
–Primitive neuroectodermal tumors (PNET) |
–Vascular tumors |
–Lymphoma |
4.Adenomyosis, adenomyoma, and adenomyotic cyst |
24.3 Smooth Muscle Tumors
24.3.1 Leiomyomas
24.3.1.1 General Features
Clinical Findings
1.
Most leiomyomas are detected in middle-aged women.
They are uncommon in women less than 30 years of age except in black women.
2.
Their growth is affected by their hormonal milieu [1] because they contain estrogen and progesterone receptors. They may increase in size during estrogen therapy, and most decrease in size with GnRH agonist.
Progestins, progesterone, hormonal replacement therapy, and pregnancy occasionally are associated with a rapid increase in size of leiomyomas.
Some shrink after menopause.
3.
Clinical findings depend on their location (body or cervix; interstitial/intramural, submucosal, or subserous) and on their size.
Most are asymptomatic but may cause pain, a sensation of pressure, or abnormal uterine bleeding.
Large tumors can produce uterine enlargement or an irregular uterine contour.
Submucosal leiomyomas, even small ones, can cause uterine bleeding due to compression of the overlying endometrium and compromise of its vascular supply.
Subserous leiomyomas can be sessile or pedunculated and can be confused with an adnexal mass. Rarely, pedunculated leiomyoma can undergo torsion.
Pathology
Macroscopy
They are multiple in two-thirds of cases [2].
They are spherical bulges above the surrounding myometrium from which they are easily shelled out.
Intramural leiomyomas are the most frequent.
Submucosal leiomyomas are frequently ulcerated and hemorrhagic.
Subserous leiomyomas can be sessile or pedunculated.
Microscopy
Leiomyomas are composed of whorled, anastomosing fascicles of uniform smooth muscle cells. Most are more cellular than the surrounding myometrium.
Degenerative changes are frequent:
Hyaline fibrosis in more than 60%, particularly in postmenopausal women.
Edema in 50% of cases.
Hemorrhage in 10% of cases; zonal and sharply demarcated.
Cystic in 4% of cases.
Calcification in 4% of cases.
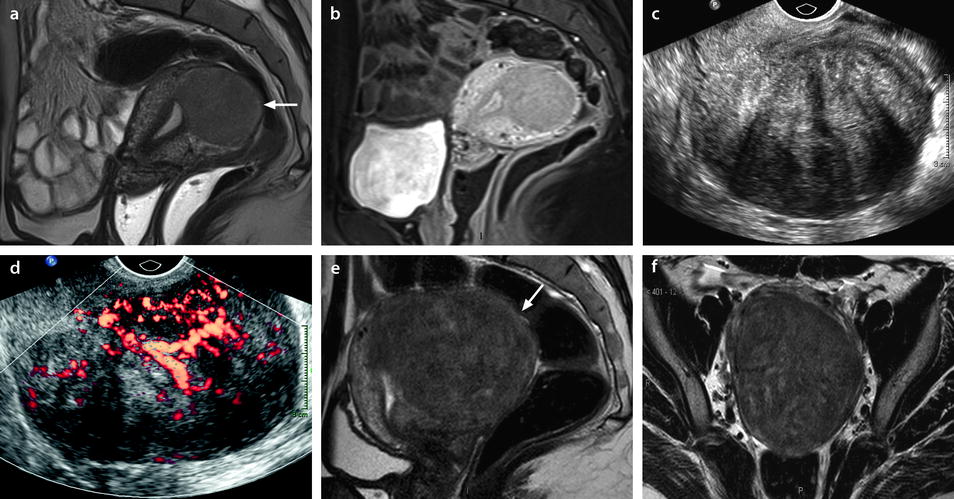
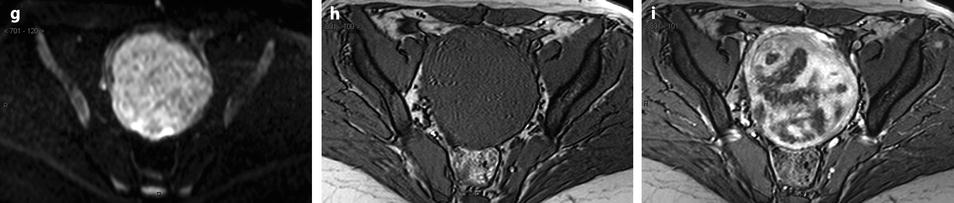
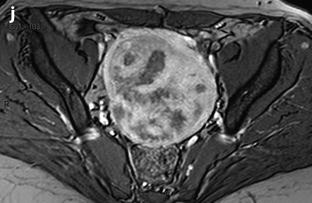
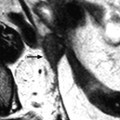
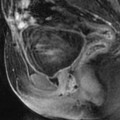
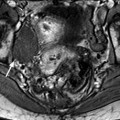
Most of the leiomyomas are developed in the uterus body. Uncommonly there are leiomyomas of the cervix. Exceptionally, submucosal leiomyomas can extend into the cervix and even protrude into the external cervical os (Fig. 24.1).
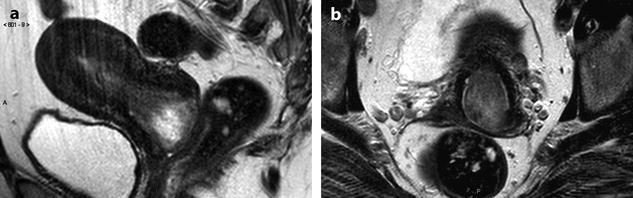
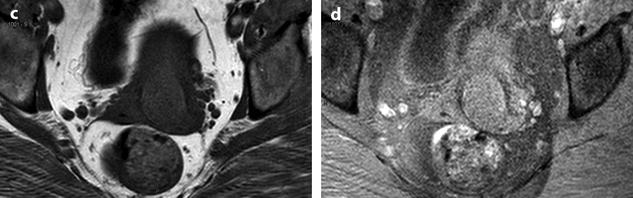
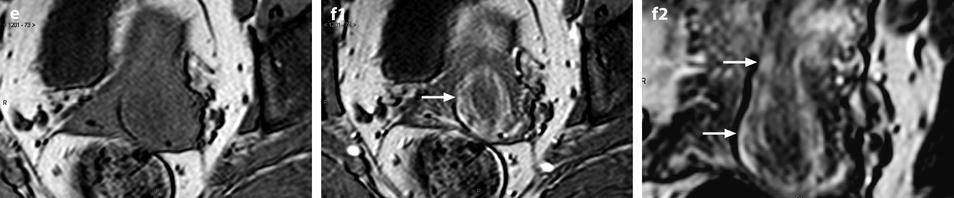
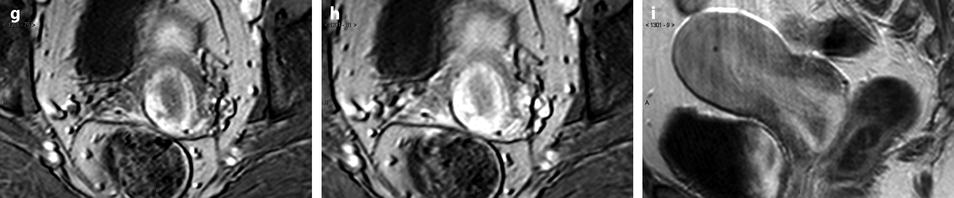
Fig. 24.1
Submucosal leiomyoma of the uterine body protruding into the cervix until the external cervical os. Fifty-year-old woman with metrorrhagias. (a, b) MR sagittal (a) and axial T2 (b) display an endometrial mass with regular contour extending into the internal cervical os and protruding through the external cervical os. The mass is of intermediate signal in its upper two-thirds, while the lower portion is of high signal. (c, d) Axial T1 (c) and fat suppression (d) do not demonstrate any hemorrhage in the mass. (e–i) DMR without injection (e) and at the arterial phase without (f1) and with MIP reconstruction in the coronal plan of the uterus (f2) demonstrates peripheral arterial vessels (arrows) typical for a submucosal leiomyoma, different from the central arterial vascularization of a polyp. At the venous phase (g) and on the delayed (h), an intense contrast uptake in the peripheral portion characteristic for a leiomyoma is displayed. (i) On sagittal T1 after injection, insertion of the leiomyoma on the posterior wall of the endometrial cavity is depicted. Diagnosis at hysteroscopy: polyp inserted on the left lateral portion of the endometrium. Pathology after resection: submucosal endometrial leiomyoma covered with normal endometrium
Ultrasound
Leiomyoma Without Degenerative Changes
On 2D ultrasound, they are well-circumscribed echogenic masses usually with an echogenicity lower than normal myometrium. They often show acoustic shadowing arising within the substance of the leiomyoma (different from shadowing due to calcification). Pathologic correlation showed that these shadows probably originate from interfaces between the margins of smooth muscle whorls and the margins of fibrous connective tissue, and the edges of whorls and bundles of smooth muscle [3]. Sensitivity of this finding is higher for transvaginal (87%) than for transabdominal (52%) ultrasound [4]. This finding is not specific of uterine leiomyoma and can also be encountered in other entities especially in masses containing fibrous tissue (Table 24.2) [4].
Table 24.2
Differential diagnosis of acoustic shadowing due to fibrous tissue in leiomyomas
Uterine |
–Adenomyosis |
–Sarcomas |
Ovarian |
–Fibrothecoma |
–Brenner tumor |
–Ovarian metastases |
On color Doppler, regular peripheral vascularization is usually depicted more or less associated with central vascularization.
Leiomyoma with Degenerative Changes
Echogenicity is variable and is usually heterogeneous.
Locations and Differential Diagnosis
It may be useful for surgeons to classify submucosal leiomyomas into three categories [5]:
Polypoid.
<50% contained within myometrium.
>50% contained within myometrium.
3D saline infusion sonohysterography has been suggested to evaluate the proportion of fibroid contained within the endometrial cavity [6]. The main differential diagnosis of leiomyomas according to their location is listed in Table 24.3.
Table 24.3
Differential diagnosis of uterine leiomyomas according to their location
Submucosal |
Benign |
–Polyp |
–Atypical polypoid adenomyoma |
Malignant |
–Endometrial carcinoma |
–Sarcomas |
Interstitial |
–Adenomyoma |
–Sarcoma |
Subserous |
Uterine |
–Subserous adenomyoma |
Ovarian and extra-ovarian masses |
–Ovarian carcinoma |
–Ovarian fibrothecoma |
–Ovarian Brenner tumor |
–Ovarian metastases |
–Leiomyoma of the broad ligament |
CT
The main findings are increase is size and bulging of the uterus. Difference in contrast between the leiomyoma and the myometrium may be difficult to appreciate even after contrast injection except in case of necrobiosis. Calcifications are useful for the diagnosis and are better visualized than on US, and especially better than on MR (Fig. 24.2).
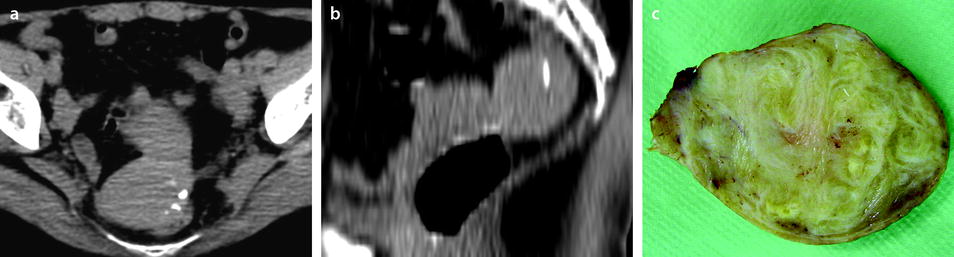
Fig. 24.2
Pedunculated calcified leiomyoma. Pelvic mass in a 75-year-old woman. (a) Axial CT view without IV contrast injection shows a calcified mass posterior to the uterus. (b) Sagittal reformation clearly shows the mass arising from the uterus typical of a subserous leiomyoma. At surgery, a pedunculated calcified leiomyoma was excised. (c) View of the surgical specimen
MR
Morphologic Findings
Leiomyoma Without Degenerative Changes
They usually appear as hypointense on T2 compared to the normal myometrium. They are also hypointense or isointense to normal myometrium on DWI. Their contrast uptake is variable, less, like, or more than myometrium (Fig. 24.3). On DMR, endocavitary myomas enhance more than normal endometrium at almost all phases (Fig. 24.4).
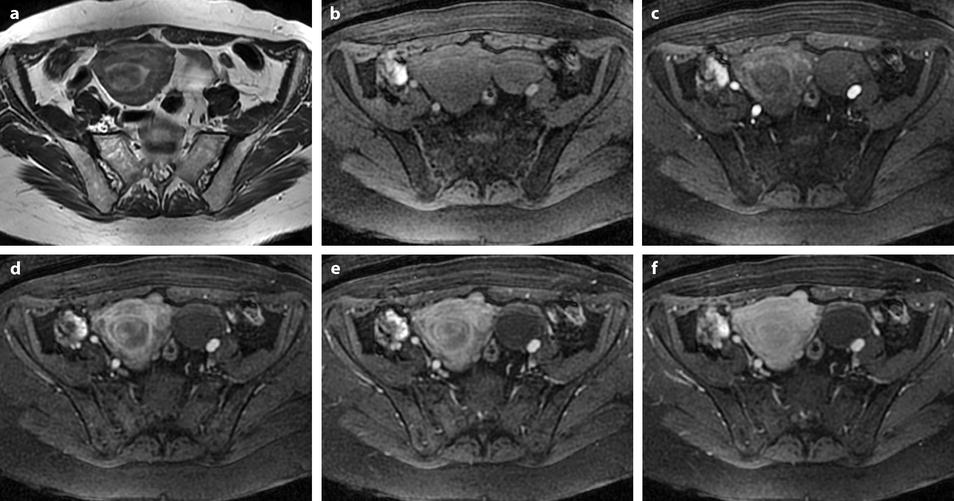
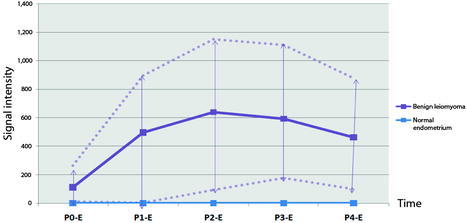
Fig. 24.3
Endocavitary leiomyoma at T2 and DMR. (a) On axial T2W image, an endocavitary lesion, hypointense compared to normal endometrium, with an intensity close to myometrium is seen. (b–f). On DMR before (b) and 25, 75, 125, and 240 s after injection, the lesion shows enhancement superior to that of endometrium and close to that of myometrium. At early phases, the center of the tumor enhances heterogeneously with a peripheral enhancing rim like the inner band of the myometrium
Fig. 24.4
Difference of contrast enhancement between endocavitary myomas and normal endometrium. On DMR, with sequences performed before and 25, 70, 125, and 240 s after injection, contrast enhancement in myomas is superior to that of normal endometrium with no overlap at most phases. Blue line: signal intensity of normal endometrium minus signal intensity of normal endometrium in the same patient (flat curve = 0). Mauve lines: signal intensity of myoma minus signal intensity of normal endometrium in the same patient (mean, minimal and maximal). Materials: 13 patients (author’s personal series). Teaching points. On DMR, endocavitary myomas enhance more than normal endometrium at almost all phases
Leiomyoma with Degenerative Changes
Hyaline Degeneration
High-intensity areas on T2, with enhancement on T1 after contrast injection (Figs. 24.5 and 24.6).
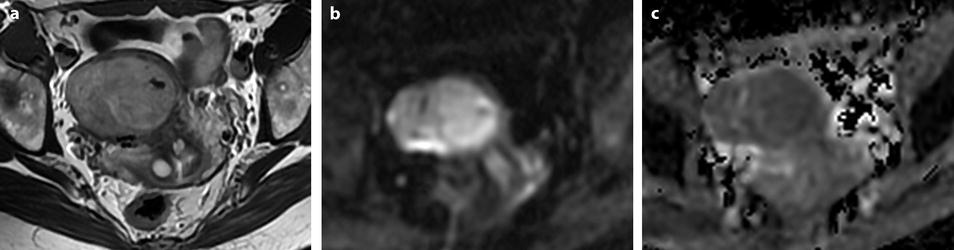
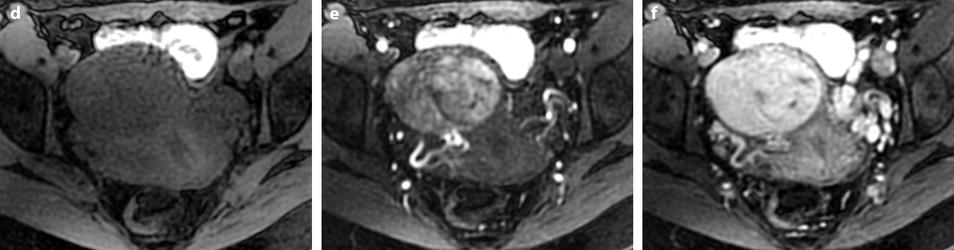
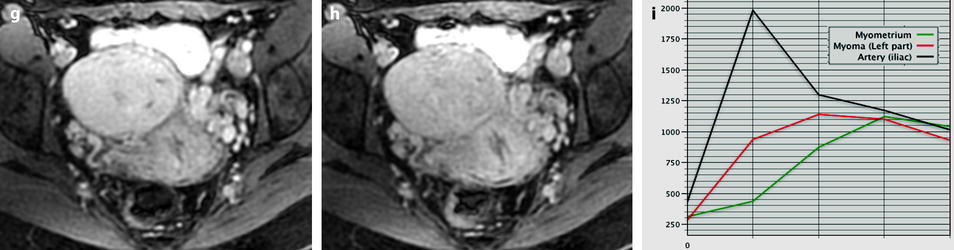
Fig. 24.5
Benign myoma hyperintense on DWI in a 37-year-old woman. (a) Axial T2-weighted image shows a 6.6-cm myoma, hyperintense compared to the normal myometrium, that has increased in size rapidly compared to a previous ultrasound. (b, c) DWI b1000 (b) with corresponding ADC map (c) shows that the myoma is hyperintense on DWI with an ADC of 0.9 × 10⁻³ mm2/s in left part of the tumor and 1.1 × 10⁻³ mm2/s in the right part of the tumor. Fig. 24.5 (continued) (d–i) Dynamic MRI before injection (d) and 25, 70, 125, and 240 s (d–h) after injection with corresponding time-intensity curves (i) shows at the arterial phase areas of rapid contrast uptake in the left part of the leiomyoma superior to that of the myometrium, with equivalent uptake at the late phase. In the right part of the leiomyoma, contrast uptake was close to that of normal myometrium. The association in the left part of the leiomyoma of a higher signal intensity than the myometrium on T2WI, a high signal intensity on DWI, a low ADC value, and a rapid contrast uptake at the arterial phase raised the possibility of a sarcoma or cellular myoma. The patient refused hysterectomy. Transvaginal biopsy in the left part of the tumor showed no malignant tissue. Follow-up was decided
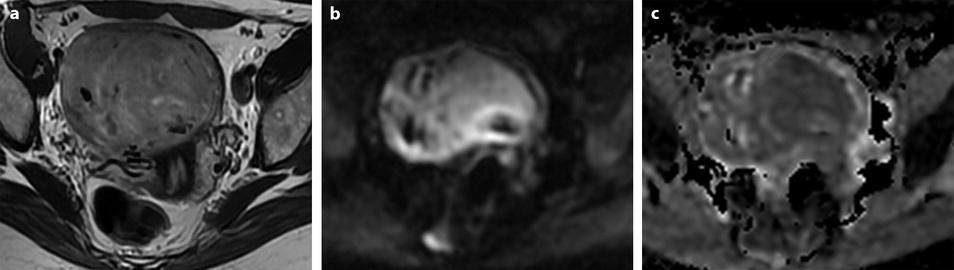
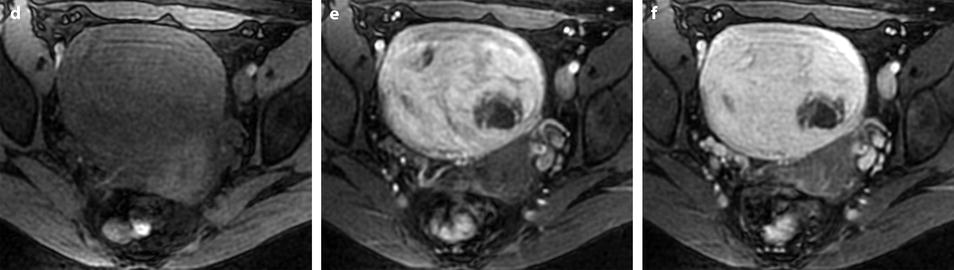
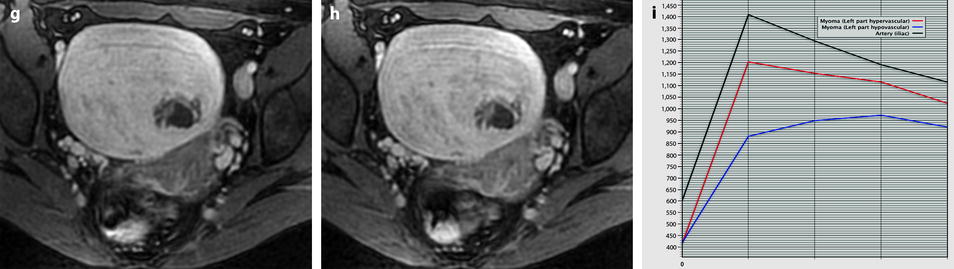
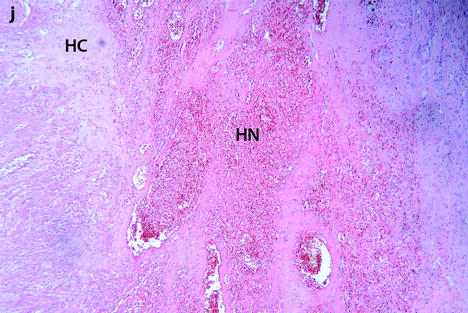
Fig. 24.6
Follow-up of a leiomyoma hyperintense on DWI in a 37-year-old woman (same patient as Fig. 24.5). (a) Axial T2-weighted image shows a 9.5-cm myoma, hyperintense compared to the normal myometrium, that has increased in size since the last MRI, 9 months ago, where it measured 6.6 cm. (b, c) DWI b1000 (b) with corresponding ADC map (c) shows that the myoma is still hyperintense on DWI with ADC values that have increased since the last examination: 1.05 (range 0.8–1.0) instead of 0.9 × 10⁻³ mm2/s in left part of the tumor and 1.5 instead of 1.1 × 10⁻³ mm2/s in the right part of the tumor Fig. 24.6 (continued) (d–i) Dynamic MRI before injection (d) and 25, 70, 125, and 240 s (e–h) after injection with corresponding time-intensity curves (i) still shows rapid contrast uptake at the arterial phase in the left part of the leiomyoma compared to the right part with appearance of areas of necrosis in both parts of the tumor. The patient’s wish was conservative surgery. A repeated transvaginal biopsy showed absence of malignant tissue. Myomectomy was then performed. (j) Histology showed benign leiomyoma with intermixed hyaline changes (HC) and hemorrhagic necrosis (HN)
Edema
Slightly high signal intensity on T2 with enhancement on T1 after contrast injection.
Red Degeneration (Hemorrhagic Necrosis)
May or may not show high signal intensity on T1 (Fig. 24.6); absence of enhancement in the necrotic areas.
It is caused by venous thrombosis. Most of them occur during pregnancy.
Cystic Degeneration
High signal intensity, well-delineated areas on T2 with no enhancement on T1 after injection (Figs. 24.7 and 24.8).
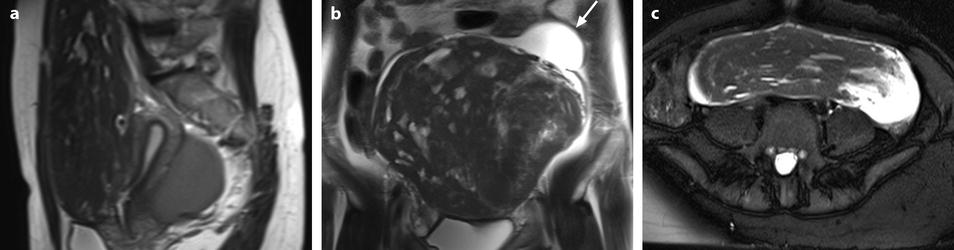
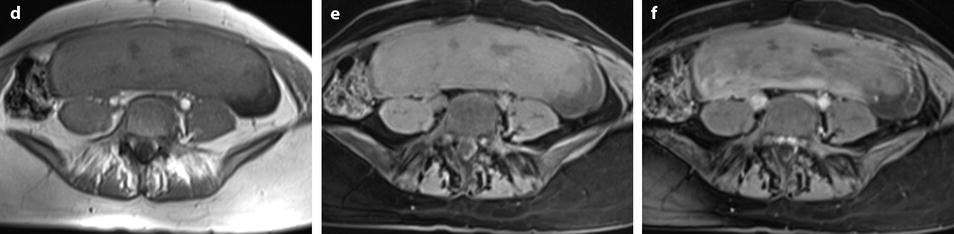
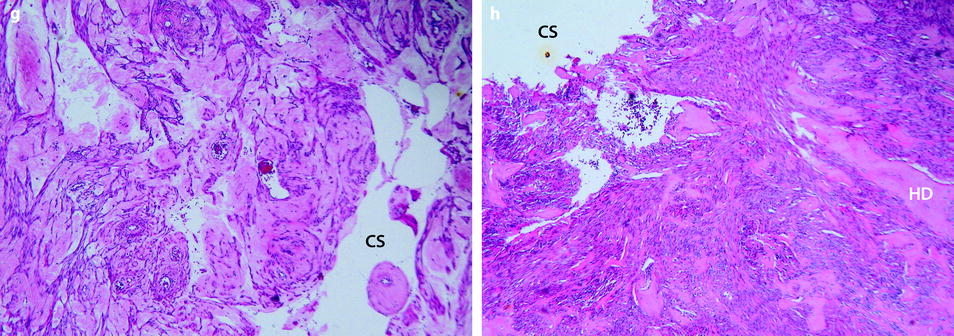
Fig. 24.7
Leiomyoma with cystic degeneration in a 48-year-old woman. (a, b) Sagittal (a) and coronal (b) T2W images show a huge subserous anterior leiomyoma measuring 17 cm in height, 7 cm anteroposteriorly, and 20 cm transversely. The leiomyoma contains small hyperintense cystic spaces surrounded by hypointense solid tissue and large peripheral hyperintense spaces abutting against the uterine serosa especially in its upper left part (arrow in b). A 10-cm mass of intermediate intensity is seen behind the uterus on the sagittal view corresponding to an endometrioma of the left ovary. (c) Axial T2WFS image shows that the cystic spaces are sometimes well delineated and sometimes dissecting the smooth muscle fibers of the leiomyoma. (d–f) Axial T1W image (d) and T1WFS images before (e) and after (f) gadolinium injection show absence of hyperintensity related to hemorrhage and absence of contrast uptake in the cystic spaces. (g, h) Histology of the surgical specimen revealed benign leiomyoma with hyaline degeneration (HD) and cystic spaces (CS) of different size. The cystic spaces were in continuity with the smooth muscle fibers of the leiomyoma and in some locations abutting peripherally against the serosa
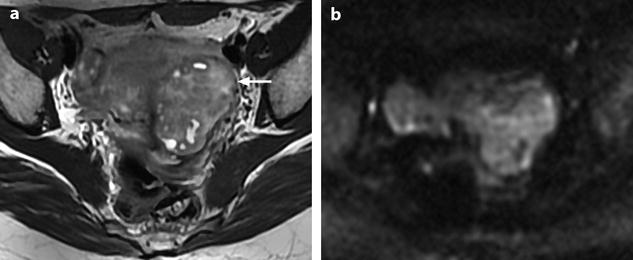
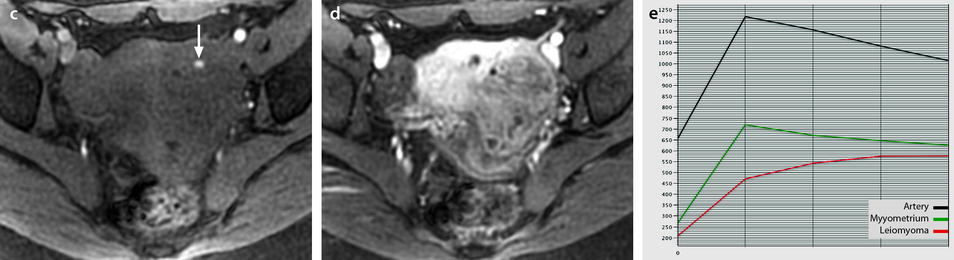
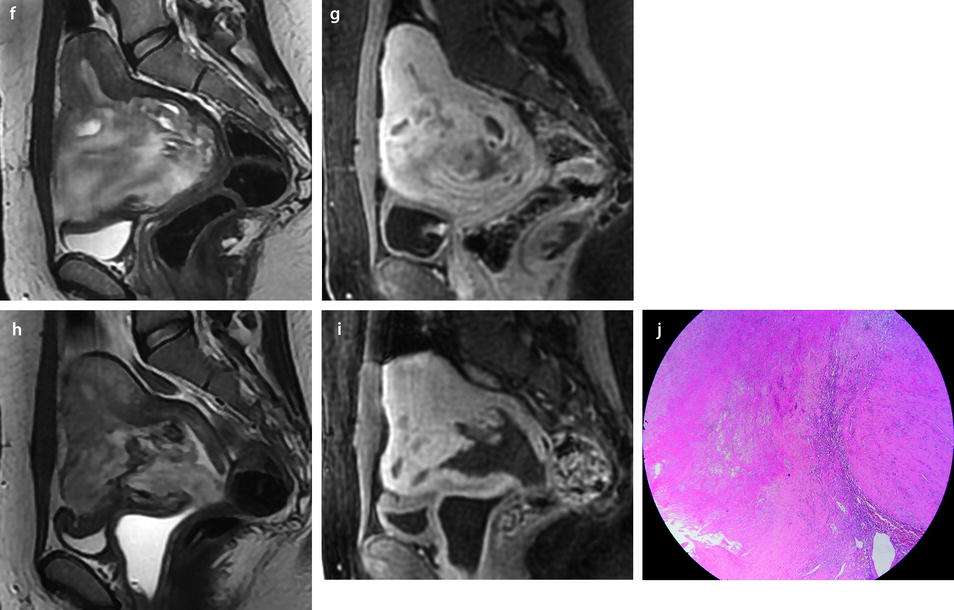
Fig. 24.8
Leiomyoma with cystic degeneration and rapid increase in size. A 31-year-old woman with metrorrhagia. (a) Axial T2W image shows a well-circumscribed mass (arrow) in the left isthmic region containing small cystic areas. The solid part of the mass has an intermediate intensity close to that of peripheral myometrium with a peripheral hypointense rim. Hypointense rims surround also most of the small cavities. Some of these cavities were hyperintense on T1 and T1FS images indicating their hemorrhagic nature. (b) On DWI, the mass is hyperintense with an ADC value of 1.6 in the solid portions (mean values at b500 and b1000). (c–e) DMR at early phase before opacification of the uterus (c), at the venous phase (d), and following phases with corresponding time-intensity curves (e) shows before uterus opacification a spontaneous hyperintense hemorrhagic cystic space (arrow in c) and after opacification a well-circumscribed mass that enhances slightly less than myometrium. (f, g) Fourteen months later, MRI was performed after miscarriage. Sagittal T2W (f) and corresponding (g) T1WFS delayed sequence after injection showed huge increase of the mass which contains some cystic changes. Transvaginal biopsy was performed and concluded to a benign leiomyoma. Patient refused hysterectomy, and embolization was performed in another institution. It was followed by severe metrorrhagia. (h, i) Repeated MRI with sagittal T2W (h) and corresponding (i) T1WFS showed necrosis of the majority of the mass. Laparotomy followed by hysterectomy was performed. (j) Histology showed areas of necrosis and cystic changes
It may be difficult to differentiate them from pockets of necrotic areas, frequently observed within hemorrhagic degeneration and uterine sarcomas [7].
Necrotic areas are usually but not always less well circumscribed.
Calcifications
Calcifications are often missed on MR and visualized at best on CT. They appear as hypointense areas on all sequences. If a subserous leiomyoma is calcified, care must be taken not to confuse it with a bowel loop.
Necrobiosis
The diagnosis is made on absence of contrast enhancement in the tumor except for a peripheral rim (Figs. 24.9 and 24.10). On T1 with and without fat suppression, they are entirely or partly hyperintense. On T2, their intensity is variable being hypointense, hyperintense, or heterogeneous.
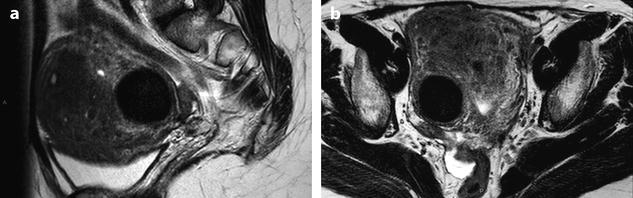
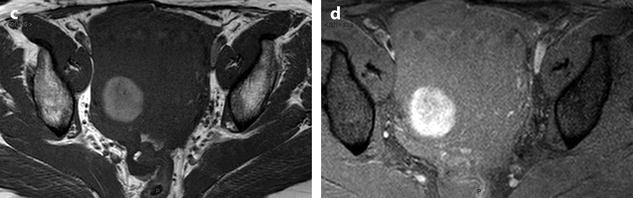
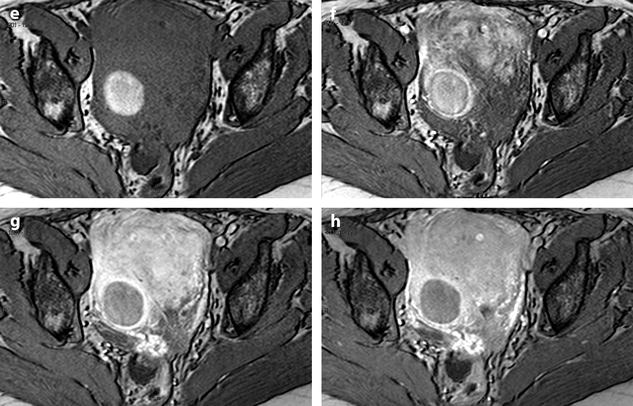
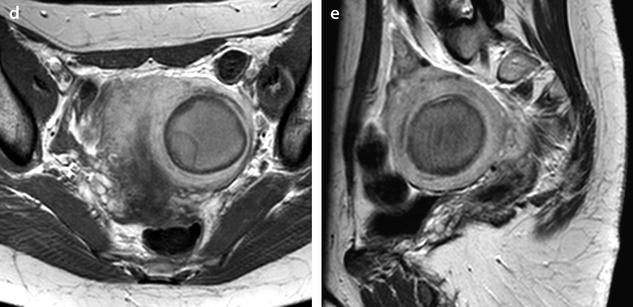
Fig. 24.9
Myoma with hemorrhagic necrosis. (a, b) Sagittal and axial T2W images in a patient with leiomyomatosis, and multiple leiomyomas show a well-delineated, right-located interstitial hypointense leiomyoma. (c, d) Axial T1W images without (c) and with (d) fat suppression show the leiomyoma to be hyperintense related to hemorrhage. (e–h) DMR before injection (e), at the arterial phase (f), at the venous phase (g), and at the late phase (h) shows the wall of the leiomyoma as a peripheral enhancing rim since the arterial phase. Otherwise, no contrast uptake is detected in the hyperintense necrotic and hemorrhagic leiomyoma
Fig. 24.10
Leiomyoma with necrobiosis. A 44-year-old woman with sudden pelvic pain and contractions. (a) Axial T2W image shows a left 5-cm leiomyoma with a central high intensity zone and a hypointense periphery. A pseudoloculation is present in the medial and posterior part of the myoma. (b, c) Axial T1W (b) and T1W-SPIR image (c) shows a central large part of the myoma to be hyperintense related to hemorrhagic necrosis. (d, e) Axial (d) and sagittal (e) T1W images after gadolinium injection show the myoma to be composed of a central hyperintense nonenhancing portion, a peripheral nonenhancing hypointense rim and a thin peripheral enhancing rim best seen on sagittal view. The wall of the pseudoloculation is not enhancing related to necrotic tissue or fibrin
Vascular Findings
Flow Voids
Flow voids appear as hypointense structures at the interface between the leiomyoma and the myometrium. This sign probably corresponds to dilated feeding arteries with fast flow located outside the capsule of the leiomyoma [8].
In Torashima et al.’s series [8], they were seen more commonly on T1 than on T2, exclusively in leiomyomas >3 cm and in 87% of leiomyomas >7 cm, mainly in leiomyomas with degenerative changes and in the pedicle of subserous leiomyomas [8].
In their series, this finding was not observed in focal adenomyosis, ovarian fibromas, thecomas, ovarian cancer, Krukenberg tumors, and in one case of dysgerminoma [8].
DMR
Main findings at DMR are [9]:
At the arterial phase: regular circumscribed vessels at the periphery.
At the venous phase: high contrast uptake (equal to polyp) at the periphery and less in the center, less than sarcoma.
At the late phase: peak enhancement (less than sarcoma) is usually seen at 3 min but may be present earlier even at the arterial phase (Fig. 24.6).
24.3.1.2 Specific Subtypes of Leiomyomas
Mitotically Active Leiomyoma
Definition: A mitotically active leiomyoma is a typical-appearing leiomyoma in a premenopausal woman with five or more mitotic figures per ten high-power fields [10].
Leiomyomas removed during the secretory phase of the menstrual cycle have a significantly increased mitotic index compared to those removed during the proliferative phase.
Leiomyomas removed from women who are taking progestin have a higher mitotic rate than women who are taking estrogen and progestin or who are not taking any exogenous hormone.
Cellular Leiomyoma
Pathology
The cellularity is significantly greater than the surrounding myometrium.
However, it is different from a leiomyosarcoma. Cellular leiomyoma lacks the following features found in leiomyosarcoma: (a) nuclear atypia, (b) high mitotic index, (c) necrosis, (d) myometrial infiltration (common), and (e) vascular invasion (10–22%).
A cellular leiomyoma composed of small cells and scanty cytoplasm can be confused with an endometrial stromal tumor. The large blood vessels are a feature that suggests a smooth muscle tumor. At immunohistochemistry, stromal nodule staining is weak for smooth muscle actin and negative for desmin, while there is a strong cytoplasmic staining for both actin and desmin in highly cellular leiomyoma.
MR Findings [11]
On T2, cellular leiomyomas are usually homogeneous and slightly hyperintense (reflecting high cellularity and relatively less stroma) while degenerated leiomyomas are markedly hyperintense with heterogeneous architecture [11, 12].
However, it is difficult to differentiate between these two types with conventional T2.
On DMR, most cellular leiomyomas show remarkable and homogeneous contrast enhancement in the early dynamic phase (30–90 s after injection) while degenerated leiomyomas usually show irregular, peripheral, or minimal enhancement compared with that of the myometrium [11].
Hemorrhagic Cellular Leiomyoma
Hemorrhagic cellular leiomyomas are found in women who are taking oral contraceptives or are either pregnant or postpartum.
Macroscopy
It has a circumscribed compressive margin.
Multifocal stellate hemorrhages are present.
Microscopy
The leiomyoma is cellular.
It contains area of hemorrhage and edema.
Epithelioid Leiomyoma
Definition: The cells are round or polygonal rather than fusiform. They are arranged in clusters or cords. There are three subtypes:
Leiomyoblastoma (round cells with eosinophilic cytoplasm).
Clear cell leiomyoma.
Plexiform leiomyoma.
Mean age is fifth decade. Most are solitary.
Myxoid Leiomyoma
Definition: A myxoid leiomyoma is characterized by an abundant amorphous myxoid translucent stroma between the smooth muscle cells.
Some of these tumors have a malignant behavior although not presenting the standard criteria for leiomyosarcomas. The diagnosis of myxoid leiomyosarcoma is made on the presence of moderate to marked atypia with or without necrosis and with any mitotic index. The tumor margins are usually infiltrating [13].
Imaging
MR: Variable degrees of high signal intensity on T2 compared to myometrium (Figs. 24.11 and 24.12).
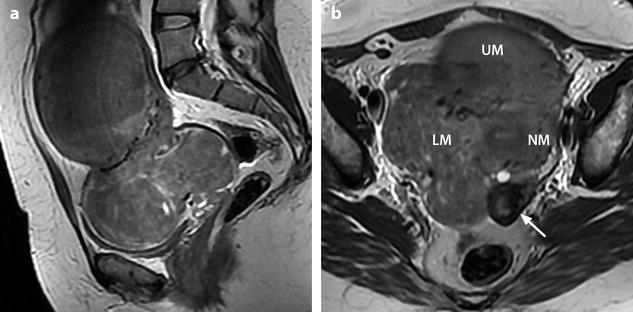
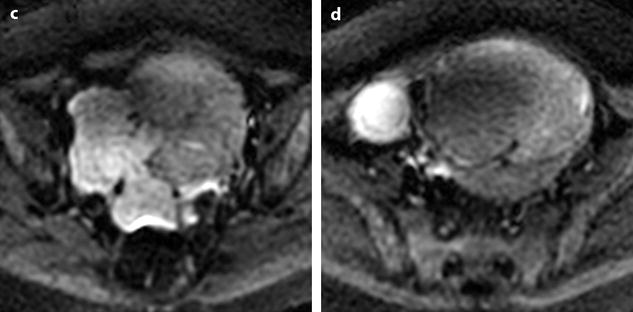
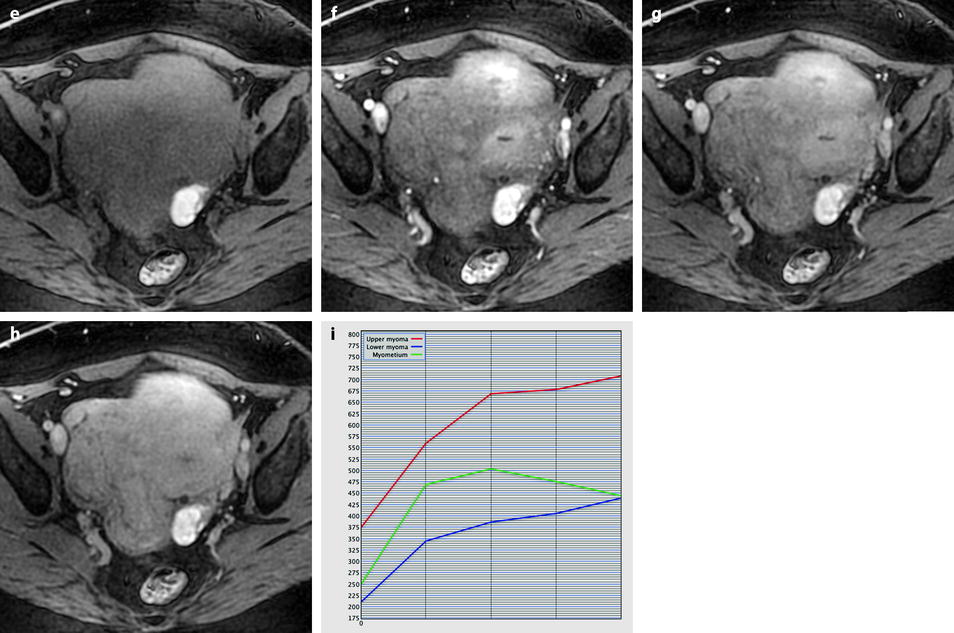
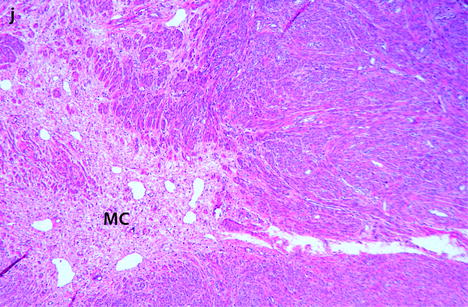
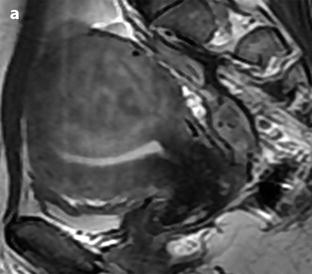
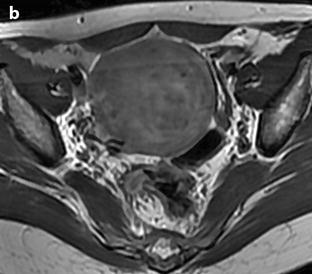
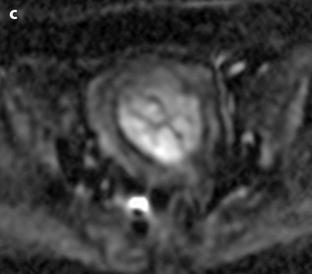
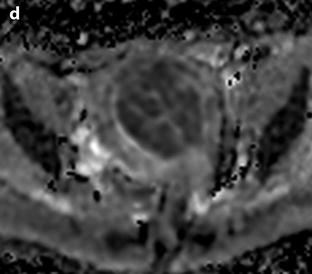
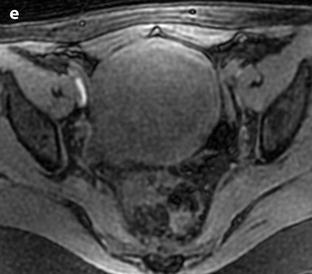
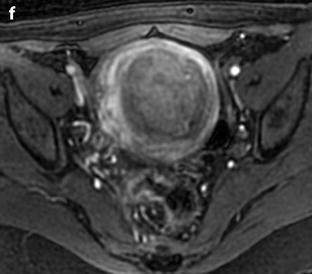
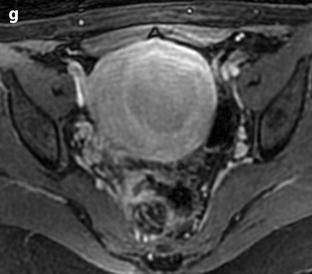
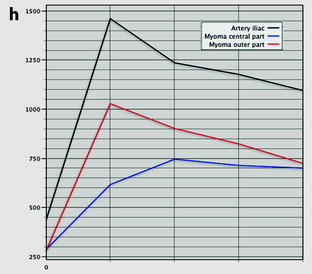
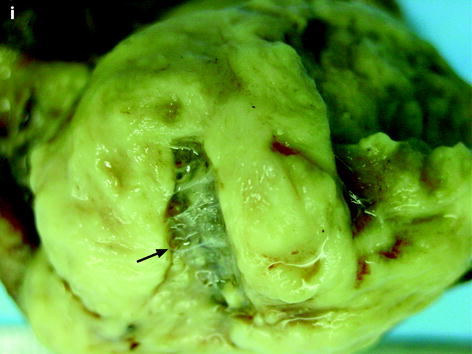
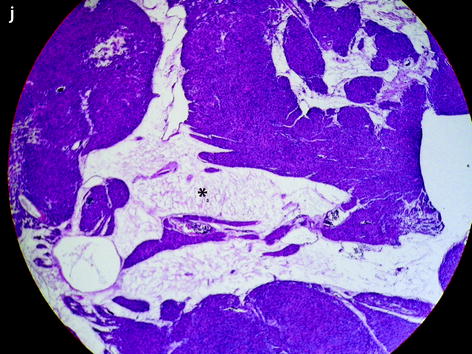
Fig. 24.11
Myxoid leiomyomas with variable ADC values and contrast uptakes. (a) Sagittal T2W image shows a uterus with two large leiomyomas, an upper leiomyoma with a vertical long axis and a bilobulated lower leiomyoma with a horizontal slightly oblique axis. (b) Axial T2W (b) image through the mid-uterus shows the lower leiomyoma (LM) and the bottom part of the upper leiomyoma (UM) surrounding the normal myometrium (NM). The leiomyomas have intensities close to those of normal myometrium with the lower one containing serpiginous hyperintense areas. A left endometrioma hypointense on T2 (arrow) and hyperintense on T1 and T1FS (see DMR without injection) is also displayed. The masses were almost isointense to myometrium on T1. Fig. 24.11 (continued) (c, d) Axial DW images at b500 at the same level as (b) (c) and through the upper leiomyoma (d) show the lower leiomyoma to have higher signal than the upper one. The hyperintense right mass in (d) is a right endometrioma. ADC values (mean of b500 and b1000) were very different: 1.0 × 10⁻³ mm2/s in the lower leiomyoma that is hyperintense on DW image, 1.2 × 10⁻³ mm2/s in the right portion of the upper leiomyoma that is hypointense on DW image, and 1.35 × 10⁻³ mm2/s in the left portion of the upper leiomyoma that is hyperintense on DW image. (e–i) DMR before (e), at the arterial phase (f), at the venous phase (g), and at the parenchymal and late phases (h) with corresponding time-intensity curves (i) shows lower contrast uptake compared to the myometrium in the lower leiomyoma and higher contrast uptake compared to the myometrium in the upper leiomyoma. The serpiginous hyperintense zone on T2W images in the lower leiomyoma enhances lesser than the remaining of the leiomyoma corresponding to myxoid changes at pathology. Fig. 24.11 (continued) (j) Histology showed myxoid changes (MC) in both leiomyomas more prominent in the lower one
Fig. 24.12
Benign leiomyoma with high intensity on DWI in a 49-year-old woman. (a, b) Sagittal T2W image shows a 6-cm posterior myoma slightly more intense than the myometrium. No hyperintensity on T1 (not shown) suggestive of hemorrhage was present. (c, d) DWI b1000 (c) with corresponding ADC map (d) shows that the central part of the myoma is hyperintense on DWI with an ADC of 0.83 × 10⁻³ mm2/s. Fig. 24.12 (continued) (e–h) Dynamic MRI before injection (e) and 25 (f), 70, 125, and 240 (g) seconds after injection with corresponding time-intensity curves (h) shows arterial vessels in the outer part of the leiomyoma at the arterial phase with lower contrast uptake in the central part. (i, j) Hysterectomy was performed, and pathologic examination revealed a leiomyoma with edematous-myxoid changes (arrow in i and asterisk in j) and some hypercellular areas
Vascular Leiomyoma
Definition: It contains numerous large vessels with muscular walls.
Differential diagnosis: Hemangioma, arteriovenous fistula.
Lipoleiomyoma (Fig. 24.13)
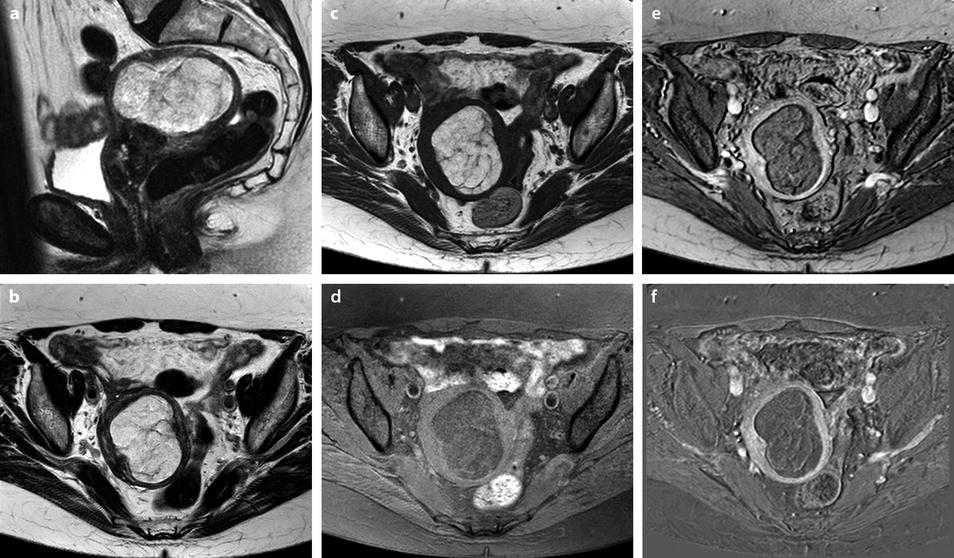
Fig. 24.13
Lipoleiomyoma in a 69-year-old woman. MR sagittal T2 (a) and axial T2 (b) display a submucosal leiomyoma pushing the endometrium to the right. It has overall high signal intensity, containing septa. On axial T1 (c), its signal is identical to adipose tissue and decreases like adipose tissue on fat suppression (d). These findings allow making a specific diagnosis of lipoleiomyoma. DMR after injection (e) and delayed subtraction (f) show small enhancement in the septa without any other significant enhancement ruling out malignancy. Prospective diagnosis: lipoleiomyoma. Pathology confirmed this diagnosis
Definition: A lipoleiomyoma is a leiomyoma that contains a significant amount of fat.
High signal intensity on T1 with low intensity on fat suppression allows distinguishing fat from blood clot within the tumor.
CT is also diagnostic by easily characterizing fat.
24.3.1.3 Leiomyoma Versus Leiomyosarcoma
One of the most difficult challenges of the radiologists is to differentiate atypical leiomyomas from leiomyosarcomas. If leiomyosarcoma is suspected, hysterectomy is indicated because myomectomy will favor peritoneal spread. This causes an important dilemma in young women seeking pregnancy. Here are presented some examples of these situations.
(a)
(b)

Leiomyoma with a rapid increase in size (Fig. 24.14).
Get Clinical Tree app for offline access
Fig. 24.14
Leiomyoma with rapid and important increase in size versus sarcoma. Thirty-five-year-old woman operated one year before from a posterior leiomyoma through coelioscopy. An incomplete resection was performed. At pathologic examination, the leiomyoma was benign. Five months ago, MR sagittal T2 (a) with vaginal and rectal opacification discovers a recurrence of the leiomyoma (arrow) that measured 4 cm in diameter. On sagittal T1FS after injection (b), homogeneous uptake with no necrosis is visualized. EVS (c) displays a unique posterior leiomyoma that has dramatically increased in size with a long axis measuring 9 cm. At Color Doppler (d), unusual large vessels are demonstrated in the central part of the mass. On spectral Doppler, the resistive index is 0.60. On MR sagittal T2 (e) and axial T2 (f), the leiomyoma (arrow in e) extends from the posterior cervix to the fundus of the uterus; its overall signal is close to pelvic muscle. On T1 and T1FS (not shown), no hemorrhage is displayed. On b1000 (g), signal intensity on the b1000 is superior to normal myometrium; ADC is 1.35 × 10⁻³ mm2/s. On DMR without injection (h), at the arterial phase (i


Related posts:
Stay updated, free articles. Join our Telegram channel
Full access? Get Clinical Tree