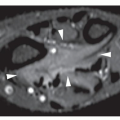
Bone-forming neoplasms are characterized by the formation of osteoid or mature bone directly by the tumor cells. They include osteoma, osteoid osteoma, and osteoblastoma.
Osteoma
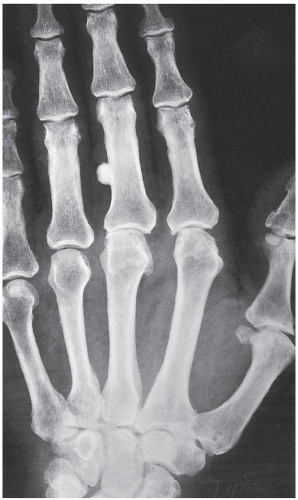
An osteoma is a slow-growing osteoblastic lesion commonly seen in the outer table of the calvarium and in the frontal and ethmoid sinuses. It is also occasionally encountered in long and short tubular bones, and at these sites, it is known as a parosteal osteoma. The lesion grows on the bone surface and has the radiographic appearance of a dense, ivory-like sclerotic mass attached to the cortex with sharply demarcated borders (
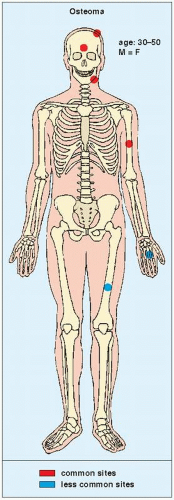
Fig. 17.1). Osteomas have been reported in patients from ages 10 to 79 years, with most in the fourth and fifth decades. Men and women are equally affected (
Fig. 17.2). Histologically, osteoma is composed primarily of bone, with a mature lamellar architecture consisting of concentric rings as in compact bone or, more commonly, parallel plates as in cancellous bone. An osteoma is an asymptomatic lesion that does not recur if excised surgically. Its importance lies in its similar radiographic presentation to the more aggressive parosteal osteosarcoma (see
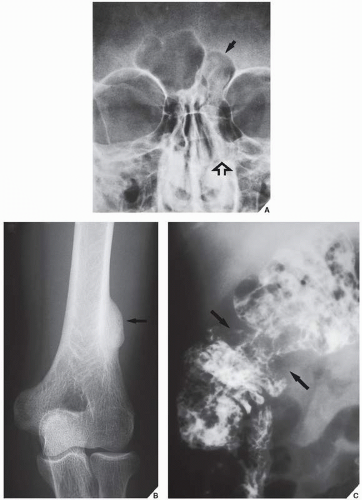
Fig. 16.32) and its common association with cutaneous and subcutaneous masses and intestinal polyps in the condition known as Gardner syndrome (
Fig. 17.3). Intestinal adenomatous polyps, particularly in the colon, may undergo a malignant transformation to carcinoma. The syndrome is a familial, autosomal-dominant disorder, frequently seen in Mormons in Utah.
Differential Diagnosis
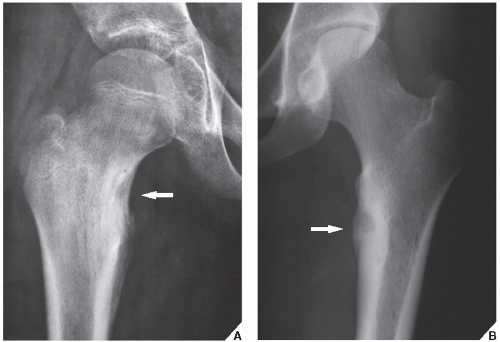
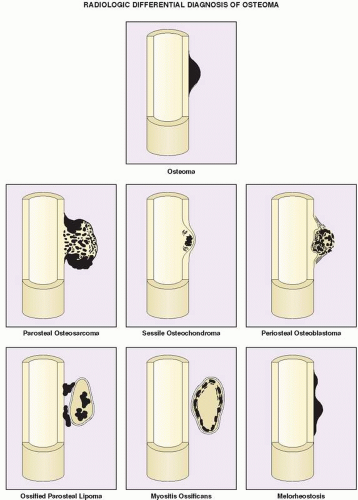
The differential diagnosis of solitary parosteal osteoma should include parosteal osteosarcoma, sessile osteochondroma, juxtacortical myositis ossificans, periosteal osteoblastoma, ossified parosteal lipoma, and focus of melorheostosis (
Fig. 17.4 and
Table 17.1). Among these, parosteal osteosarcoma is the most important entity that needs to be excluded, which may be a difficult task radiographically, because both lesions appear as ivory-like masses attached to the bone’s surface. The keys to recognizing osteoma, however, are its usually exquisitely smooth borders and well-circumscribed, intensely homogeneous sclerotic appearance on conventional radiographs. Parosteal osteosarcoma, in contrast, usually appears less dense and homogeneous than osteoma and may show a zone of decreased density at the periphery.
Sessile osteochondroma can usually be identified by its characteristic radiographic features: the cortex of the lesion merges without interruption with the cortex of the host bone, and the cancellous portion is continuous with the host medullary cavity of the adjacent metaphysis or diaphysis (see
Fig. 18.26B).
A well-matured focus of myositis ossificans may occasionally mimic parosteal osteoma. The radiographic hallmark of myositis ossificans is the so-called zonal phenomenon, characterized by a radiolucent area in the center of the lesion that indicates immature bone formation and a dense zone of mature ossification at the periphery. Often a thin radiolucent cleft separates the ossific mass from the adjacent cortex. At times, however, a mature lesion may adhere to and fuse with the cortex, thus mimicking a parosteal osteoma. In these instances, computed tomography (CT) may demonstrate the classic zonal phenomenon of the lesion (see
Figs. 4.57B and
4.58B).
Periosteal osteoblastoma and ossified parosteal lipoma rarely create a problem in terms of being mistaken for parosteal osteoma. Melorheostosis, a rare form of mixed sclerosing dysplasia, should be recognized on radiography by the characteristic appearance of segmental cortical thickening (“flowing hyperostosis”), often resembling wax dripping down one side of a candle. A typical focus of monostotic melorheostosis usually exhibits both parosteal and endosteal involvement, and the lesion commonly extends into the articular end of the bone, which are features that are almost never present in a parosteal osteoma (see
Figs. 33.48 and
33.49).
Osteoid Osteoma
The most important clinical symptom of osteoid osteoma is pain that is more severe at night but is dramatically relieved by salicylates (Aspirin) within approximately 20 to 25 minutes. This typical history holds in more than 75% of cases and serves as an important clue to the diagnosis.
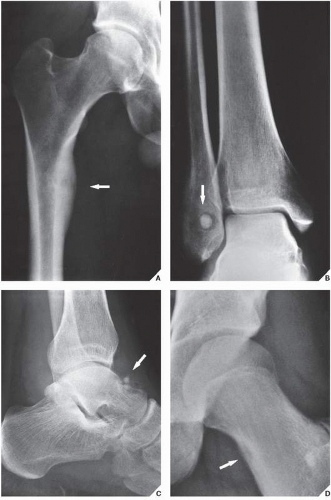
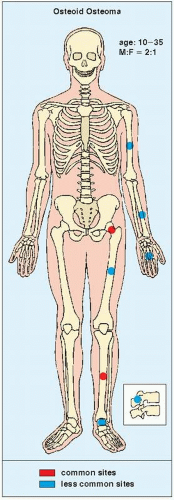
Osteoid osteoma occurs in the young, usually between the ages of 10 and 35, and its sites of predilection are the long bones, particularly the femur and tibia (
Fig. 17.5).
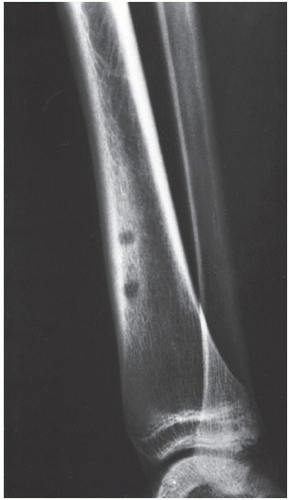
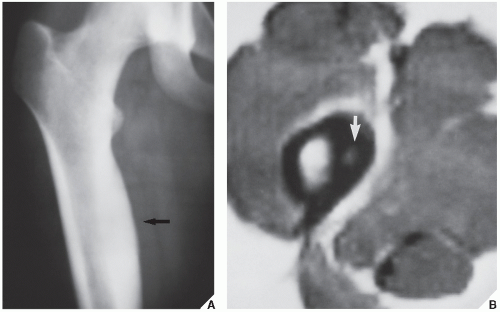
Osteoid osteoma is a benign osteoblastic lesion characterized by a nidus of osteoid tissue, which may be purely radiolucent or have a sclerotic center. The nidus has limited growth potential and usually measures less than 1 cm in diameter. It is often surrounded by a zone of reactive bone formation (
Fig. 17.6). Very rarely, an osteoid osteoma may have more than one nidus, in which case it is called a multicentric or multifocal osteoid osteoma (
Fig. 17.7). Depending on its location in the particular part of the bone, the lesion can be classified as cortical, medullary (cancellous), or subperiosteal. Osteoid osteomas can be further subclassified as extracapsular or intracapsular (intraarticular) (
Fig. 17.8).
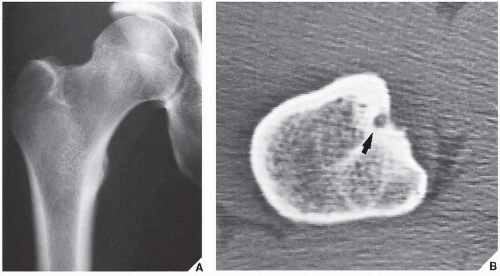
Standard radiographs may demonstrate the lesion, but CT (
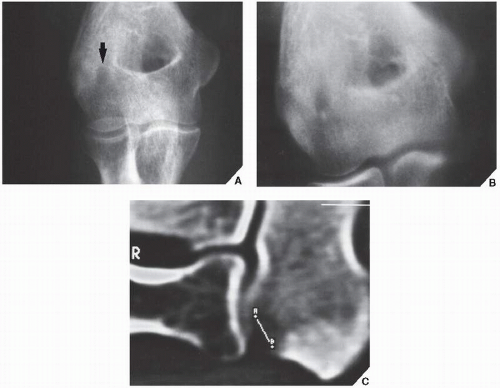
Fig. 17.9) is required to demonstrate the nidus and localize it precisely. CT has the added advantage of allowing exact measurement of the size of the nidus (
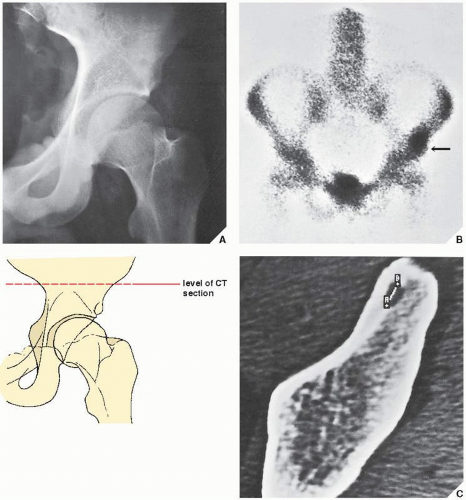
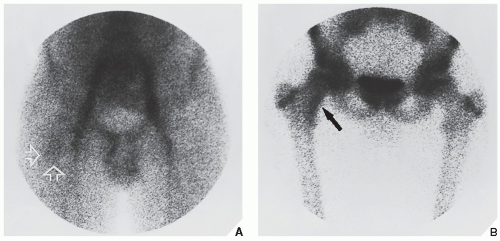
Fig. 17.10). Frequently, when the lesion cannot be demonstrated radiographically, a radionuclide bone scan is helpful, because osteoid osteoma invariably shows a marked increase in isotope uptake (
Fig. 17.11). This modality can be particularly helpful in cases for which the symptoms are atypical and the initial radiographs appear normal. The use of a three-phase technique is recommended. Radionuclide tracer activity can be observed on both immediate and delayed images (
Fig. 17.12).
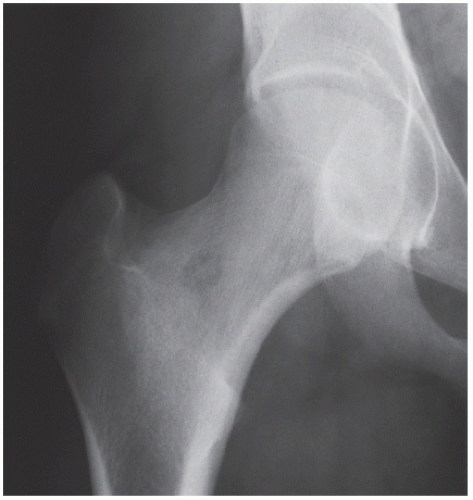
If the nidus is demonstrated radiographically, the diagnosis can usually be made with great assurance; only atypical presentations create diagnostic difficulty (
Fig. 17.13).
The suitability of magnetic resonance imaging (MRI) for the detection of osteoid osteoma remains unclear, and published reports have shown mixed results. Goldman and associates reported on four cases of intracapsular osteoid osteoma of the femoral neck, in which the lesions were evaluated with bone scintigraphy, CT, and MRI. Although in all cases abnormal findings were apparent in the MR images, the nidi could not be identified prospectively. On the basis of MRI findings of secondary bone marrow edema or synovitis, several incorrect diagnoses were made, which included Ewing sarcoma, osteonecrosis, stress fracture, and juvenile arthritis. In these cases, it is noteworthy that the correct diagnoses were made only after review of the radiographs and thin-section CT studies. Another report by Woods and associates involved three patients with a highly unusual association of osteoid osteoma with a reactive soft-tissue mass. In these cases, MRI studies might have led to confusion of osteoid osteoma with osteomyelitis or a malignant tumor. Moreover, in each case the nidus displayed different signal characteristics. In one case, the intensity of signal was generally low on all pulse sequences, but mild enhancement was seen after administration of gadolinium. In another case, the signal was of intermediate intensity, and administration of gadolinium revealed inhomogeneous enhancement of the nidus. For the third case in which radiographs showed the nidus to be intracortical, MRI could not identify the nidus distinctly.
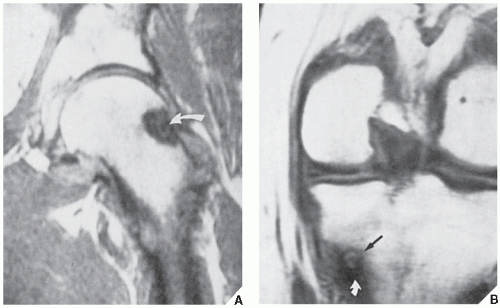
However, some reports do suggest the effectiveness of MRI for demonstrating the nidus of osteoid osteoma (
Figs. 17.14 and
17.15). Bell and colleagues clearly demonstrated an intracortical nidus on MRI that had not been seen on scintigraphy, angiography, or CT scans. In particular, imaging of osteoid osteoma with dynamic gadolinium-enhanced MR technique demonstrated greater conspicuity in detecting the lesion than with nonenhanced MRI.
Recently, Ebrahim and associates reported sonographic findings in patients with intraarticular osteoid osteoma. Ultrasound images revealed focal cortical irregularity and adjacent focal hypoechoic synovitis at the site of intraarticular lesions. The nidus was hypoechoic with posterior acoustic enhancement, and color Doppler imaging identified a vessel entering a focus of osteoid osteoma. It is noteworthy, however, that the authors concluded that the accuracy of sonography in the diagnosis of intraarticular osteoid osteoma cannot be certain because other intraarticular pathologic conditions, for example, inflammatory synovitis, may have a similar appearance. Therefore, one should seek corroborative features of this lesion using other imaging techniques, such as CT or MRI.
Histologically, the nidus is composed of osteoid or even mineralized immature bone. It is a small, well-circumscribed, and self-limited lesion. Its microtrabeculae and irregular islets of osteoid matrix and bone are surrounded by a richly vascular fibrous stroma in which osteoblastic and osteoclastic activities are often prominent. The perilesional sclerosis is composed of dense bone displaying a variety of maturation patterns.
Differential Diagnosis
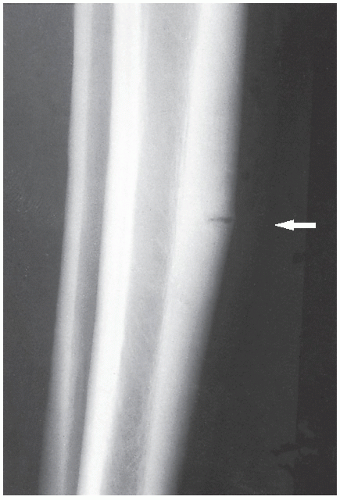
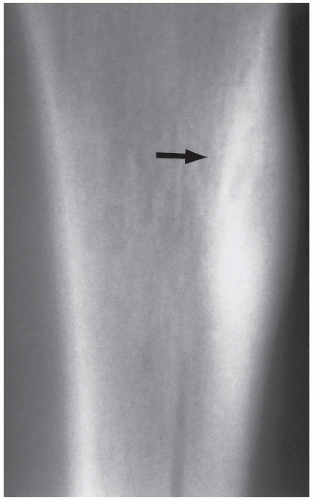
It must be emphasized that even when dealing with an apparent cortical osteoid osteoma of classic radiographic appearance, the differential diagnosis should include a stress fracture, a cortical abscess, and an osteosarcoma (
Fig. 17.16). In a stress fracture, the radiolucency is usually more linear than in an osteoid osteoma, and it runs perpendicular or at an angle to the cortex rather than parallel to it (
Fig. 17.17). A cortical bone abscess may have a similar radiographic appearance to that of osteoid osteoma, but it can usually be differentiated by a linear,
serpentine tract that extends away from the abscess cavity (
Fig. 17.18). An intracortical osteosarcoma is a rare bone-forming malignancy that arises solely within the cortex of bone and grossly involves neither the medullary cavity nor the soft tissues. On radiography, it appears as a radiolucent focus within the cortex (femur or tibia), surrounded by zone of sclerosis, and varying in size from 1.0 to 4.2 cm in reported cases. The cortex at the site of the lesion may bulge slightly or may be thickened. Periosteal reaction may or may not be present.
In intramedullary lesions, the differential diagnosis must consider a bone abscess (Brodie abscess), and in a lesion with calcified nidus,
a bone island (enostosis). The larger lesions must be also differentiated from osteoblastoma (see
Fig. 17.16B). A bone abscess may have a similar radiographic appearance, but one can usually detect a linear, serpentine tract extending from the abscess cavity toward the nearest growth plate (
Fig. 17.19). A bone island is characterized on radiography by the lesion’s brush borders, which blend with surrounding trabeculae in a pattern likened to “thorny radiation” or pseudopodia (
Fig. 17.20). In addition, bone islands usually show no increased activity on radionuclide bone scan. Distinguishing osteoid osteoma from osteoblastoma can be very difficult, if not impossible.
In general, osteoblastoma is larger than osteoid osteoma (usually more than 2 cm in diameter) and exhibits less reactive sclerosis, but the periosteal reaction may be more prominent.


 Get Clinical Tree app for offline access

