Osteoid osteoma occurs in the young, usually between the ages of 10 and 35, and its sites of predilection are the long bones, particularly the femur and tibia (Fig. 17.5).
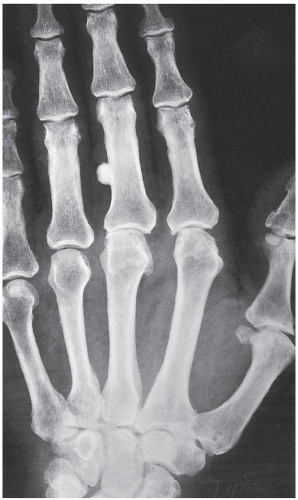 FIGURE 17.1 Parosteal osteoma. Dorsovolar radiograph of the hand demonstrates a parosteal osteoma of the proximal phalanx of the middle finger. A typical ivory-like mass is seen attached to the cortex. |
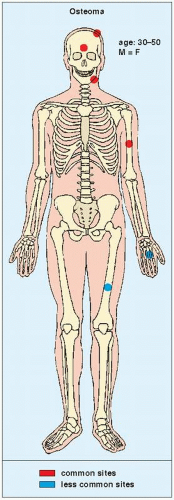 FIGURE 17.2 Osteoma: skeletal sites of predilection, peak age range, and male-to-female ratio. |
If the nidus is demonstrated radiographically, the diagnosis can usually be made with great assurance; only atypical presentations create diagnostic difficulty (Fig. 17.13).
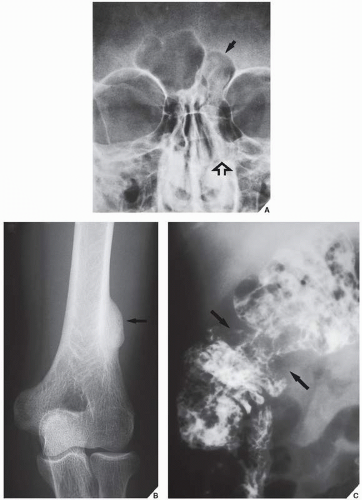 FIGURE 17.3 Gardner syndrome. (A) Frontal radiograph of the facial bones of a 36-year-old man shows the typical appearance of osteomas in the left frontal (arrow) and ethmoid (open arrow) sinuses. The dense, sclerotic masses are sharply demarcated from the surrounding structures by air. (B) This patient also had a parosteal osteoma of the distal left humerus, (arrow) multiple polyps in the colon, and subcutaneous masses, features of Gardner syndrome. (C) Barium enema shows several polyps in the cecum and an apple-core lesion (arrows), proved by histologic examination to be adenocarcinoma. |
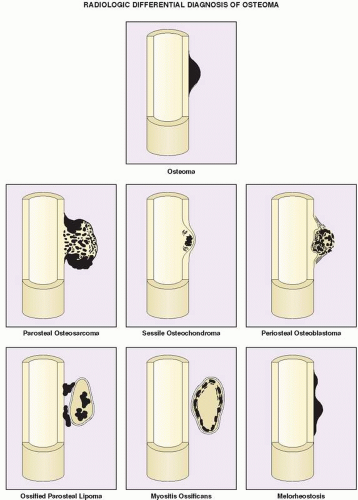 FIGURE 17.4 Differential diagnosis of parosteal osteoma. Schematic representation of various cortical and juxtacortical lesions having similar appearance to osteoma. |
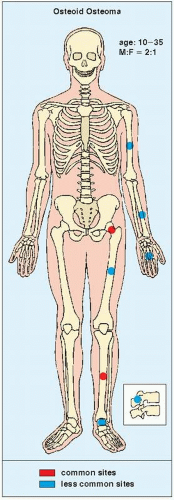 FIGURE 17.5 Skeletal sites of predilection, peak age range, and male-to-female ratio in osteoid osteoma. |
TABLE 17.1 Differential Diagnosis of Parosteal Osteoma | ||||||||||||||||
|---|---|---|---|---|---|---|---|---|---|---|---|---|---|---|---|---|
|
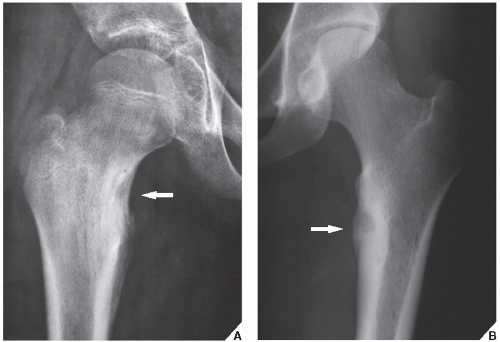 FIGURE 17.6 Osteoid osteoma. (A) Anteroposterior radiograph of the right hip of a 12-year-old boy with a history of right groin pain that was more severe at night and was relieved promptly by aspirin shows the typical appearance and location of osteoid osteoma (arrow). The radiolucent nidus in the medial aspect of the femoral neck measures 1 cm in diameter and is surrounded by a zone of reactive sclerosis. Note the periarticular osteoporosis that usually accompanies this lesion. (B) Purely radiolucent nidus surrounded by a zone of reactive sclerosis (arrow) is seen in the medial femoral cortex of an 18-year-old woman. |
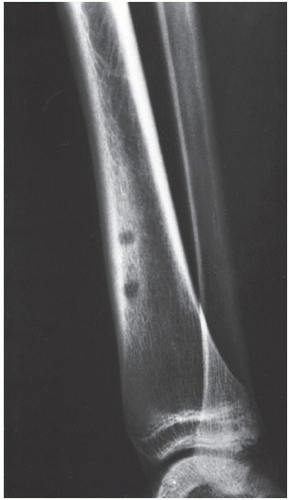 FIGURE 17.7 Multifocal osteoid osteoma. A 17-year-old boy presented with pain in the left lower leg for 3 months. It was promptly relieved by aspirin. Lateral radiograph of the lower leg shows two well-defined radiolucencies within a sclerotic area in the anterior aspect of the distal tibia. A resected specimen showed three nidi of osteoid osteoma, the two most distal of which were fairly close to one another, creating a single radiolucency on the radiograph. (From Greenspan A et al., 1974, with permission.) |
serpentine tract that extends away from the abscess cavity (Fig. 17.18). An intracortical osteosarcoma is a rare bone-forming malignancy that arises solely within the cortex of bone and grossly involves neither the medullary cavity nor the soft tissues. On radiography, it appears as a radiolucent focus within the cortex (femur or tibia), surrounded by zone of sclerosis, and varying in size from 1.0 to 4.2 cm in reported cases. The cortex at the site of the lesion may bulge slightly or may be thickened. Periosteal reaction may or may not be present.
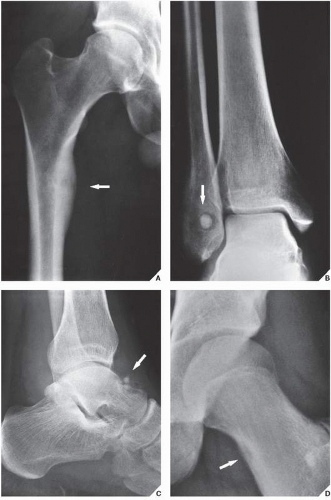 FIGURE 17.8 Types of osteoid osteoma. The radiographic presentation of osteoid osteoma differs according to its location in the bone. (A) In the cortical type, there is intense reactive sclerosis surrounding the nidus, as seen here in the medial cortex of the femur (arrow). (B) The medullary variant, as seen here in the distal fibula, exhibits a dense, sclerotic nidus surrounded by a halo of radiolucent osteoid tissue (arrow). Note the almost total lack of reactive sclerosis. (C) In subperiosteal osteoid osteoma, seen here on the surface of the talar bone (arrow), periosteal response is minimal and reactive sclerosis is completely absent. (D) In the intracapsular osteoid osteoma, the radiolucent nidus seen here in the medial aspect of the proximal portion of the femoral neck (arrow) shows only minimal reactive sclerosis. |
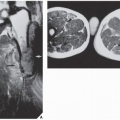
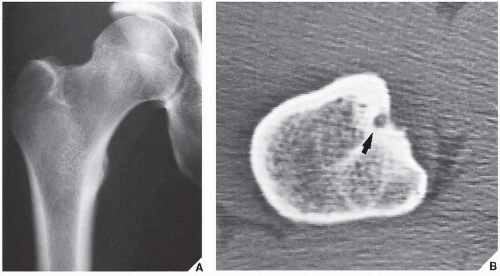 FIGURE 17.9 CT of osteoid osteoma. (A) Anteroposterior radiograph of the hip of a 24-year-old man with pain in the right upper thigh shows a lesion in the lesser trochanter, but a diagnosis of osteoid osteoma cannot be made unequivocally. (B) CT section, however, clearly demonstrates the nidus (arrow). |
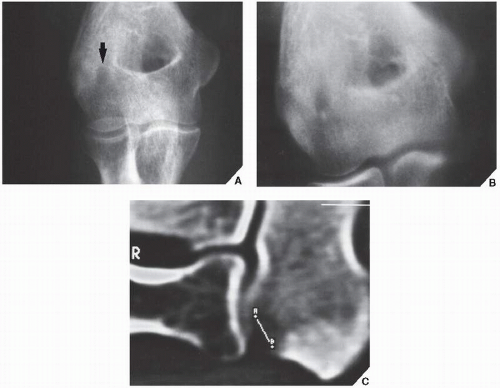 FIGURE 17.10 CT of osteoid osteoma. (A) Anteroposterior radiograph of the right elbow of a 31-year-old man with the typical clinical symptoms of osteoid osteoma demonstrates periarticular osteoporosis. There is the suggestion of a lesion in the capitellum (arrow). (B) Conventional tomogram shows a radiolucent area surrounded by a zone of sclerotic reaction. (C) CT section unequivocally demonstrates a subarticular nidus, which measures 6.5 mm. |
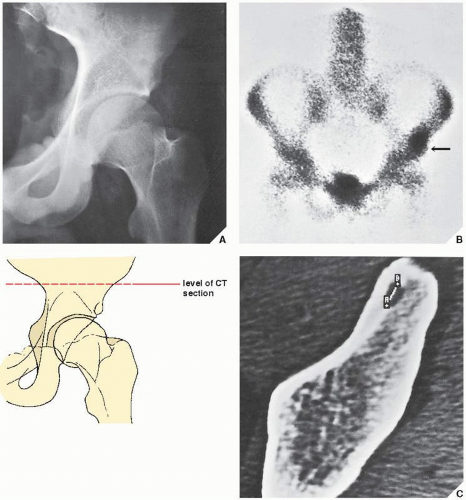 FIGURE 17.11 Scintigraphy and CT of osteoid osteoma. (A) Anteroposterior radiograph of the left hip of a 16-year-old boy with a typical history of osteoid osteoma is equivocal, although there is the suggestion of radiolucency in the supraacetabular portion of the ilium. (B) Radionuclide bone scan shows an increased uptake of isotope in the supraacetabular portion of the left ilium (arrow). (C) Subsequent CT scan not only demonstrates the lesion but also allows its measurement (6.8 mm). |
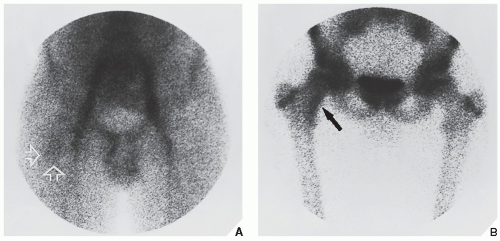 FIGURE 17.12 Scintigraphy of osteoid osteoma. (A) In the first phase of a three-phase radionuclide bone scan, 1 minute after intravenous injection of 15 mCi (555 MBq) 99mTc-labeled methylene diphosphonate (MDP), there is increased activity in the iliac and femoral vessels. Discrete activity in the area of the medial femoral neck (open arrows) is related to the nidus of osteoid osteoma. (B) In the third phase, 2 hours after injection, there is accumulation of a bone-seeking tracer in the femoral neck lesion (arrow). (From Greenspan A, 1993, with permission.) |
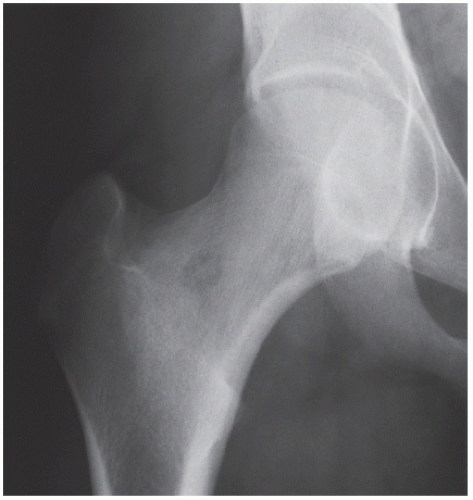 FIGURE 17.13 Osteoid osteoma. An anteroposterior radiograph of the right hip shows a radiolucent lesion in the femoral neck with a faintly outlined central density. There is no evidence of surrounding sclerosis. |
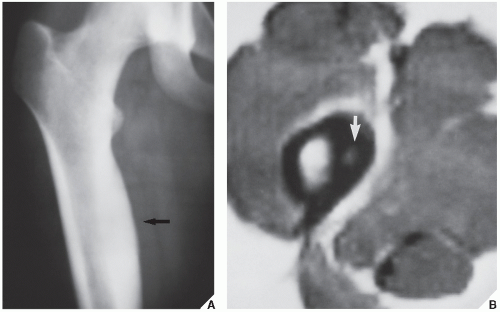 FIGURE 17.14 MRI of osteoid osteoma. (A) Conventional radiograph shows a sclerotic area localized to the medial aspect of proximal femoral shaft (arrow). The nidus is not apparent. (B) Axial T1-weighted MRI clearly demonstrates the high-intensity nidus (arrow) within a low-intensity sclerotic cortex. (Courtesy of Lynne S. Steinbach, M.D., San Francisco, California; from Greenspan A, 1993, with permission.) |
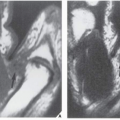
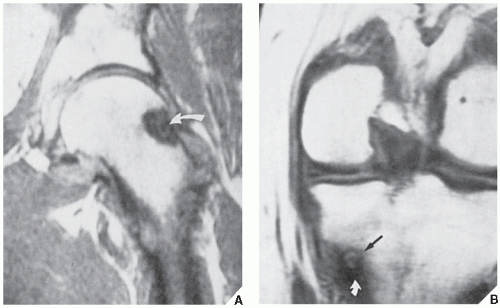 FIGURE 17.15 MRI of osteoid osteoma. (A) Coronal T1-weighted (SE; TR 600/TE 20 msec) MRI shows an osteoid osteoma (curved arrow) in the lateral aspect of the neck of the left femur. (B) Coronal T1-weighted (SE; TR 600/TE 20 msec) MRI shows an osteoid osteoma in the medial cortex of the left tibia (arrow). The curved arrow points to the perilesional sclerosis. |
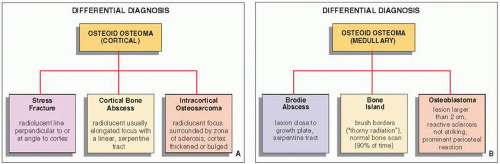 FIGURE 17.16 Differential diagnosis of (A) cortical and (B) medullary osteoid osteoma. |
In general, osteoblastoma is larger than osteoid osteoma (usually more than 2 cm in diameter) and exhibits less reactive sclerosis, but the periosteal reaction may be more prominent.
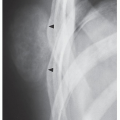
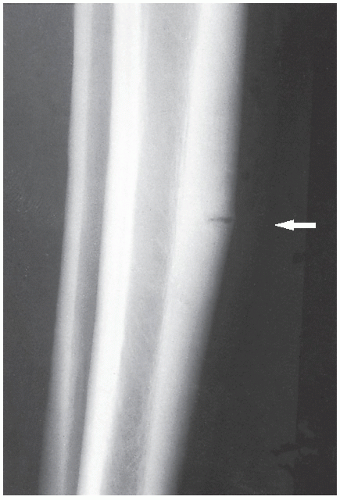 FIGURE 17.17 Stress fracture. Lateral radiograph demonstrates a stress fracture of the tibia (arrow). Note the perpendicular direction of the radiolucency to the long axis of the tibial cortex. In osteoid osteoma, the radiolucent nidus is oriented parallel to the cortex. |
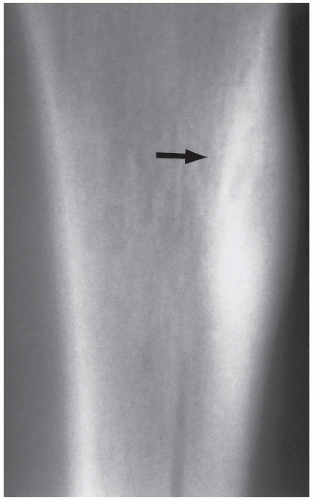 FIGURE 17.18 Cortical abscess. Lateral tomogram of the tibia shows a radiolucent, serpentine tract of a cortical bone abscess (arrow) that was originally misdiagnosed as osteoid osteoma.
Related posts: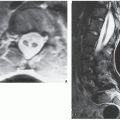 Radiologic Evaluation of Skeletal Anomalies Radiologic Evaluation of Skeletal Anomalies
 Benign Tumors and Tumor-like Lesions III: Fibrous, Fibroosseus, and Fibrohistiocytic Lesions Benign Tumors and Tumor-like Lesions III: Fibrous, Fibroosseus, and Fibrohistiocytic Lesions
 Upper Limb III: Distal Forearm, Wrist, and Hand Upper Limb III: Distal Forearm, Wrist, and Hand
 Benign Tumors and Tumor-Like Lesions IV: Miscellaneous Lesions Benign Tumors and Tumor-Like Lesions IV: Miscellaneous Lesions
 Upper Limb III: Distal Forearm, Wrist, and Hand Upper Limb III: Distal Forearm, Wrist, and Hand
Stay updated, free articles. Join our Telegram channel
Full access? Get Clinical Tree
 Get Clinical Tree app for offline access

|