(15.1)
where ϕ(z) is the excitation fluence as a function of depth (z). The emission profile was represented by a simple mono-exponential function, as the subsurface peak is not relevant for fluorescent photons originating within the tissue, only their rate of attenuation, given by

(15.2)
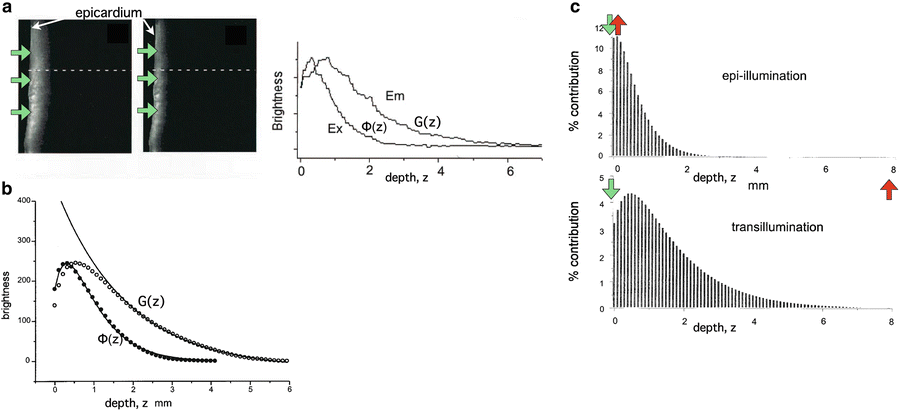
Fig. 15.1
Model of fluence profiles of excitation and emission light derived from experimental measurements. (a) Experimental transmural cross-section of ventricular slab showing decay of light incident of epicardium (shown by green arrows) at excitation (left) and emission (centre) wavelengths. (Right) individual profiles obtained from dotted-lines in experimental images plotted with depth. (b) Average excitation (filled circles) and emission (open circles) profiles, including solid lines showing fit of mathematical relations described above. (c) Percentage contributions to total collected signal during epi-illumination and transillumination modalities with illumination and detection directions shown by green and red arrows, respectively. Used with permission from Baxter et al. (2001)
Importantly, Baxter et al. (2001) then used the expressions for ϕ(z) and G(z) to derive a weighting function w(z), defined as the convolution of the excitation and emission profiles (Girouard et al. 1996), normalised by the total fluorescent light emitted from the entire tissue

where z = 0 is the illuminated surface and T the tissue thickness. Using this function, the authors were able to directly calculate the relative contribution to the total collected signal from the tissue depth, showing that 82 % of collected fluorescent originates from within the first 1 mm of the epicardium. A similar analysis was also performed for transillumination in which the optical detector is located on the opposite side of the tissue to the illuminated surface. Figure 15.1c shows the percentage contributions to the recorded signal from both setups.

(15.3)
3.2 Simulation of Depth-Weighted Averaging of Fluorescent Signals
3.2.1 Combing with Micro-Electrode Recordings
In the same study in which the weighting function in Eq. (15.3) was mathematically defined, Baxter et al. (2001) went on to use this expression to simulate optically-recorded action potentials using a digitised action potential from a microelectrode recording as input. The spatial profile of the microelectrode action potential was combined with the weighting function over successive time-points. The results clearly showed the expected prolongation of the simulated optical action potential upstroke, qualitatively similar to the corresponding experimental optical measurements.
3.2.2 Combing with Simulated Transmembrane Potential Dynamics
Soon after, studies by Janks and Roth (2002) and Bray and Wikswo (2003) applied the weighting function proposed by Baxter et al. (2001) to assist in the interpretation of a number of important electrophysiological findings, recorded by optical mapping, but whose physiological explanation was as yet not fully understood.
Both studies combined the weighting function in Eq. (15.3) along with the transmembrane potential levels V m (x, y, z) calculated explicitly at each point in space using the bidomain (Janks and Roth 2002) or monodomain (Bray and Wikswo 2003) equations to derive an expression for the weighted average of the transmembrane potential recorded at the tissue surface  given by
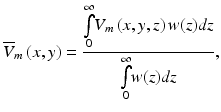
where z is the depth beneath the surface.
 given by
(15.4)
The study by Janks and Roth (2002) suggested that the averaging of fluorescent signals over depth may account for the under-estimation of the optically-recorded polarisation levels of cardiac tissue close to unipolar electrodes following strong stimulation, relative to the much stronger epicardial polarisation values predicted by computational bidomain simulations. Simulating unipolar electrode stimulus within a simple slab geometry, in combination with the modelling approach of Eq. (15.4), the authors demonstrated an approximate threefold reduction in the amplitude of the simulated optical potential close to the electrode, relative to the predicted electrical potential at a corresponding location on the epicardial surface, significantly improving the match with corresponding experimental measurements. Although strongly polarised on the tissue surface, polarisation levels are known to decay intramurally with decay constant equal to the cardiac length constant. Thus, such a reduction in  was suggested by the authors to result from the additional contributions of these more weakly polarised mid-myocardial layers of tissue, introduced through the use of the weighting function, reducing the apparent optically-recorded epicardial polarisation level.
 was suggested by the authors to result from the additional contributions of these more weakly polarised mid-myocardial layers of tissue, introduced through the use of the weighting function, reducing the apparent optically-recorded epicardial polarisation level.
Bray and Wikswo (2003) used a similar method to examine the depth-averaging effects upon simulated epicardially-recorded fluorescent signals during episodes of sustained reentry. The study demonstrated that transduction of information from depth regarding entirely intramural wavefronts propagating beneath an epicardial recording site during reentry could be responsible for the existence of the so-called dual-humped action potentials. These dual-humped action potentials had morphologies which closely matched those witnessed previously in experimental measurements (Efimov et al. 1999, 2000), and thus provided strong evidence that averaging over tissue depth of the collected optical signal was the mechanism behind their formation. In addition to confirming the prolongation of the optically-recorded action potential upstroke, the authors also showed that, following spiral-wave break-up, the averaging of transmembrane potential signals from depth resulted in a dependence of the local optical action potential amplitude upon the immediate subepicardial activity. This, combined with a spatial blurring of the optical signal, compromised the accuracy of surface phase singularity localisation (the organising centre of the reentrant wave), including both false positive and false negative findings.
4 Simulation of 3D Effects of Photon Scattering Using the Diffusion Equation
The studies described above all used depth-dependent weighting functions to simulate the effects of sampling transmembrane potential levels from internal layers of tissue beneath the surface recording sites. Consequently, they considered only the effects of fluorescent signal collection from linear depths beneath the recording site—they had not, as yet, accounted for the effects of lateral photon scattering.
As light passes through biological tissue it is both absorbed and scattered, meaning the trajectories of photons may significantly change on their journey. The effects of lateral photon scattering in planes parallel to the recording tissue surface, where both excitation light intensity and fluorescent emission are strongest, are thus thought highly likely to contribute to signal distortion. In fact, at a similar time to the above studies, Ding et al. (2001) used a stochastic modelling approach (discussed later in Sect. 5) to simulate the trajectories of individual photons (or photon ‘packets’). They demonstrated, for the first time in this context, that photon scattering was an inherently three-dimensional phenomena, and that optical signals from a given pixel are collected from an interrogation volume, extending a similar, and in some cases greater, distance in the plane of the recording surface as from depth.
The landmark study by Hyatt et al. (2003) was the first of its kind to simulate, and analyse, the effects of three-dimensional photon scattering in cardiac tissue on fluorescent signal distortion during optical mapping recordings. The authors, for the first time, developed the application of the photon diffusion equation for the simulation of optical mapping signals; a general method which would be followed by many other important subsequent studies.
4.1 The Photon Diffusion Equation
At the wavelengths commonly used in fluorescent imaging, biological tissue is highly scattering and relatively weakly absorbing. In such instances, the Boltzmann transport equation—which describes the movement of electromagnetic waves in scattering media—can be approximated to a continuum representation of photon transport, termed the photon diffusion equation (Haskell et al. 1994; Hielscher et al. 1995). For application to optical mapping, the steady-state form of the photon diffusion equation is appropriate as the time-scales which govern changes in electrical activation (10−6 s) are many orders of magnitude larger than the time-scales involved in photons reaching equilibrium within the tissue (10−15 s). The steady-state photon diffusion equation provides a computationally-efficient method of simulating photon transport in biological tissue which has been shown to agree well with more accurate discrete stochastic approaches such as the Monte Carlo method (see Sect. 5).
The steady-state photon diffusion equation for highly-scattering media is given by

where  is the photon density (photons/mm3) at any point in the tissue with position vector r (mm), D (mm) and μ a (mm−1) are the optical diffusivity and absorption coefficients, respectively, and ω describes the source of photons within the tissue at position r. It should be noted that, as we are dealing with the steady-state form of the photon diffusion equation, the time-derivative term
  which appears in the full form of the photon diffusion equation (Hielscher et al. 1995), has been dropped, and thus a common factor of the speed of light c is missing from Eq. (15.5). Hence, we adopt the standard procedure of giving D and μ a the unorthodox units above.

(15.5)
 is the photon density (photons/mm3) at any point in the tissue with position vector r (mm), D (mm) and μ a (mm−1) are the optical diffusivity and absorption coefficients, respectively, and ω describes the source of photons within the tissue at position r. It should be noted that, as we are dealing with the steady-state form of the photon diffusion equation, the time-derivative term
  which appears in the full form of the photon diffusion equation (Hielscher et al. 1995), has been dropped, and thus a common factor of the speed of light c is missing from Eq. (15.5). Hence, we adopt the standard procedure of giving D and μ a the unorthodox units above.
The diffusion coefficient D can also be defined in terms of the explicit optical properties of the tissue by Jacques (1998)

where μ s ′ is the reduced scattering coefficient, related to the scattering coefficient μ s by  , where g is the anisotropy of scattering and represents the average cosine
  of each scattering deflection angle θ (Jacques 1998). Values of μ a , μ s and g can be obtained experimentally from measurements of diffuse reflectance and transmittance, as performed in Ding et al. (2001). It should be noted that the use of D as a scalar quantity implies an assumption of isotropic scattering properties of the tissue.

(15.6)
 , where g is the anisotropy of scattering and represents the average cosine
  of each scattering deflection angle θ (Jacques 1998). Values of μ a , μ s and g can be obtained experimentally from measurements of diffuse reflectance and transmittance, as performed in Ding et al. (2001). It should be noted that the use of D as a scalar quantity implies an assumption of isotropic scattering properties of the tissue.
4.2 Application of the Photon Diffusion Equation to Simulation Optical Mapping Signals
The photon diffusion equation can be applied directly to simulate the distribution of light during optical mapping recordings using the method originally proposed by Hyatt et al. (2003). In the original study by Hyatt et al. (2003), the distribution of illuminating light was modelled by simply using a mono-exponential decay profile, made possible due to the regular cuboid domain over which the simulations were performed, with the photon diffusion equation used to simulate the distribution of fluorescent light during the process of emission. In later works (Bishop et al. 2006c, 2007b), however, the photon diffusion equation was also used to model the excitation process.
4.2.1 Simulating Illumination
As in Bishop et al. (2006c), the photon diffusion equation can be used to calculate the distribution of photon density during the process of illumination. In this case, a modified version of Eq. (15.5) is used

where the source term w is set to zero, as there are no sources of photons within the myocardium during illumination. Instead, we define boundary conditions on Eq. (15.7) to replicate uniform illumination of the tissue surface, setting  , an arbitrary constant which just defines the magnitude of the illuminating source. The constants D ex and μ a ex are taken from measurements specifically at the illuminating wavelength.

(15.7)
 , an arbitrary constant which just defines the magnitude of the illuminating source. The constants D ex and μ a ex are taken from measurements specifically at the illuminating wavelength.
Figure 15.2 shows the solution to Eq. (15.7) over an anatomically-realistic rabbit ventricular model, demonstrating the distribution of illumination photon density throughout the ventricular volume with optical parameter values taken from Ding et al. (2001). In this particular case, a numerical finite element solution method has been used (see Sect. 4.3) to solve Eq. (15.7). Boundary conditions (Dirichlet) of  have been applied all over the epicardial surface to replicate uniform panoramic illumination. The Figure clearly shows the attenuation of the illuminating light intensity into the tissue depth, such that very little light in fact reaches the endocardial surface. Figure 15.2b shows that within the tissue the decay of the photon density approximates mono-exponential with penetration depth equal to
  . The distribution of
  throughout the tissue is then used as input to the simulation of fluorescent emission.

 have been applied all over the epicardial surface to replicate uniform panoramic illumination. The Figure clearly shows the attenuation of the illuminating light intensity into the tissue depth, such that very little light in fact reaches the endocardial surface. Figure 15.2b shows that within the tissue the decay of the photon density approximates mono-exponential with penetration depth equal to
  . The distribution of
  throughout the tissue is then used as input to the simulation of fluorescent emission.
Fig. 15.2
(a) Distribution of photon density due to uniform epicardial illumination within an anatomically-realistic rabbit ventricular model derived from numerical solution to Eq. (15.7). (b) Decay of simulated photon density with depth into tissue, approximating monoexponential decay. Used with permission from Bishop et al. (2006c)
4.2.2 Simulating Voltage-Sensitive Fluorescent Emission
The second process, of fluorescent emission, is simulated as in Hyatt et al. (2003) (and later studies) by solving the photon diffusion equation of the form

In this specific case, the right-hand side source term ω has been represented as being proportional to the product of the photon density at a given point in the tissue and also the specific level of transmembrane voltage (V m ), and where k is a constant. This approach successfully models the principles by which voltage-sensitive fluorescent dyes work: the total fluorescence given-off by a region of tissue varies in proportion to the total amount of illuminating light it receives, and also the value of transmembrane potential at that point. Analogous to the case of illumination, the optical coefficients in Eq. (15.8) are obtained at the emission wavelength of the fluorescent light.

(15.8)
The distribution of V m within the tissue is usually derived in an entirely separate simulation procedure, whereby the bidomain (or monodomain) model of cardiac tissue electrophysiology is used, in a similar manner to the simple depth-weighted averaging approaches of Eq. (15.4). Thus, it is often convenient to think of this method of optical signal simulation as a useful post-processing tool which can be subsequently applied to V m simulations in order to better compare with experiments. It should be noted that, practically, it is necessary to add an off-set to the V m distribution, (such as + 1 V) to ensure that the source term ω is never negative. This offset replicates the fact that the optical mapping technique records small changes in intensity upon a large background of fluorescence, with a typical 10 % change in fluorescence occurring following a 100 mV change in membrane voltage.
4.2.3 Derivation of the Optical Signal
V m distributions at each required time-step (usually 1 ms) are sequentially used as input into Eq. (15.8) and solved to give the corresponding distribution of  throughout the tissue.
  is then used to directly derive the value of the recorded optical signal V opt at the tissue surface from which the signal is recorded. In optical mapping experiments, the optical detector records the photons exiting the epicardial surface which are subsequently incident on the detector. Here, this flux is calculated by applying Fick’s Law at the recording tissue surface in accordance with Hyatt et al. (2003). Fick’s Law is a commonly used formula to relate the flux of some diffusive variable exiting a boundary to the spatial gradient of that variable across the boundary. Applying this, we can write-down

where n is the normal to the recording surface. Uniform detection is assumed, which approximates the conditions in panoramic optical mapping experimental set-ups, such that we assume that all photon flux exiting the epicardium is detected.
 throughout the tissue.
  is then used to directly derive the value of the recorded optical signal V opt at the tissue surface from which the signal is recorded. In optical mapping experiments, the optical detector records the photons exiting the epicardial surface which are subsequently incident on the detector. Here, this flux is calculated by applying Fick’s Law at the recording tissue surface in accordance with Hyatt et al. (2003). Fick’s Law is a commonly used formula to relate the flux of some diffusive variable exiting a boundary to the spatial gradient of that variable across the boundary. Applying this, we can write-down
(15.9)
In optical mapping experiments, spatial variations across the tissue in dye loading/uptake, photo-bleaching, illuminating light intensity amongst other factors, means that absolute changes in recorded fluorescent intensity from a specific region are hard to directly relate to absolute levels of local membrane potential. Consequently, fluorescent signals from each detector element are normalised with respect to the amplitude of an action potential, recorded during pacing. A similar process is followed in simulating such signals.
4.3 Numerical (Finite Element) Solution to the Photon Diffusion Equation
The first approaches which applied the photon diffusion equation to simulate optical mapping signals, by the Pertsov laboratory, used explicit analytic solution methods to solve for the fluorescent photon density throughout the tissue (Hyatt et al. 2003, 2005; Bernus et al. 2004). These methods used a convolution of the Green’s function over the tissue volume with the distribution of the voltage-sensitive fluorescence source term ω. Although mathematically elegant and computationally efficient, these methods were restricted to solving the problem over simple, regular domains (primarily a 3D infinite slab or cuboid geometry). Numerical approaches, such as the finite element method, were suggested as an alternative approach to simulate optical mapping signals in the first studies by our Group (Bishop et al. 2006c, 2007b). The key advantage of using a finite element solution method to solve the photon diffusion equation is that it can be applied to any geometrical domain, allowing signals to be simulated over anatomically-realistic ventricular models (being used more frequently in computational modelling), and facilitating a more direct comparison with experimental investigations.
4.3.1 Boundary Conditions
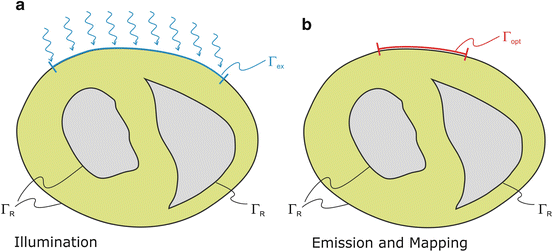
The optical domain  is bounded by

where  is a mixed Robin-type boundary and
  is of Dirichlet type. In the case of illumination, a given surface of the tissue,
  , is illuminated. This is modeled by applying a Dirichlet boundary condition along
  , that is

Here  is a typical choice. A schematic representation of the boundary conditions used during illumination and emission is shown in Fig. 15.3.
 is bounded by

(15.10)
 is a mixed Robin-type boundary and
  is of Dirichlet type. In the case of illumination, a given surface of the tissue,
  , is illuminated. This is modeled by applying a Dirichlet boundary condition along
  , that is
(15.11)
 is a typical choice. A schematic representation of the boundary conditions used during illumination and emission is shown in Fig. 15.3.
Fig. 15.3
Boundary conditions for photon diffusion equations during (a) illumination and (b) emission. Note that  is not a boundary condition used for solving the emission equation, rather, over
  optical traces are derived from
  to compute optical maps
 is not a boundary condition used for solving the emission equation, rather, over
  optical traces are derived from
  to compute optical maps
The choice of boundary conditions during illumination on other tissue surfaces, and the choice on all surfaces during the process of fluorescent emission is less apparent, however. Here, all other boundaries are assumed to be of mixed Robin-type boundaries where the partial current boundary condition (Haskell et al. 1994; Hielscher et al. 1995) holds. This type of boundary condition is noted for its accurate representation of the interface between biological tissue and its surrounding media which accounts for the refractive index mismatches across this interface. The partial current boundary condition is derived by considering conservation of flux at the boundary and accounts for the total internal reflection of photons incident on the boundary. Increased photon reflection at a boundary will increase scattering in this region, creating a greater distortion in the optical signal. In particular, the partial current boundary condition relates the value of photon density on the boundary to the value of the gradient of the photon density at the same point on the boundary by

where n is the outward pointing normal vector at the boundary  . L s is defined by

where R eff is the effective reflection coefficient, and is a function of the refractive index mismatch between the tissue and the surrounding media (Haskell et al. 1994).

(15.12)
 . L s is defined by
(15.13)
Many previous studies which have used the photon diffusion equation to simulate photon transport in biological tissue have favoured the use of a zero boundary condition

on the bounding external tissue surfaces (for example in Arridge 1993). Such a choice has also been used in the other studies which have used the photon diffusion equation to simulate photon movement during optical mapping experiments (Hyatt et al. 2003, 2005; Bernus et al. 2004). The appeal of this condition lies in the simplicity of its implementation, although in terms of physical representation, this approach is less accurate than the partial current boundary condition. The details of these differences are discussed in many studies that have assessed the use of different boundary conditions on the photon diffusion equation (Haskell et al. 1994; Hielscher et al. 1995). However, in relation to specific metrics of simulated optical signals (such as optical action potential upstroke duration), the use of the partial current boundary condition has been shown to differ by less than 5–10 % (dependent upon specific interface simulated) compared to the use of the zero boundary condition (Bishop et al. 2006c).

(15.14)
Apart from boundary conditions the only difference between the illumination and the emission scenario is the presence of a volume photon source density over the entire domain  due to fluorescence, discussed in the sections above to be
  during emission and ω = 0 during illumination.
 due to fluorescence, discussed in the sections above to be
  during emission and ω = 0 during illumination.
4.4 Finite Element Discretisation
In terms of numerical treatment there is no difference between illumination and emission scenario. Thus, the general form of Eq. (15.5) is used. A weak form of Eq. (15.5) is found by multiplying with a suitable test function, ψ, which fulfills any prescribed boundary conditions, and integration over the entire domain 

where here ξ represents either ex or em, representing either excitation illumination or emission, respectively. Using the identity

with  and rearranging terms yields

Prescribing the partial current boundary condition given in Eq. (15.12) we rewrite

For notational convenience we use


hence the weak form is given as

which is satisfied for all choices ψ within a suitable function space.


(15.15)

(15.16)
 and rearranging terms yields
(15.17)

(15.18)

(15.19)

(15.20)

(15.21)

(15.22)

(15.23)
To apply the finite element method, the unknown field  is approximated as

where  are time-dependent coefficients and α i are appropriate (spatial) basis functions. By inserting Eq. (15.24) into Eq. (15.18) and using the basis functions α to construct the test function ψ one obtains a linear system of equations given as

where


The resulting matrices are referred to as stiffness matrix K, mass matrix M, and boundary mass matrix  . Note that the boundary mass matrix
  is only used if proper partial current boundary conditions are enforced. Otherwise the term
  is dropped and homogeneous Dirichlet boundary conditions are enforced over all surfaces
  . The resulting system of equations is solved iteratively.
 is approximated as
(15.24)
 are time-dependent coefficients and α i are appropriate (spatial) basis functions. By inserting Eq. (15.24) into Eq. (15.18) and using the basis functions α to construct the test function ψ one obtains a linear system of equations given as
(15.25)

(15.26)

(15.27)

(15.28)
 . Note that the boundary mass matrix
  is only used if proper partial current boundary conditions are enforced. Otherwise the term
  is dropped and homogeneous Dirichlet boundary conditions are enforced over all surfaces
  . The resulting system of equations is solved iteratively.
4.5 Application Studies Using the Diffusion Approach
4.5.1 Simulation of Optical Action Potential Upstroke Distortion
As mentioned previously, the prolongation of the optical action potential upstroke has long been suggested to be an important quantitative measure of the degree of distortion of optical mapping signals, relative to upstroke recorded from micro-electrodes. Hyatt et al. (2003) represented the first Group to use the photon diffusion equation to quantify the effects of three-dimensional photon scattering upon signal distortion during optical recordings from cardiac tissue during pacing. The authors used an analytic solution to Eq. (15.8) over a simplified (cuboid) slab of ventricular tissue, with uniform illumination being modelled by a simple mono-exponential decay of excitation light intensity with depth. They showed that the upstroke of the optically-simulated action potential associated with a planar paced wavefront passing beneath the surface recording site was prolonged and distorted with respect to the ‘true’ epicardial action potential upstroke derived from electrophysiological simulations (which acted as input to the optical simulation model). Importantly, though, the authors also showed that the morphology of distortion which characterised the optical upstroke was specific to the intramural direction of wavefront propagation beneath the epicardium: propagation parallel to the epicardial recording surface gave rise to a symmetrically distorted upstroke, whilst propagation towards or away from the epicardium resulted in an asymmetrical distortion. More specifically, they suggested that the potential level corresponding to the maximal rate of rise of the optical upstroke (termed Vf ∗) depends upon the angle θ of the wavefront direction with respect to the imaged tissue surface. These results were later validated experimentally (Hyatt et al. 2005).
Stay updated, free articles. Join our Telegram channel

Full access? Get Clinical Tree


