Fig. 5.1
Imaging with fast voltage sensitive dyes allows simultaneous recording of the individual action potentials generated by large numbers of neurons. (a) Conventional sharp electrode intracellular recording of the Tritonia swim motor program. A 1 s 10 Hz stimulus to Pedal Nerve 3 triggered a five cycle swim motor program, recorded in the C2 and DSI interneurons of the swim central pattern generator. Experiments using sharp electrodes are typically limited to recording 3–4 neurons simultaneously. (b) Optical recording from the dorsal pedal ganglion of the Tritonia swim motor program, after processing with Independent Component Analysis, showing 41 of the 63 neurons detected. A 2 s 10 Hz stimulus to Pedal Nerve 3 was used to trigger this five cycle motor program, which was recorded with a RedShirtImaging NeuroPDA-III 464 photodiode array and the fast absorbance voltage sensitive dye RH155
It has been three decades since fVSDs were first used to monitor the simultaneous firing of multiple individual neurons (Grinvald et al. 1977; Salzberg et al. 1977). While most such studies have used invertebrate preparations, particularly those with large neurons whose action potentials fully invade the soma (Boyle et al. 1983; London et al. 1987; Cohen et al. 1989; Zecevic et al. 1989; Nakashima et al. 1992; Wu et al. 1994; Nikitin and Balaban 2000; Zochowski et al. 2000a; Brown et al. 2001; Kojima et al. 2001; Frost et al. 2007), a few studies have accomplished this in vertebrate preparations, such as the enteric nervous system ganglia (Neunlist et al. 1999; Obaid et al. 1999; Vanden Berghe et al. 2001; Schemann et al. 2002). See (Hill et al. 2014) for a recent review of VSD imaging in small neuronal networks.
Given the enormous potential of optical recording with fVSDs for studying neural networks, why haven’t more laboratories adopted this approach? A key reason is that the optical signals corresponding to action potentials in individual neurons are miniscule—often ranging from .001 to less than .0001 of the resting light level—making their detection quite challenging. Another reason is the difficulty of combining high resolution imaging with intracellular recording from multiple neurons. Although such combined methodology would be highly useful for circuit mapping, the light-efficient compound microscopes used for imaging lack stereopsis, making integrating multiple intracellular electrodes so difficult that few bother. Ideally, one could penetrate and drive a known neuron, image its followers, and then penetrate those followers with a second electrode to test for a direct synaptic connection (Taylor et al. 2003). A third difficulty with using optical recording for network studies is that individual detectors often record multiple neurons, yielding mixed signals. Conversely, multiple detectors often record the same neuron, yielding redundant traces. As a result, it can be very difficult to know the number of neurons included in the optical data set.
Fortunately, it is possible to overcome these difficulties. Here we describe procedures for obtaining a satisfactory signal-to-noise ratio using fVSDs, for easier integration of sharp electrodes into imaging experiments, and for the transformation of raw data sets of mixed and redundant traces into new sets containing a single neuron per trace. This discussion is particularly relevant for investigators considering large scale optical recording with fVSDs with single cell resolution, such as is readily achievable in invertebrate ganglia and in certain vertebrate peripheral nervous system preparations. Here we focus primarily on the use of photodiode arrays.
2 Choice of Fluorescence vs. Absorbance Fast Voltage Sensitive Dyes
Fast voltage-sensitive dyes come in two main types: absorbance and fluorescence (Ebner and Chen 1995; Zochowski et al. 2000b). Both change their light response linearly with membrane potential, and do so fast enough to trace out each action potential. Generally speaking, absorbance dyes have been preferred for network studies focused on action potentials. Direct comparisons in the vertebrate brain slice have found absorbance dyes to yield larger signal-to-noise with less phototoxicity than the tested fluorescence dyes (Jin et al. 2002; Chang and Jackson 2003). Two such absorbance dyes, RH155 and RH482, have been applied to preparations ranging from invertebrate ganglia (Yagodin et al. 1999), to vertebrate slice (Senseman 1996; Momose-Sato et al. 1999; Yang et al. 2000), to cell culture preparations (Parsons et al. 1991). We have similarly used both dyes successfully in Tritonia and Aplysia. Recently, fast fluorescent dyes have been developed that have lower phototoxicity and other desired qualities than previous dyes (for example, see (Obaid et al. 2004; Carlson and Coulter 2008; Miller et al. 2012)). We have not yet tried these on our invertebrate preparations.
3 Choice of Imaging System
Most imaging systems employ either a camera or photodiode array. Both designs operate as a spatial array of independent sensors that convert light to voltage, with the entire array sampled at a fixed frequency. Two systems we have tried by RedShirtImaging are the NeuroCMOS-SM128 camera and the NeuroPDA-III photodiode array. The CMOS-SM128 has 16,384 independent sensors arranged on a 128 × 128 chip, with the full set sampled at 2,500 Hz. Using the RedShirtImaging Neuroplex software, the data can be viewed either as a camera image of the preparation at different points in time, with pixel color or grayscale brightness indicating the membrane potential of that location, or as a set of up to 16,384 V traces (one trace per pixel). The latter can be spatially averaged using either grid-based binning or user-outlined regions of interest, such as single neurons. By contrast, the RedShirtImaging NeuroPDA-III is organized as a hexagonal array of 464 sensors (Fig. 5.2), with the full set sampled at 1,600 Hz. The PDA data are shown as miniature traces organized on screen in the positions of the diodes that recorded them. Because the PDA does not have the spatial resolution to form a useful image, the 464 miniature traces are superimposed on an image of the preparation taken by a digital camera that is also used to focus the PDA on the neurons of interest. As with the camera system, diodes can be selected individually or in groups for display of their recorded voltage traces, raw or filtered, individual or spatially averaged, in a separate window in Neuroplex (Fig. 5.3).
Fig. 5.2
How the RedshirtImaging NeuroPDA-III sees and displays the data. (a) Hexagonal face formed by the ends of the bundle of 464 fiber optics upon which the image of the preparation is focused. The other ends of these fiber optics are individually glued to their corresponding diodes of the 464 photodiode array. (b) Depiction of an RH155-stained Tritonia pedal ganglion focused onto the array input port. Individual neurons of many different sizes are evident. The largest neurons will be recorded by up to several dozen photodiodes, leading to redundancy in the recordings, while the smallest will be detected by just one or two photodiodes. (c) Data display in Neuroplex. As soon as the data are acquired, Neuroplex displays them as miniature traces organized according to the position of each acquiring diode in the array. Shown is a 35 s optical recording of a swim motor program, obtained from a different preparation than the one photographed in panel (b). Nearly 50 diodes detected a single large neuron located in the upper right portion of the array. Clicking on specific traces expands them in a separate window in Neuroplex (see Fig. 5.3)
Fig. 5.3
Superimposing an image of the preparation with the diode array makes it easy to inspect the firing of different neurons. The left panel shows an image of the dorsal surface of the pedal ganglion, superimposed in Neuroplex with a display of the 464 acquired optical traces in their corresponding diode positions (green lines). The right panel shows how clicking on diodes of interest displays their optical data. These are filtered, unaveraged recordings from single diodes, each showing the firing recorded from the indicated ganglion location. A five cycle swim motor program was elicited by a 10 Hz, 1 s, 10 V stimulus to Pedal Nerve 3, delivered at the arrow
Cameras and photodiode arrays have different strengths and weaknesses. Cameras such as the CMOS-SM128 have sufficient pixel density to provide a recognizable image, which simplifies focusing the imager and determining which regions and/or neurons gave rise to the recorded signals. On the negative side, the camera’s larger sensor number leads to file sizes approximately 50× larger than those acquired by the PDA for the same recording duration. Another difference regards the sensitivity of the two types of systems. While both systems digitize the data with 14 bit resolution (the CMOS system in the camera, the PDA via an A/D board in the computer), the NeuroPDA-III gains nearly seven additional bits of effective resolution by first AC-coupling each trace to subtract the resting light level, and then amplifying it by 100× before digitization. This makes PDAs more suitable for detecting the smaller signals provided by absorbance dyes if digitization resolution is a limiting factor, a point made by several others (Sinha and Saggau 1999; Vanden Berghe et al. 2001; Kosmidis et al. 2005). It is worth noting, however, that AC-coupled PDAs are unsuited for studies of slow events, such as slow EPSPs. The majority of our remaining discussion concerns our experience with the NeuroPDA-III.
4 Two Microscope Designs for Optical Recording
We use two different microscope designs, depending on the degree to which intracellular electrodes will be used in the experiment. In both systems (Fig. 5.4), the microscope is mounted on an EXFO-Burleigh motorized translator attached to a Burleigh Gibraltar stage that provides a large stable platform for mounting the manipulators, recording chamber, suction electrodes, bath ground, bath temperature probe, optional epi-illumination, perfusion tubes, and cooling system used in our Tritonia or Aplysia experiments. The translator allows penetration of a neuron in one ganglion, and then subsequent movement of the microscope and PDA without disturbing the impalement, in order to optically record from neurons in other ganglia that are affected by spike trains driven in the impaled neuron.
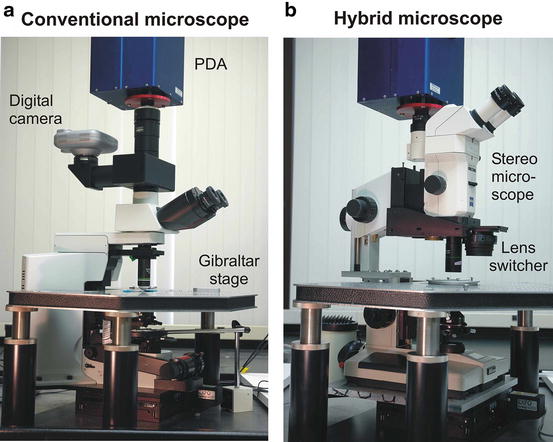
Fig. 5.4
Two microscope designs used for imaging. (a) For experiments involving minimal-to-no conventional intracellular recording we use a standard compound microscope. A parfocal digital camera is used to focus the PDA, and to provide a picture of the preparation to superimpose with the array data. (b) For experiments involving significant intracellular recording with the imaging we use a custom microscope consisting of the lower half of a compound microscope, to provide the bright transillumination needed for absorbance fVSDs, mated to and optically aligned with a stereomicroscope. A linear sliding lens switcher is used to alternate between a 0.6 NA 20× objective for the imaging, and a parfocal stereomicroscope objective for penetrating neurons with sharp electrodes. During experiments the imaging lens is fitted with a custom water immersion cap to eliminate image movement related to surface ripples. Both microscopes are mounted on motorized translators to allow the viewing/imaging area to be changed without disturbing impaled neurons. During experiments, the upper superstructure is further stabilized by inserting two foam-topped posts between the Gibraltar platform and the front corners of the lens switcher. A digital eyepiece camera is used with this microscope to obtain the images of the preparation to be superimposed with the array data
4.1 Conventional Compound Microscope
Once vibration-related noise is sufficiently minimized, the signal-to-noise ratio is proportional to the square root of the light level (Zochowski et al. 2000b). Therefore, imaging is traditionally done using conventional compound microscopes, whose high NA objectives are much more light-efficient than those of stereomicroscopes. We use an Olympus BX51WI microscope, which was designed specifically for electrophysiology. Our lenses of choice are the Olympus XLUMPLFL20xW 0.95NA and XLUMPLFL10xW 0.6NA water immersion objectives. In Tritonia ganglia transilluminated with a 100 W, 12 V tungsten-halogen lamphouse and 0.9NA condenser, these lenses provide saturating light levels to the PDA with the lamp power set to slightly above half-maximum. High efficiency optics are important because they permit lower illumination intensities, translating to slower dye bleaching, lower phototoxicity concerns, and longer imaging time. With this microscope and optics we can obtain several 120 s acquisitions at near-saturating light levels for the PDA before dye bleaching begins to degrade the action potential signals. We have recently begun using a high power 735 nm LED light source (Thor Labs M735L2-C1) to transilluminate the preparation, driven with a DC power supply (Thor Labs DC2100). This stimulator-controlled illumination method avoids the need for both a bandpass optical filter and an electromechanical shutter, the latter of which can introduce unwanted vibrations that can potentially add artifact signals to the imaging data.
4.2 Custom Hybrid Microscope
Despite their advantages, conventional compound microscopes lack stereopsis, making it difficult to incorporate multiple intracellular electrodes into imaging experiments. This is a major hindrance for many potential uses of optical recording, such as circuit mapping, where one would like to locate and immediately penetrate specific neurons identified in the optical recordings. Another aim is to drive a known neuron with one intracellular electrode while imaging its follower neurons, and then penetrate those with a second intracellular electrode. To carry out such experiments, we constructed a hybrid microscope that combines desirable features of both stereo and conventional compound microscopes.
We began by cutting off the top of a Nikon Optiphot microscope and then mounted a Zeiss SV-11 stereomicroscope onto a vertical post bolted to its stump. This allows the preparation to be viewed through the stereo objective, with the full depth perception necessary to penetrate specific neurons with intracellular electrodes. At the same time we retained the compound microscope’s lamphouse and condenser, to deliver maximum light to the preparation for imaging. A key part of this design is the linear sliding lens switcher (Combizoom 400, Kramer Scientific), which allows the user to alternate between a high numerical aperture (NA) objective for imaging and a conventional parfocal stereomicroscope objective for impaling neurons. This hybrid microscope design has been described in detail in a separate publication (Frost et al. 2007).
While the ability to integrate multiple intracellular electrodes into optical recording experiments is a big plus, the hybrid microscope has certain disadvantages compared with the traditional compound microscope. First, light transmission is lower through the zoom optics of the stereomicroscope body, requiring delivery of brighter illumination to the preparation to achieve adequate signal-to-noise ratios. To get sufficient illumination, we power a traditional 12 V 100 W tungsten halogen bulb with a 16 V racing car battery stepped down to 14.5 V. This has the advantage of true DC power, and hence no ripple in the light to the imager. However, the brighter light comes at the cost of faster photobleaching and thus less imaging time per experiment (four to five 35 s acquisitions vs. several 120 s acquisitions with the conventional compound microscope setup). Second, the method of hanging the stereomicroscope and PDA from the rear post leads to increased vibration-based noise in the optical recordings. We minimize the vibration by inserting support posts beneath the front of the lens switcher, effectively supporting the microscope in three places. This design has greatly facilitated our use of multiple intracellular electrodes during imaging experiments. With intracellular recording comes the need to expose preparations to light while positioning electrodes and penetrating neurons. To avoid bleaching the fVSD while working with intracellular electrodes, we illuminate the preparation through a green filter that blocks the red wavelength used for imaging with RH155.
5 Correlating Optical Signals with Specific Neurons in the Preparation
Because of its poor spatial resolution, a PDA doesn’t provide a useful image—its frame view mode looks like a hexagonal checkerboard of grayscale squares, corresponding to the brightness recorded by the different diodes at one point in time. Therefore, identifying the neurons the data are coming from is more difficult with a PDA than with camera-based imagers, which have much higher spatial resolution. To do this, we take a picture of the preparation and superimpose it in Neuroplex with a diode map linked to the optical data. Clicking on any diode/neuron then displays the optical data recorded at that location (Fig. 5.3). The image superimposition involves a three step procedure:
During experiments with the PDA, the focus point for the imaging is set using the live image provided by the microscope camera used to take the superimposed photograph. To ensure that the PDA and camera are parfocal, we focus the camera on a calibration slide containing a black circle, and then adjust the focusing collar under the PDA so that the circle’s edge shows the most abrupt black-to-white transition on the checkerboard pattern provided by the PDA. An alternative focusing method is to remove the PDA from its photoport and place a ground glass surface at the exact position the array face normally sits. Adjustments are then made to bring this image and that seen by the camera into parfocality. A third method is suggested by (Obaid et al. 2004), who used a custom microscope photoport component which, when slid into place, provides a direct view of the preparation image focused onto the photodiode array face.
When using sharp electrodes in combination with imaging, ganglia are surgically desheathed to allow easy penetration of the neurons. However, such preparations tend to be less planar than when sheathed, with the result that photographs taken through the objective lens will have just a portion of the surface neurons in focus. To obtain a clear picture of the entire visible ganglion surface to superimpose with the PDA data one can take a stack of several images at different focus depths and then combine them into a single in-focus image using additional software, such as the fast focus enhancement feature of Rincon (Fig. 5.5; ImagingPlanet, Goleta, CA). When working with sheathed preparations, we typically image through a coverslip fragment pressed down on the ganglion, which flattens it further. This has the dual advantages of yielding more in-focus neurons, and also a higher yield of optically recorded neurons (see Sect. 6.5).
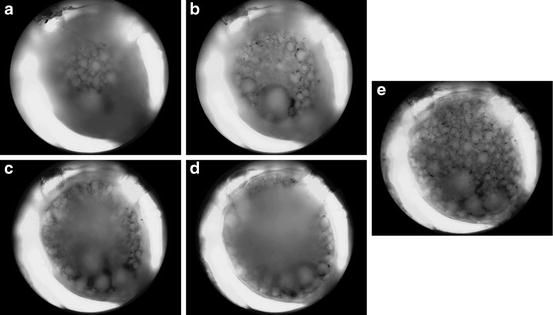
Fig. 5.5
Use of software to obtain a single in-focus image to superimpose with the photodiode array data. In order to obtain a suitable picture of the highly convex Tritonia ganglion surface to superimpose with the array data in Neuroplex during experiments, we use software that combines the in-focus portions of several images taken at different focus positions, while discarding the blurred areas. (a) Uppermost surface of the sheathed Tritonia dorsal pedal ganglion. (b) Focused 100 μm lower. (c) 200 μm lower. (d) 300 μm lower. (e) Combination of 13 images taken at 25 μm intervals, showing all neurons visible on the ganglion surface
In order to correlate the imaging data with specific neurons, the above photograph must be precisely superimposed with the diode map. To do this, we collect both a camera picture and PDA readings of the light shining through three closely spaced pinholes in a foil sheet. The magnification and position of the camera image is then adjusted in Neuroplex until it exactly overlies the PDA image of the pinholes, rotating the PDA as needed, after which it is locked into position. In subsequent experiments these same coordinates can then be used to accurately superimpose the camera image of the preparation on the array data.
Related posts:
 Optical Imaging of Cardiac Action Potential
 Voltage Imaging in the Study of Hippocampal Circuit Function and Plasticity
 Genetically Encoded Protein Sensors of Membrane Potential
 Second Harmonic Imaging of Membrane Potential
 Two-Photon Excitation of Fluorescent Voltage-Sensitive Dyes: Monitoring Membrane Potential in the Infrared
Stay updated, free articles. Join our Telegram channel

Full access? Get Clinical Tree


