. The polarization can then be approximated as a Taylor series, i.e.
This power-series expansion of the nonlinear polarization says nothing about the underlying physical processes, but it accurately predicts the general classes of nonlinear optical phenomena. This is because for sinusoidal time-varying electric fields, multiplication of the fields in the higher order terms of the polarization expansion accurately predicts the array of induced polarization frequencies. For example, for a sinusoidal time-varying electric field containing two distinct frequency components, ω 1 and ω 2, the term E 2 leads to second-order polarization terms at frequencies 0,  ,
,  , 2ω 1, and 2ω 2. Macroscopically, these polarization components at different frequencies are responsible for the nonlinear optical phenomena observed experimentally. Second-order effects (due to χ (2)) include second harmonic generation (SHG), sum- and difference-frequency generation, and optical rectification (
 , a static electric field). Third-order effects (due to χ (3)) include third harmonic generation, multi-photon absorption, and stimulated Raman scattering.
, , 2ω 1, and 2ω 2. Macroscopically, these polarization components at different frequencies are responsible for the nonlinear optical phenomena observed experimentally. Second-order effects (due to χ (2)) include second harmonic generation (SHG), sum- and difference-frequency generation, and optical rectification (, a static electric field). Third-order effects (due to χ (3)) include third harmonic generation, multi-photon absorption, and stimulated Raman scattering.Although two-photon excitation of fluorescent molecules and SHG both lead to the production of photons with shorter wavelength (higher energy) relative to the incident radiation field, it is important to note some key differences. Most importantly, in SHG (described in detail in Chap. 19), photon energy is conserved (Fig. 17.1, right), whereas in two-photon absorption (TPA), photon energy is transferred to the molecule (Fig. 17.1, left). The dotted lines in Fig. 17.1 represent “virtual states,” or excited electronic states in which an electron can reside for a duration  , by the time-energy uncertainty principle; here ΔE is the energy difference between the virtual state and the nearest molecular eigenstate. Physically, therefore, SHG is a scattering event (hyper-Rayleigh scattering) and the resultant signal propagates largely in the direction of the excitation beam. TPA, on the other hand, involves absorption of photon energy followed by fluorescence emitted roughly isotropically. Furthermore, SHG requires a non-centrosymmetric material geometry for production, which may be realized, in practice, by the insertion of a SHG contrast agent (dye) into only one leaflet of the cell membrane bilayer (Moreaux et al. 2003; Pons et al. 2003; Dombeck et al. 2005; Nuriya et al. 2006; Teisseyre et al. 2007). Finally, the emission spectrum for TPA-induced fluorescence is typically identical to the one-photon emission spectrum, whereas the SHG signal is always exactly half of the excitation wavelength (twice the frequency) (Fig. 17.1, right).
, by the time-energy uncertainty principle; here ΔE is the energy difference between the virtual state and the nearest molecular eigenstate. Physically, therefore, SHG is a scattering event (hyper-Rayleigh scattering) and the resultant signal propagates largely in the direction of the excitation beam. TPA, on the other hand, involves absorption of photon energy followed by fluorescence emitted roughly isotropically. Furthermore, SHG requires a non-centrosymmetric material geometry for production, which may be realized, in practice, by the insertion of a SHG contrast agent (dye) into only one leaflet of the cell membrane bilayer (Moreaux et al. 2003; Pons et al. 2003; Dombeck et al. 2005; Nuriya et al. 2006; Teisseyre et al. 2007). Finally, the emission spectrum for TPA-induced fluorescence is typically identical to the one-photon emission spectrum, whereas the SHG signal is always exactly half of the excitation wavelength (twice the frequency) (Fig. 17.1, right).Fig. 17.1
Jablonsky energy level diagram illustrating one- and two-photon absorption processes followed by fluorescence (left) as well as second harmonic generation (right). S0 is the ground state, S1 and S2 are excited states. The multiple lines at each state represent different vibrational energy levels. ω 1 is the angular frequency of a photon at the peak of a one-photon absorption resonance,  , and
, and  J s. The dotted lines allude to virtual states not associated with an absorption resonance per se
, and J s. The dotted lines allude to virtual states not associated with an absorption resonance per se 2.2 The Two-Photon Absorption Cross-Section
The third-order susceptibility, χ (3), allows for nonlinear polarization contributions at the same frequency as the incident light, thereby leading to an intensity-dependent index of refraction. The rate of absorption, R, which in the linear case is proportional to I via the one-photon absorption cross-section, σ 1, i.e.  , is now proportional to an intensity-dependent cross-section,
  , and
, and  , where Σ is the two-photon absorption (TPA) cross-section.
, is now proportional to an intensity-dependent cross-section, , and , where Σ is the two-photon absorption (TPA) cross-section.The informal unit for Σ is the Göppert-Mayer (GM), where 1 GM = 10−50 cm4 s photon−1. Σ is described as a “cross-section” in order to establish a two-photon analogy to the linear (one-photon) absorption cross-section, which has true units of area. The extra factor of cm2 is due to the extra factor of I in the nonlinear index of refraction. The two-photon excitation (TPE) cross-section, σ2 is the product of Σ and the two-photon quantum efficiency, q 2, defined as the number of emitted photons by the molecule per pair of absorbed photons, i.e.  . In two-photon microscopy the measured signal is typically fluorescence emission, and therefore σ 2 is generally a more useful quantity than Σ.
. In two-photon microscopy the measured signal is typically fluorescence emission, and therefore σ 2 is generally a more useful quantity than Σ.2.3 Two-Photon Cross-Section Measurements
Xu and Webb (1996) modeled the TPA-induced fluorescence excited by focused, ultrafast mode-locked laser sources, and used this model to extract two-photon cross-sections for a variety of compounds. Because this method for extracting the cross-sections requires accurate characterization of both the spatial and temporal profiles of the excitation volume as well as the detection efficiency, Albota and colleagues (1998) introduced a ratiometric measurement technique, wherein many of these error-prone quantities cancel out. Using this method, σ 2 of an unknown sample is deduced from identical measurements made on a reference sample with known values of σ 2. Using this approach the two-photon excitation cross-section, σ 2S , of an unknown sample is
 where the subscripts S and R indicate “sample” and “reference,” respectively, φ is the emission collection efficiency of the spectroscopic system, C is the concentration (cm−3), 〈P(t)〉 (photons s−1) is the time-averaged illumination power, 〈F(t)〉 (photons s−1) is the time-averaged fluorescence signal, and η is the sample index of refraction. This equation is valid only when there is no simultaneous one-photon fluorescence, and care should be taken to avoid misinterpreting mixed one- and two-photon fluorescence signals (cf. Fisher et al. 2009).
2.4 Two-Photon Cross-Sections of Voltage-Sensitive Dyes
Xu, Albota, Webb, Zipfel and their colleagues performed one of the earliest surveys of two-photon excitation cross-sections for a variety of biologically relevant molecular fluorophores (Xu et al. 1996; Albota et al. 1998; Xu 2000). Their survey included some potentiometric dyes, e.g., DiOC5 (3,3′-dipentyloxacarbocyanine iodide) (Cohen et al. 1974). Those probes were molecules that provide “slow,” redistribution-based optical measures of membrane voltage (Cohen et al. 1974; Cohen and Salzberg 1978). Fisher and colleagues (Fisher et al. 2005) produced the first survey of near-infrared TPE cross-sections for a series of nine “fast,” membrane bound VSDs (Cohen and Salzberg 1978) (structures shown in Fig. 17.2). TPE cross-section spectra from this work are reproduced in Fig. 17.3. In general, two-photon absorption is strongest at wavelengths approaching twice the peak of the one-photon absorption wavelength. RH 795, RH 414, RH 421, di-8-ANEPP dyes, and Merocyanine 540, all blue-green-absorbing dyes, exhibit increases of more than an order of magnitude as the excitation wavelength varies from 790 to 960 nm. Interestingly, TPE cross-sections for di-8-ANEPPDHQ, a chimera constructed from the potentiometric dyes RH795 and di-8-ANEPPS (Obaid et al. 2004), are nearly double those of its constitutive components over the entire tuning range (Fig. 17.3).
Fig. 17.2
Chemical structures for the voltage-sensitive dyes discussed in this chapter
Fig. 17.3
Log-scale plots of two-photon excitation (TPE) cross-sections of voltage-sensitive dyes. Values of σ 2 are plotted in units of 10−50 cm4 s photon−1 (GM) as a function of excitation wavelength (nm). The TPE spectrum for di-3-ANEPPDHQ, discussed in detail in this chapter, is highlighted in red. The cross-section measurements utilized a Mira Basic mode locked Ti:Sapphire laser (Coherent Inc, Santa Clara, CA, USA) which required two optics sets to span the wavelength range investigated. Circular markers: mid-wavelength optics set (790–900 nm); triangular markers: long-wavelength optics set (900–960 nm). Systematic error for σ 2 is ±30 % for each point
3 Optical Considerations for Measurements in Thick Specimens
3.1 TPE Excitation Volume
The lateral and axial dimensions of the focal volume can be calculated from high numerical-aperture formulations of the illumination point spread function (IPSF) (Richards and Wolf 1959) which is the three-dimensional illumination intensity distribution. Since two-photon excitation is proportional to the square of the excitation intensity, measures of the lateral and axial widths of the two-photon illumination point spread function (IPSF2) such as FWHMs and 1/e widths of Gaussian fits to the IPSF2 function are effective measures of lateral and axial resolution (Zipfel et al. 2003). For the case of an over-filled 0.95 NA objective at 850 nm excitation, assuming the refractive index of the sample is ~1.4, the lateral and axial 1/e diameters (which are greater than the FWHM) are ~0.4 and ~1.8 μm, respectively.
The optical sectioning ability of two-photon microscopy relies primarily on the improbability of two-photon absorption. While the quadratic excitation intensity dependence described above facilitates significantly enhanced imaging resolution, these gains can be diminished if the TPE rate is high enough to cause fluorophore saturation within the focal volume. As a third-order nonlinear optical process, relatively high excitation intensity is typically required to generate TPE. Ultrafast pulsed (i.e. femtosecond-scale pulse width) lasers, however, achieve peak illumination power several orders of magnitude higher than average output. Even with an unfocused beam, current commercial Ti:Sapphire lasers (peak pulse power ~100 kW) can generate significant TPE in materials with appreciable (e.g. >10 GM) TPE cross-sections. In fact, Hell and colleagues (1998) have reported TPE fluorescence imaging of some biological samples utilizing purely CW laser excitation, albeit at relatively high excitation intensity.
Functional TPE imaging of small optical signals (e.g., from VSDs), in particular, can easily lead to near-saturation conditions. This is because small fractional fluorescence changes (ΔF/F) necessitate high baseline fluorescence in order to overcome shot noise. Besides possibly expanding the focal volume, high levels of fluorescence near, but outside, the focal plane can effect a reduction in functional recording signal-to-noise by adding shot noise-contributing background fluorescence without (necessarily) constructively adding function-related ΔF/F signal.
The time-averaged two-photon fluorescence signal  detected by an imaging system with collection efficiency φ and utilizing mode-locked laser sources with time-averaged illumination power 〈P(t)〉 is
 Here C is the concentration of fluorophores in the sample (cm−3), f is the repetition rate of the pulsed laser, τ is the laser pulse width, g p is a numerical constant of order unity, λ is the center wavelength of the laser pulse, and n is the real part of the linear index of refraction of the sample (Xu and Webb 1996). Thus, in addition to illumination focus geometry, the TPE fluorescence rate, on which the technique’s high resolution depends, is also a function of excitation intensity, fluorophore concentration and TPE cross-section. In practice, high concentrations of bulk-loaded exogenous dyes (such as VSDs) can lead to a reduction of functional signal-to-noise ratio by adding background fluorescence. Further, the consequent high rate of fluorescence can lead to an “apparent” expansion of the focal volume via saturation of the detection device. To avoid these pitfalls, the dye concentration and excitation laser intensity should, therefore, be kept low enough (typically <100 μM for compounds having TPE >5 GM, and <30 mW, respectively), given the application-specific integration time.
detected by an imaging system with collection efficiency φ and utilizing mode-locked laser sources with time-averaged illumination power 〈P(t)〉 is3.2 Penetration Depth and Resolution in Scattering Media
Biological tissues are relatively transparent to near-infrared light. While some small amount of absorption by tissue and exogenous compounds does still occur, scattering is typically the dominant interaction. Each scattering event will alter the direction of propagation slightly; after multiple scattering events, however, photons will be observed to diffuse randomly through these media. The degree to which a material scatters light can be quantified by the scattering coefficient, μ s (cm−1), which is a measure of the scattering cross-section (cm2) per unit volume (cm3) of the medium. A related, and more intuitive quantity is the reduced scattering coefficient,  , where g is the average cosine of the scattered angle. The “mean free path,” equivalent to the random walk step size, is
  (cm). Bulk values of
  for human cortex in vivo have been measured experimentally, and are roughly 1.1–1.2 mm at 956 nm (Bevilacqua et al. 1999).
, where g is the average cosine of the scattered angle. The “mean free path,” equivalent to the random walk step size, is (cm). Bulk values of for human cortex in vivo have been measured experimentally, and are roughly 1.1–1.2 mm at 956 nm (Bevilacqua et al. 1999).TPE microscopy requires both efficient two-photon excitation and efficient detection of the emitted fluorescence signal; scattering and, to a lesser extent, absorption, are detrimental to both of these requirements. A nominally focused beam of near-infrared light will exhibit degraded focus at increasing tissue penetration depth. This is because scattering reduces the proportion of ballistic (i.e. unscattered) photons exponentially as a function of focal depth (Dunn et al. 2000), reducing the peak excitation intensity at the focal point and increasing the relative proportion of TPE due to scattered light (Theer et al. 2003). This re-shaping of the excitation beam focal profile imposes a slight numerical aperture (NA) dependence on the TPE efficiency (a dependence which also varies with imaging depth) (Dunn et al. 2000; Oheim et al. 2001).
When using mode-locked lasers, one strategy to overcome this loss of power is to increase the peak pulse power (at the expense of repetition rate) using a regenerative amplifier (Oheim et al. 2001; Theer et al. 2003). While higher pulse power increases both the TPE due to ballistic and non-ballistic photons, neither models nor experiments have shown large changes in imaging resolution as a function of imaging depth, even at depths beyond the mean-free-path length (Dunn et al. 2000; Theer et al. 2003). For functional two-photon imaging, a practical definition of “maximum imaging depth” therefore depends not only on the optical parameters of the microscope and tissue, but on the functional intensity changes expected.
4 VSD Two-Photon Action Spectra
The physical mechanisms underlying optical changes exhibited by fast potentiometric dyes are not yet completely understood. Very generally, the two main categories of proposed physical mechanisms involve (1) a voltage-dependent reorientation of the dye molecules within their phospholipid-membrane environment resulting in dimer formation (Dragsten and Webb 1978), and (2) a voltage-dependent shift of the dyes’ electrical resonances (molecular Stark effect; electrochromism) (Waggoner 1979). “Slow” dyes exhibit Nernstian accumulation, followed by aggregation or binding (Sims et al. 1974). While some spectroscopic studies have described hemicyanine dyes that appear to display predominantly Stark-effect related voltage sensitivity (Kuhn and Fromherz 2003; Fromherz et al. 2008), a combination of multiple physical mechanisms seems likely for some other dyes (Loew et al. 1985; Fromherz and Muller 1993; Clarke et al. 1995).
The voltage-dependent optical changes displayed by VSDs include both shifts in spectra as well as changes in quantum yield. Thus, in an ideal experiment one would continuously monitor the absorption and emission spectra of each image pixel. In practice, however, this is generally unrealistic because it requires a highly versatile illumination system as well as a superbly efficient and fast spectral detector. The most common compromise is to excite fluorescence and detect emission at carefully selected, fixed wavelengths. Using fixed-wavelength excitation and detection, the choice of these wavelengths is, theoretically, based on an understanding of the particular dye’s voltage-dependent spectral shifts and changes in quantum yield. Unfortunately, as of the time of writing, these properties have only been measured for a select few dyes (e.g. Dragsten and Webb 1978; Clarke et al. 1995; Foley and Muschol 2008). In light of this incomplete understanding, a popular strategy is to detect fluorescence from a wide wavelength region of high emissivity, while exciting at a relatively narrow wavelength band centered at a point of steep incline on the absorption spectrum. Monochromatic laser illumination, then, required for TPE microscopy, is the ideal manifestation of this excitation scheme.
Based upon the TPE cross-section measurements (Fig. 17.3), some of the most promising candidates for TPE fluorescence measurement of changes in membrane voltage are currently the naphthylstyrylpyridinium dyes of the di-n-ANEPPDHQ type (Obaid et al. 2004). Figure 17.4 shows one- and two-photon action spectra for this dye (Fig. 17.4b), which plot ΔF/F responses to identical electrical stimuli, applied to the intact neurohypophysis, as a function of excitation wavelength with the emission detection wavelength range held constant. Comparing the excitation and action spectra (Fig. 17.4a, b, respectively) for both one- and two-photon modes, two trends can be noted. First, the biphasic nature of the one-photon action spectrum derives from a stereotyped shifting of the excitation peak. In response to depolarization, the absorption spectrum of di-3-ANEPPDHQ is blue-shifted. The zero-crossing point on the one-photon action spectrum, then, represents an excitation wavelength which, after the spectral shift, corresponds to approximately voltage-independent excitation efficiency. Second, while the data points have larger errors, the two-photon action spectrum’s general downward trend and, more clearly, the polarity of the ΔF/F response are in agreement. This suggests that, at least for the di-n-ANEPPDHQ compounds, one-photon action spectra may be used to predict general features of their two-photon counterparts.
Fig. 17.4
Excitation, emission, and action spectra for di-3-ANEPPDHQ. (a) Absorption/excitation spectra (dark blue/light blue) plotted alongside fluorescence emission excited at two wavelengths (dark red: 530-nm excitation; light red: 425-nm excitation). The fluorescence excitation curve (light blue) measures emission at 610 nm as a function of excitation wavelength (arbitrary units). (b) S/N of 2-photon excited fluorescence signals as a function of excitation wavelength in single-trial optical recordings of action potentials (n = 10). The red error bars represent standard deviation; blue bars represent standard error. S/N has been defined here as the amplitude of the evoked signal (peak-to-peak) divided by the RMS noise, which is calculated from data recorded before the stimuli were delivered (i.e., 50 ms before). (c) Comparison of 1- and 2-photon action spectra. 1- and 2-photon action spectra for di-3-ANEPPDHQ are expressed as ΔF/F. Note that the 2-photon action spectrum is shown on a different scale (top axis) for wavelength comparison
Compared with the one-photon action spectrum, the two-photon data points have relatively large errors (Fig. 17.4c). This emphasizes a general difference between the two modes of excitation: for synchronous electrical activity in membrane areas larger than the two-photon excitation volume (or, for global changes occurring in small features), the relative signal amplitude in two-photon recording (ΔF/F) is compromised by the reduced spatial signal averaging. For the one-photon action spectra data points here, the smaller errors reflect the fact that those optical responses were measured from the entire neurohypophysis and, as such, represent the virtually synchronous firing of hundreds of thousands, if not millions of terminals.
For TPE microscopy, then, signal-to-noise ratio (S/N) is generally a more relevant experimental parameter than ΔF/F. To this end, it should be noted that the S/N is proportional to ΔF/F and the square root of the two-photon excitation cross-section, σ 2, i.e.  . A plot of S/N versus excitation wavelength for di-3-ANEPPDHQ is shown in Fig. 17.4b.
. A plot of S/N versus excitation wavelength for di-3-ANEPPDHQ is shown in Fig. 17.4b.5 Illustrative Application: Two-Photon Recording of Action Potentials in Mammalian Nerve Terminals
5.1 Two-Photon Microscope
Two-photon imaging and recording was performed with the custom-built microscope illustrated in Fig. 17.5. The excitation source was a mode-locked Titanium:Sapphire (Ti:Al2O3) laser (Chameleon, Coherent Inc., Santa Clara, CA, USA). Two-photon excited fluorescence was collected in the epifluorescence path by the objective, and redirected to a photomultiplier tube (PMT) using a long-pass dichroic mirror (reflect <700 nm; 90 % reflectance at 700 nm) followed by an interference bandpass emission filter. The dichroic mirror and emission interference filters were from Chroma Technology Corporation (Rockingham, VT, USA). The PMT was an R943 (Hamamatsu Photonics, Hamamatsu City, Japan) operating in analog mode, as the photon flux was typically too high for reliable photon counting. The average excitation power at the sample was adjusted to ~10–20 mW by rotating a λ/2 waveplate placed in front of a Glan–Thompson polarizer (P). The excitation beam was scanned in the sample plane using galvanometer scanning mirrors (Cambridge Technology Inc., Lexington, MA, USA), and scanned along the vertical (illumination) axis using a piezoelectric-driven objective translator (P721, PhysikInstrumente GmbH & Co. KG, Karlsruhe/Palmbach, Germany). The combination of scan lens and tube lens expanded the excitation laser beam and back-filled the microscope objective (20×/0.95 NA XLUMPlanFl, Olympus, Melville, NY). To monitor and correct for fluctuations in the square of the laser power, 〈P(t)〉2, a small fraction of the beam was picked off with a microscope coverslip and focused onto a beta-barium borate (β-BaB2O4, or “BBO”) second harmonic generation (SHG) crystal (Inrad, Northvale, NJ). This SHG signal was then filtered with a BG39 Schott glass absorption filter and detected by a second, auxiliary, PMT (model R955, Hamamatsu Photonics, Hamamatsu City, Japan) also operating in analog mode. Device operations were controlled using custom-written LabVIEW (National Instruments, Austin, TX) code (Fisher 2007). Data (including image) processing was performed using custom Matlab (Mathworks, Natick MA) code. The analog signals from both PMTs were amplified with a wide bandwidth transimpedance amplifier (13AMP005, MellesGriot, Carlsbad, CA) before digitization by the PCI-6052E National Instruments data acquisition board. The voltage outputs from the transimpedance amplifiers were oversampled at 150 kHz, and a number of points corresponding to the integration time were collected and averaged for each sampled point.
Fig. 17.5
Optical apparatus for 2-photon imaging and functional recording. Reproduced from Fisher et al. J. Neurophysiol 2008 fig. 1 with permission
5.2 Absorption and Emission Spectra for di-3-ANEPPDHQ
Di-3-ANEPPDHQ is a more hydrophilic member of the di-n-ANEPPDHQ sequence than di-8-ANEPPDHQ, its di-octyl analogue, and is thus more suitable for staining neurons in situ. Absorption and emission spectra for this dye were measured in a cuvette, using octanol to approximate the environment of the dye when bound to membrane (Sims et al. 1974). Final sample concentrations were ≤100 μM. Absorption measurements were performed with a spectrophotometer (Ocean Optics, Dunedin, FL), and excitation and emission spectra were recorded using a spectrofluorometer (DeltaRAM, Photon Technology International, Birmingham, NJ). These one-photon spectra are all illustrated in Fig. 17.4a.
5.3 Biological Preparation
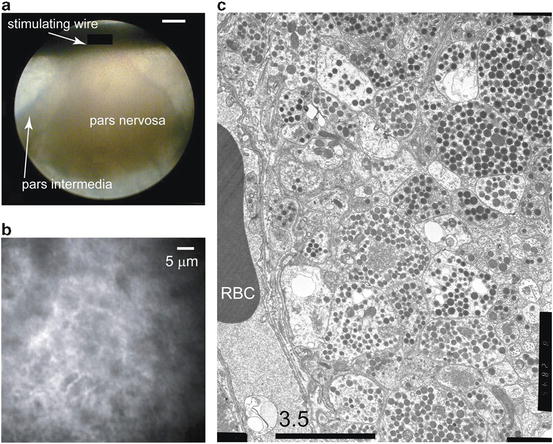
The neurohypophysis (pars nervosa), which together with the pars intermedia compose the neurointermediate lobe of the mammalian pituitary, is an extremely favorable preparation for the demonstration of a wide variety of optical phenomena. It is a neuroendocrine gland that secretes the peptide hormones arginine vasopressin and oxytocin together with their associated proteins, the neurophysins. From the hypothalamus, magnocellular neurons project their axons as bundles of fibers through the median eminence and infundibular stalk, to arborize extensively and terminate in the neurohypophysis. Here, the peptides are released into the circulation by a Ca2+-dependent mechanism (Douglas 1963; Douglas and Poisner 1964). In the rat, some 20,000 neurons give rise to approximately 40,000,000 neurosecretory swellings and terminals, whose membranes make up nearly 99 % of the excitable membrane in this gland (Nordmann 1977). The very large surface-to-volume ratios found in vertebrate neurohypophyses explains the unusually robust extrinsic optical signals that can be recorded from this tissue with impermeant voltage-sensitive dyes (Salzberg et al. 1983; Obaid et al. 1985, 1989; Obaid and Salzberg 1996; Muschol et al. 2003), and the synchronicity with which the action potential (AP) invades hundreds of thousands, if not millions, of terminals explains the large intrinsic optical signals, including light scattering changes (Salzberg et al. 1985; Obaid et al. 1989) and changes in autofluorescence (Kosterin et al. 2005), that are observed in mammals. In the mouse, these neurosecretory terminals range in size from 1 to 10 μm, and their density closely resembles that of cortical tissue.
For the TPE fluorescence measurements of membrane voltage described in this chapter, we removed the neurointermediate lobe from 30- to 60-day-old female CD-1 mice that had been anesthetized by CO2 inhalation and decapitated. The mouse head was pinned to the bottom of a Sylgard-lined dish and, following removal of the skin, the skull was opened along the dorsal midline and the bone removed bilaterally. The optic and olfactory nerves were cut and the brain was deflected caudally, severing the infundibular stalk. The infundibular stump, together with the entire pituitary gland, remained attached to the base of the skull. The gland was then gently removed using iridectomy scissors and fine forceps, and transferred to a dish containing mouse Ringer’s solution (in mM: 154 NaCl, 5.6 KCl, 1.0 MgCl2, 2.2 CaCl2, 10 glucose, and 20 HEPES, adjusted to pH 7.4 with NaOH) where the anterior pituitary (pars anterior) was separated from the neurointermediate lobe and discarded. The pars intermedia, which consists of a delicate lacework of cells cradling the neurohypophysis, provided a convenient support through which the specimen could be pinned to the Sylgard-lined bottom of a shallow chamber, while preserving the integrity of the neurohypophysis (see Fig. 17.6). The tissue was stained by bathing it for 30–60 min in a Ringer’s solution containing ~50 μg/ml (~78 μM) of the VSD di-3-ANEPPDHQ, together with 0.5 % EtOH (used as stock solvent). After staining, the neurohypophysis was washed in mouse Ringer’s solution, which was replaced every 20–30 min to preserve tissue viability. The mouse neurohypophysis preparation is illustrated in Fig. 17.6.
 Optical Imaging of Cardiac Action Potential
 Monitoring Spiking Activity of Many Individual Neurons in Invertebrate Ganglia
 Monitoring Population Membrane Potential Signals from Neocortex
 Monitoring Integrated Activity of Individual Neurons Using FRET-Based Voltage-Sensitive Dyes
 Imaging the Dynamics of Mammalian Neocortical Population Activity In-Vivo
 Second Harmonic Imaging of Membrane Potential


Related posts:
Optical Imaging of Cardiac Action Potential
Monitoring Spiking Activity of Many Individual Neurons in Invertebrate Ganglia
Monitoring Population Membrane Potential Signals from Neocortex
Imaging the Dynamics of Mammalian Neocortical Population Activity In-Vivo
Second Harmonic Imaging of Membrane Potential
Stay updated, free articles. Join our Telegram channel
Full access? Get Clinical Tree
