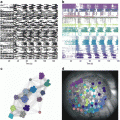
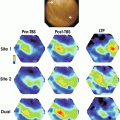
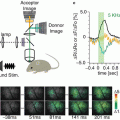
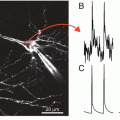
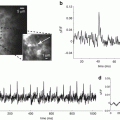
Fig. 12.1
(a) Phase-map of a re-entrant arrhythmia in a perfused sheep left atrium. A phase singularity (circle) can be observed at the center of spiral wave. (b) Corresponding activation map obtained directly from the raw optical signals over one activation cycle (courtesy of R. Dubois)
The ability to monitor electrical activity without direct contact with myocardium makes optical mapping particularly useful for the analysis of the mechanism of electrical defibrillation. Strong electrical shocks utilized for defibrillation can cause severe interference with conventional electrode recordings making such recordings technically challenging. The lack of electrical contact of the optical detector with the tissue completely eliminates this problem.
Among the great successes of optical mapping in defibrillation studies were the experimental demonstration of a “dog-bone” polarization pattern around the unipolar electrode (Wikswo et al. 1995) and quatrefoil reentry patterns (Lin et al. 1999), which were predicted by the bidomain models of electrical defibrillation, but were not previously observed experimentally. The confirmation of theoretical predictions enabled by optical mapping was a triumph of bidomain theory and contributed to its acceptance by the scientific community (see also Chap. 14).
On the other hand, optical mapping studies of defibrillation have also produced multiple unexpected observations, which cannot be readily explained by the conventional bidomain theory. One such effect is the bulk tissue hyperpolarization during strong electrical shocks (Fast et al. 2002). This effect contradicts the observations of symmetric polarization in isolated cardiac myocytes (Knisley et al. 1993) and stirred controversy, which still remains unresolved (Plank et al. 2008). Another paradoxical observation was the anomalously low surface polarization, and the absence of cathodal activation during near-threshold field stimuli (Zemlin et al. 2006; Caldwell et al. 2010). These findings also challenge the conventional bidomain model and await a mechanistic explanation. Additional information on the topic of this chapter can be found in recent reviews (Herron et al. 2012; Efimov and Salama 2012).
2 Optical Mapping of Calcium Transients
An important advantage of optical mapping is that one can use the same experimental setup for monitoring not only the transmembrane potential but also other physiological parameters as long as respective fluorescent indicators are available (Salama et al. 1987). The most common parameter that is being measured concurrently with the transmembrane voltage is the intracellular calcium transient. Effective fluorescent molecular probes sensitive to free intracellular calcium (Tsien 1980) were developed in the early eighties and are being used to study intracellular calcium transients in intact hearts since 1987 (Lee et al. 1987). It is interesting that one of the first applications of the calcium transient mapping was the visualization of excitation propagation in monolayers of cardiac myocytes (Bub et al. 1998). In the monolayers, the maximum ratio of ΔF/F and the signal-to-noise ratio that can be achieved using voltage-sensitive dyes are usually much lower than those with the calcium indicators which makes the latter more convenient to use. It should be noted however that while normally the calcium wave follows the propagation of the depolarization front with a fixed delay, this is not always the case. There are situations when calcium transients are not triggered by the depolarization front and occur independently. This uncertainty with the interpretation of the “propagation patterns” obtained using calcium transient mapping can be readily resolved using simultaneous Voltage (Vm) and calcium mapping.
Simultaneous optical mapping of voltage and calcium was introduced independently by two groups in 2000 (Choi and Salama 2000; Fast and Ideker 2000). Currently such dual mapping is being used extensively to investigate the link between the regulation of intracellular calcium and cardiac arrhythmias. Over time the technical implementation of dual Vm and calcium mapping underwent significant modification. Originally, simultaneous Vm and calcium imaging required two separate photodiode arrays for measuring voltage and calcium. Recently, a new technical approach has been proposed that achieves the same goal with just one high-resolution, fast CCD camera. The new approach utilizes alternating multiple wavelength excitation, custom-designed double-band fluorescence filters, with subsequent de-multiplexing (Lee et al. 2011).
3 Interpretation of Optical Mapping Signals and Limitations of Cardiac Optical Imaging
It is well established that for the majority of voltage sensitive probes currently in use that the fractional fluorescence change is proportional to the transmembrane voltage. Consequently, the optical recordings of voltage-dependent fluorescence look similar to microelectrode recordings of the transmembrane action potential. However, this perception can be often deceptive in particular when the recordings are taken from intact myocardial wall.
Figure 12.2a compares upstrokes of the optically and electrically recorded action potentials recorded from the same spot in a normally beating rat heart. One can see that the electrical recording has a significantly steeper upstroke as compared to that of the optical recording. Another example of an optical recording which would be difficult to interpret in terms of transmembrane potential is illustrated in Fig. 12.2b. It shows a representative single pixel optical recording of the onset of ventricular fibrillation induced by electrical stimulation. The recording was taken from the epicardial surface of a coronary-perfused sheep right ventricular wall. Note a significant upwards shift of the zero line after the onset of arrhythmia. If this shift would have represented the actual membrane depolarization then during the entire duration of the arrhythmia the transmembrane voltage would remain near 0, which would prevent reactivation of the majority of sodium channels as well as a significant portion of calcium channels. As a result one would not be able to observe any stable propagating electrical waves. However, this was not the case. The analysis of the entire data set from all pixels in this particular experiment revealed a well defined propagation pattern consistent with a 3D reentry. It is interesting that the baseline rapidly returns to normal after application of a defibrillation shock suggesting that the baseline shift is unrelated with changes in intracellular/extracellular ionic compositions. An example showing a rapid return to baseline from a different experiment is illustrated in panel c.
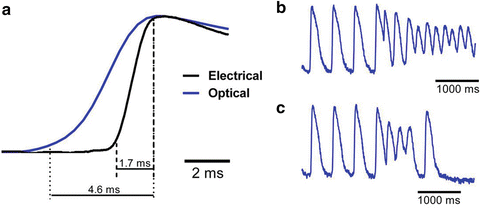

Fig. 12.2
(a) Optical and electrical action potential upstrokes measured at the same location in an isolated rat heart. The optical upstroke is significantly longer than the electrical upstroke. (b) Optical trace of the induction and maintenance ventricular fibrillation in a coronary-perfused sheep right ventricular preparation. (c) Optical trace of a non-sustained ventricular arrhythmia in a coronary perfused sheep right ventricular preparation
The unusual shapes of the optically recorded action potentials illustrated in Fig. 12.2 are the result of the blurring effect caused by light scattering in the tissue. Any optical recordings, even those obtained with infinitely small sensors represent a weighted sum of signals originating in a certain tissue volume, which we call below “integration volume”. The integration volume depends on many factors including the wavelengths of the excitation and fluorescent light, the types of illumination (broad field versus point), the numerical aperture of the lens in front of the detector, the thickness of the myocardial wall, the type of perfusion (blood versus saline) etc. For different experimental settings it can vary from a fraction of 1 mm (Salama and Morad 1976) to as large as ~50 mm3. The largest value corresponds to experiments in large animal hearts (pig, dog) utilizing near-infrared voltage sensitive dyes and broad field illumination.
As the excitation front passes through the interrogation volume, the latter contains cells at different stages of depolarization. The larger the volume, the greater is the range of differences; the greater is the blurring effect. The reduced conduction velocity increases voltage gradient over the unit length increasing the degree of blurring. The latter factor is particularly relevant during high frequency arrhythmia which is usually characterized by significant reduction in conduction velocity. The long duration of the optical upstroke and shift of the zero level during arrhythmias in Fig. 12.2 are both the result of the blurring effect discussed above. In the latter case, in any moment of time during arrhythmia the integration volume contains cells at different stages of depolarization which shifts the average and prevents the signal from going all the way down. The effect is most pronounced in experiments with near infrared voltage sensitive dyes and thick tissue samples characterized by large integration volumes. More detailed discussions on this topic can be found in Chaps. 15 and 16.
3.1 Quantification of Volume Averaging Effects
The interest towards volume averaging effects has emerged with the development of transillumination optical mapping when the light source and the photodetector face opposite surfaces of the myocardial wall (Baxter et al. 2001). The purpose of such transillumination recordings was to glean information about three-dimensional propagation inside ventricular myocardium during reentrant arrhythmias (see Sect. 4.4 below as well as dedicated Chap. 16 in this book). The important feature of fluorescence signals recorded in transillumination mode is that they represent weighted contributions through the entire thickness of the ventricular wall. This study motivated the development of detailed computational models that enabled the prediction of the shape of the optical action potential using a combination of light transport equations with three-dimensional models of electrical propagation (Hyatt et al. 2003; Bernus et al. 2005; Bishop et al. 2006).
One of the major parameters which determines the integration volume is the attenuation length (δ), which characterizes the rate of light decay in the tissue with the distance from the illuminated surface. The value of δ depends on the wavelength of the light, ranging from <0.5 mm for blue-green light to >2 mm for red light (see also Chaps. 15 and 16). Thus, the integration volume is smaller when voltage sensitive dyes with excitation in green part of the spectrum are used as compared to near-infrared voltage-sensitive dyes. The differences are caused by more rapid attenuation of light intensity inside the tissue in the green as opposed to red part of the spectrum.
3.2 Spatial and Temporal Resolution
The blurring caused by volume averaging effect determines the fundamental physical limits of the spatial and temporal resolution of the optical mapping technology. It serves as a low pass filter that suppresses high-frequency components of the voltage sensitive fluorescent signals to a point beyond which it cannot be restored by increasing pixel resolution or frame rate of the detectors. Contemporary optical mapping systems often have sufficiently high pixel resolution and frame rates to reproduce the spectral properties of such, devoid of high-frequency content, fluorescent signals. In many cases one can use heavy spatial and temporal filtering without causing any additional signal blurring (Mironov et al. 2006). Some publications even attempt to propose universal, one size fit all filter parameters (Laughner et al. 2012). It is important, however, that any such recommendation also informs the readers about the limitations and the range of applicability of a given recommendation. The readers should be aware that the appropriate degree of filtering is dependent on specifics of the experimental setup, the spectral characteristics of the dyes etc and should be determined separately when the experimental parameters fall outside the recommended range.
3.3 Motion Artifact
One of the key limitations of optical mapping is the motion artifact caused by myocardial contraction, which can cause significant distortion of the optically recorded action potential. There are rare situations when the motion artifact is not an issue. One such case is optical mapping of long duration ventricular fibrillation (Venable et al. 2010) when generalized contractions are not present and local contractions are very weak. However, the majority of optical mapping studies would not be possible without suppressing the motion artifact.
The most common approach, which is being used to mitigate the motion artifact problem, is the pharmacological elimination of mechanical contractions while preserving the electrical activity. Among those drugs known as electromechanical uncouplers most prevalent are BDM (Liu et al. 1993) Cytochalasin D (Wu et al. 1998) and Blebbistatin (Fedorov et al. 2007). Such drugs can have electrophysiological effects and other limitations (Brack et al. 2013; Lou et al. 2012; Baker et al. 2004; Lee et al. 2001; Swift et al. 2012) which should be taken into consideration when designing the experiments and interpreting the experimental results. There have been multiple attempts to eliminate motion artifact without electromechanical uncouplers by mechanical heart immobilization, ratiometric approaches (Knisley et al. 2000), computational means (Rohde et al. 2005; Khwaounjoo et al. 2015), or a combination of the above. While showing some success, these approaches so far proved having only a narrow range of applicability and have not yet been universally adopted. Resolving the motion artifact problem at the whole heart level remains a major challenge. Finding an effective solution to this problem will remove a significant obstacle to the use of optical mapping in pharmacological studies, where chemical uncouplers are unacceptable due to their potential interference with the tested drug. It may also open the way towards clinical applications of optical mapping such as interventional cardiac electrophysiology.
4 Novel Approaches in Cardiac Optical Imaging
4.1 New Voltage-Sensitive Probes
Since the first pioneer studies utilizing voltage-sensitive dyes (Salama and Morad 1976) there has been slow but significant progress in achieving greater fractional fluorescence, reduced toxicity and phototoxicity, as well as reduced bleaching and internalization rates compared to the original probes. The ΔF/F of the newest styryl dyes (Matiukas et al. 2007) di-4-ANBDQPQ and di-4-ANBDQBS reach 20 %, which is an order of magnitude greater than that of merocyanine-540 used in the original work by Morad and Salama (1976). The new dyes remain effective for hours without a major decay of the voltage-sensitive signal. The time it takes for the voltage-sensitive signal to drop 50 % from its maximum value reaches and sometimes exceeds 2 h (Matiukas et al. 2007) compared to several minutes for early dyes. Importantly, when used in intact tissues, the new dyes show no detectable internalization, photo-bleaching or photo-toxicity (Kanaporis et al. 2012) which significantly simplifies their use. They can be equally well excited in the green and the near-infrared (NIR) parts of the spectrum (Matiukas et al. 2007). The NIR excitation allows the new dyes to be effectively utilized in blood perfused tissues removing one of the important obstacles to clinical applications of optical mapping (Matiukas et al. 2007). This represents a major advantage over dyes with green-blue excitation which cannot be efficiently used in blood perfused tissues because of strong hemoglobin absorption, which significantly reduces the signal in this spectral range.
4.2 Optogenetics
Rather than introducing voltage-sensitive dyes externally, one can make the cell to make its own recombinant proteins that are sensitive to changes in the transmembrane potential. This idea was inspired by the success of GFP-based protein expression markers, which have become indispensible in contemporary cell biology. The first success in the development of voltage-sensitive proteins was achieved in neurobiology (Sakai et al. 2001). However, the voltage response of the protein-based voltage sensors is relatively slow. The frequency response of the fastest and the most recent indicators is limited to 200 Hz, which makes them less attractive for cardiac optical mapping.
4.3 Optical Mapping as a Drug Screening Tool
Since 1993 optical mapping is being used to study electrical propagation and patterned strands of cultured cardiac myocytes (Fast and Kléber 1993), and monolayers of cultured cardiac myocytes (Fast and Kleber 1994). This application proved particularly useful for the analysis of propagation at a single cell level, which would be difficult using conventional electrical recordings. More recently, optical mapping of cardiac propagation in monolayers of cardiac myocytes is being utilized for the analysis of electrophysiological manifestations of the genetic modifications of connexins (Beauchamp et al. 2006) and ion channels (Campbell et al. 2012) as well as for the physiological characterization of human embryonic stem cells (Lee et al. 2012). In the future, optical mapping of monolayers of cultured stem cells-derived human cardiac myocytes may become a useful tool for screening cardiac toxicity of potential pharmacological agents.
4.4 Three-Dimensional Optical Mapping
The heart tissue is essentially three-dimensional (3D). In larger animals such as pigs and dogs the thickness of the ventricular wall can easily exceed 2 cm. Would it be possible to glean 3D information about the electrical activity deep inside the ventricular wall using optical mapping? As was discussed above, the light can penetrate deep into the tissue, in particularly in the red and near-infrared parts of the spectrum. However, significant light scattering in the tissue and significant signal blurring significantly complicates the efforts to extract useful 3D information. It is interesting that in early studies, a “2D heart” model was developed, in which all intramural tissue was cryoablated leaving intact only thin viable epicardial layer (Girouard et al. 1996), which largely eliminated the complications caused by 3D effects.
The first successful attempts to extract 3D information from optical signals were reported by Efimov and Mazgalev who were able to detect activation of the AV nodal cells buried under the thin layer of atrial tissue in the rabbit (Efimov and Mazgalev 1998). Their method takes advantage of significant differences in the activation time of the surface layer of atrial cells and underlying layer of the AV nodal cells. The optical summation of signals from these two layers produces specific double-hump signals, which can be readily related to one or the other layer. A similar approach was recently used to study electrical propagation in human SA-node (Fedorov et al. 2010). In humans, the layer of atrial myocytes over the AV node is significantly thicker than in the rabbit. To obtain strong enough signal from the AV-nodal layer the authors utilized the novel NIR dyes, which enabled the signal detection from significantly greater depth compared to a dye with green-blue excitation used in the rabbit studies.
Stay updated, free articles. Join our Telegram channel

Full access? Get Clinical Tree


