5 Blood flow and its appearance on color flow imaging
STRUCTURE OF VESSEL WALLS
Arteries and veins are composed of three layers of tissue, with veins having thinner walls than arteries. The outer layer is called the adventitia and is predominantly composed of connective tissue with collagen and elastin. The middle layer, the media, is the thickest layer and is composed of smooth-muscle fibers and elastic tissue. The intima is the inner layer and consists of a thin layer of endothelium overlying an elastic membrane. The capillaries, by contrast, consist of a single layer of endothelium, which allows for the exchange of molecules through the capillary wall. It is possible to image the structure of larger vessel walls using ultrasound and to identify the early stages of arterial disease, such as intimal thickening.
WHY DOES BLOOD FLOW?
• Pressure energy (p) – this is the pressure in the fluid, which, in the case of blood flow, varies due to the contraction of the heart and the distension of the aorta.
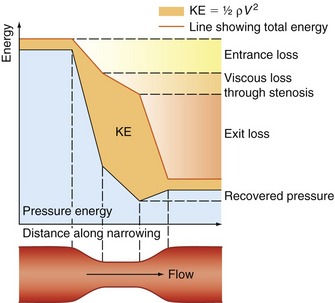
• Kinetic energy (KE) – this is due to the fact that the fluid is a moving mass. Kinetic energy is dependent on the density (ρ) and velocity (V) of the fluid:
 (5.1)
(5.1)
• Gravitational potential energy – this is the ability of a volume of blood to do work due to the effect of gravity (g) on the column of fluid with density (ρ) because of its height (h) above a reference point, typically the heart.
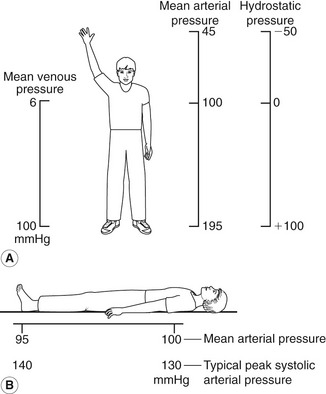
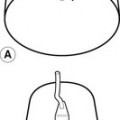
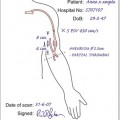
Gravitational potential energy (ρgh) is equivalent to hydrostatic pressure but has an opposite sign (i.e.−ρgh). For example, when a person is standing, there is a column of blood – the height of the heart above the feet – resting on the blood in the vessels in the foot (Fig. 5.1A) causing a higher pressure, due to the hydrostatic pressure, than that seen when the person is lying down (Fig. 5.1B). As the heart is taken as the reference point, and the feet are below the heart, the hydrostatic pressure is positive. If the arm is raised so that it is above the heart, the hydrostatic pressure is negative, causing the veins to collapse and the pressure in the arteries in the arm to be lower than the pressure at the level of the heart. The total fluid energy is given by:
 (5.2)
(5.2)Figure 5.2 gives a graphical display of how the total energy, kinetic energy, and pressure alter with continuous flow through an idealized narrowing. Usually the kinetic energy component of the total energy is small compared with the pressure energy. When fluid flows through a tube with a narrowing, the fluid travels faster as it passes through the narrowed section. As the velocity of the fluid increases in a narrowed portion of the vessel, the kinetic energy increases and the potential energy (i.e., the pressure) falls. The pressure within the narrowing is therefore lower than the pressure in the portion of the vessel before the narrowing. As the fluid passes beyond the narrowing, the velocity drops again and the kinetic energy is converted back to potential energy (the pressure), which increases. Energy is lost as the fluid passes through the narrowing (Fig. 5.2), with the extent of the entrance and exit losses depending on the geometry and degree of the narrowing (Oates 2008). In normal arteries, very little energy is lost as the blood flows away from the heart toward the limbs and organs, and the mean pressure in the small distal vessels is only slightly lower than in the aorta. However, in the presence of significant arterial disease, energy may be lost from the blood as it passes through tight narrowings or small collateral vessels around occlusions, leading to a drop in the pressure greater than that which would be expected in a normal artery; this can lead to reduced blood flow and tissue perfusion distally. Because the entrance and exit losses account for a large proportion of the pressure loss, it is likely that two adjacent stenoses will have a more significant effect than one long one (Oates 2008).
RESISTANCE TO FLOW
 (5.3)
(5.3)where the resistance to flow is given by:
 (5.4)
(5.4)where r is the radius.
Viscosity causes friction between the moving layers of the fluid. Treacle, for example, is a highly viscous fluid, whereas water has a low viscosity and therefore offers less resistance to flow when traveling through a small tube. Poiseuille’s law shows that the resistance to flow is highly dependent on changes in the radius (r4). In the normal circulation, the greatest proportion of the resistance is thought to occur at the arteriole level. Tissue perfusion is controlled by changes in the diameter of the arterioles. The presence of arterial disease in the arteries, such as stenoses or occlusions, can significantly alter the resistance to flow, with the reduction in vessel diameter having a major effect on the change in resistance seen. In severe disease, the arterioles distal to the disease may become maximally dilated in order to reduce the peripheral resistance, thus increasing blood flow in an attempt to maintain tissue perfusion. Poiseuille described nonpulsatile flow in a rigid tube, so his equation does not completely represent arterial blood flow; however, it gives us some understanding of the relationship between pressure drop, resistance, and flow.
VELOCITY CHANGES WITHIN STENOSES

 (5.5)
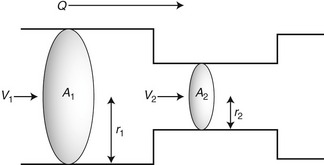
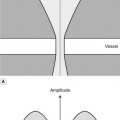
(5.5)where V is the mean velocity across the whole of the vessel, averaged over time, and A is the cross-sectional area of the tube. If the tube has no outlets or branches through which fluid can be lost, the flow along the tube remains constant. Therefore, the velocity at any point along the tube depends on the cross-sectional area of the tube. Figure 5.3 shows a tube of changing cross-sectional area (A1, A2); now, as the flow (Q) along the tube is constant:
 (5.6)
(5.6)This equation can be rearranged to show that the change in the velocities is related to the change in the cross-sectional area, as follows:
 (5.7)
(5.7)As the cross-sectional area depends on the radius r of the tube (A = πr2), we have:
 (5.8)
(5.8)This relationship describes steady flow in a rigid tube, but it does give us an indication as to how the velocity will change across a stenosis in an artery.
Figure 5.4 shows how the flow and velocity within an idealized stenosis vary with the degree of diameter reduction caused by the stenosis, based on the predictions from a simplified theoretical model. On the right-hand side of the graph, where the diameter reduction is less than 70–80%, the flow remains relatively unchanged as the diameter of the vessel is reduced. This is because the proportion of the resistance to flow due to the stenosis is small compared with the overall resistance of the vascular bed that the vessel is supplying. However, as the diameter reduces farther, the resistance offered by the stenosis becomes a significant proportion of the total resistance, and the stenosis begins to limit the flow. This is known as a hemodynamically significant stenosis. At this point, the flow decreases quickly as the diameter is reduced.
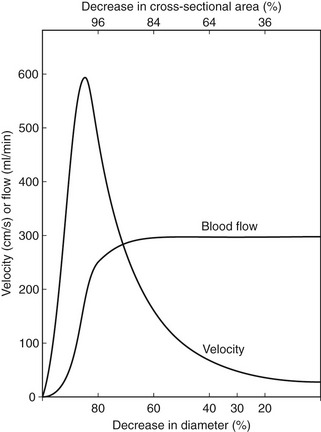
The graph also predicts the behavior of the velocity as the vessel diameter is reduced and shows that the velocity increases with diameter reduction. Noticeable changes in velocity begin to occur at much smaller diameter reductions than would produce a flow reduction. Therefore, measurement of velocity changes is a more sensitive method of detecting small-vessel lumen reductions than measurement of flow. Measurements of velocity made using Doppler ultrasound are also more accurate than measurement of flow, as will be discussed later (see Ch. 6). Therefore, it is usually the change in velocity of blood within a diseased artery that is used to quantify the degree of narrowing. Eventually, there comes a point at which the resistance to flow produced by the narrowing is so great that the flow drops to such an extent that the velocity begins to decrease, as shown on the left side of the graph. This is seen as ‘trickle flow’ within the vessel. It is especially important to be able to identify trickle flow within a stenosis as the peak velocities seen may be similar to those seen in healthy vessels, but the color image and waveform shapes will not appear normal.
Stay updated, free articles. Join our Telegram channel

Full access? Get Clinical Tree


