3 Doppler ultrasound
THE DOPPLER EFFECT
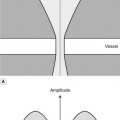
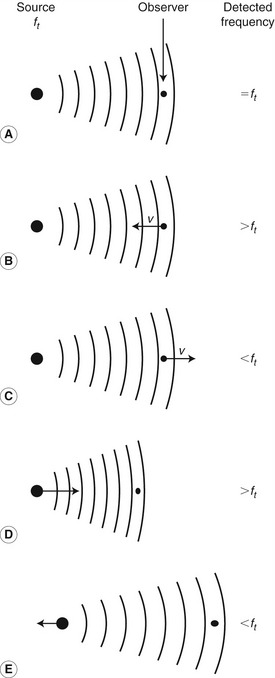
The Doppler effect enables ultrasound to be used to detect blood flow and to quantify vascular disease. The Doppler effect is the change in the observed frequency due to the relative motion of the source and the observer. This effect can be heard when the pitch of a police car’s siren changes as the car travels towards you and then away from you. Figure 3.1 helps to explain the effect in more detail. In Figure 3.1A the source of the sound and the observer are both stationary, so the observed sound has the same frequency as the transmitted sound. In Figure 3.1B the source is stationary and the observer is moving toward it, causing the observer to cross the wavefronts of the emitted wave more quickly than when stationary, so that the observer witnesses a higher-frequency wave than that emitted. If, however, the observer is moving away from the source (Fig. 3.1C), the wavefronts will be crossed less often and the frequency witnessed will be lower than that emitted. Figure 3.1D shows the opposite case, in which the source is moving toward a stationary observer. The source will move a short distance toward the observer between the emission of each wave, and in so doing shorten the wavelength, so the observer will therefore witness a higher frequency. Similarly, if the source is moving away from the observer, the wavelength will be increased, leading to observation of a lower frequency (Fig. 3.1E). The resulting change in the observed frequency is known as the Doppler shift, and the magnitude of the Doppler shift frequency is proportional to the relative velocities of the source and the observer.
History behind the discovery of the Doppler effect
This effect was first described by an Austrian physicist named Christian Doppler in 1842. He used the Doppler effect to explain the “color of double stars.” A rival Dutch scientist working at the same time tried to prove Doppler’s theory wrong by hiring a train and two trumpeters. One trumpeter stood on the train while the other stood by the track, and an observer compared the pitch of the trumpeter who passed by on the train with that of the stationary trumpeter. This experiment verified Doppler’s theory, although Doppler’s use of this effect to explain the “color of double stars” was in fact incorrect.
DOPPLER EFFECT APPLIED TO VASCULAR ULTRASOUND
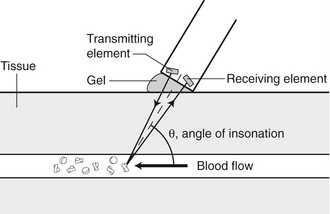
In the case of vascular ultrasound, the Doppler effect is used to study blood flow. The simplest Doppler ultrasound instruments use transducers consisting of two piezoelectric elements, one to transmit ultrasound beams and the other to receive the returning echoes back-scattered from the moving blood cells (Fig. 3.2). In this situation, the Doppler effect occurs twice. First, the transducer is a stationary source while the blood cells are moving receivers of the ultrasound waves (Fig. 3.1B). The ultrasound is then back-scattered from the blood cells, which now act as a moving source, with the transducer acting as a stationary observer (Fig. 3.1D). The Doppler shift observed depends on the frequency of the ultrasound originally transmitted by the transducer and the velocity of the blood cells from which the ultrasound is back-scattered. The observed frequency also depends on the angle from which the movement of the blood is observed (i.e., the angle between the ultrasound beam and the direction of the blood flow). The Doppler shift frequency, fd (i.e., the difference between the transmitted frequency, ft, and received frequency, fr) is given by:
 (3.1)
(3.1)where v is the velocity of the blood, θ is the angle between the ultrasound beam and the direction of blood flow (also known as the angle of insonation), and c is the speed of sound in tissue. The factor of 2 is present in the Doppler equation as the Doppler effect has occurred twice, as explained above.
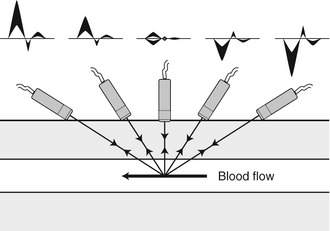
The Doppler equation shows that the detected Doppler shift depends on the angle of insonation, θ, through the term cosθ. Table 3.1 shows how the cosθ term varies between 0 and 1 as the angle changes from 0° to 90°. When the angle of insonation is 90°, the cosθ term is 0, so virtually no Doppler shift is detected. When the angle of insonation is 0° (i.e., the Doppler beam is parallel to the direction of flow), the cosθ term is 1, giving the maximum detectable Doppler shift frequency for a given velocity of blood and transmitted frequency. Figure 3.3 shows how the detected Doppler shift frequencies change as the Doppler angle changes. When the transducer is pointing toward the flow, a positive frequency shift is seen, but once the transducer is pointing away from the direction of flow, a negative frequency shift is seen. The smaller the angle of insonation, the larger the frequency shift detected, but as the angle of insonation approaches a right angle, very small frequency shifts are detected.
Table 3.1 Variation of the cosθ term of the Doppler equation with the angle of insonation
| θ (°) | cosθ |
|---|---|
| 0 | 1 |
| 30 | 0.87 |
| 45 | 0.71 |
| 60 | 0.5 |
| 75 | 0.26 |
| 90 | 0 |
Back-scatter from blood
Blood is made up of red blood cells (erythrocytes), white blood cells (leukocytes), and platelets suspended in plasma. Red blood cells occupy between 36% and 54% of the total blood volume. They have a biconcave disc shape and a diameter of 7 µm, which is much smaller than the wavelength of ultrasound used to study blood flow. This means that groups of red blood cells act as scatterers of the ultrasound (see Fig. 2.8).
The back-scattered signal from blood received at the transducer is small, partly due to the back-scattered energy being radiated in all directions, unlike specular reflections, and partly because the effective cross-section of the blood cells is small compared with the width of the beam. The back-scattered power is proportional to the fourth power of the frequency (i.e., f4), and therefore as the transmitted frequency selected to detect flow is increased, there is an increase in back-scattered power. However, this is offset by the increase in attenuation of the overlying tissue with the increase in frequency. Ultrasound systems will often use a lower transmitted frequency for Doppler than for B-mode imaging, and the imaging and Doppler transmitted frequencies are usually indicated on the image. In situations in which blood velocity is low or blood cells are stationary, such as aneurysms or venous flow, the cells may aggregate into clumps that can sometimes produce sufficiently high-amplitude back-scattered echoes to be displayed on the B-mode image (see Fig. 13.22).