Bone Tumors and Related Condition
Lee F. Rogers
Martha A. Norris
L. F. Rogers: Department of Radiology, Wake Forest University School of Medicine, Winston-Salem, North Carolina 27157. M. A. Norris: Department of Radiology, University of Wisconsin Hospital and Clinics, Madison, Wisconsin 53792-3252.
Primary tumors of bone are relatively uncommon, whereas metastatic disease of bone is encountered daily. Because of the rarity of these tumors, physicians are often unfamiliar with them and feel uncertain about their diagnosis and treatment. The application of certain basic principles should allow a correct diagnosis or at least a reasonable differential diagnosis in most cases.
Bone tumors are not easily classified. The classifications in common use are related more to the microscopic characteristics of the tumor and its presumed tissue of origin than to the radiographic appearance of the lesion 4,5,9. The initial pathologic diagnosis is usually based on a small portion of tissue that may well suggest the tissue of origin, but the radiographic manifestations of the process are often a better clue to the aggressiveness of the lesion. Therefore, the final diagnosis of most bone tumors should be based on a combination of both the microscopic and radiographic characteristics. The development of classifications is also hindered by the fact that benign lesions do not necessarily have malignant counterparts. Lesions are either benign and remain benign or are malignant from their inception. Very few primary bone lesions convert from a benign to a malignant character. The classification of tumors in Table 4-1 serves as a guide to the radiographic characteristics of lesions.
 |
RADIOGRAPHIC ANALYSIS OF BONE TUMORS
The radiologist’s role is to identify and characterize the lesion 9. A few benign types of bone tumors are quite characteristic in appearance, and they require no treatment. These are known as “leave me alone lesions,” lesions so commonly encountered and characteristic in appearance that a diagnosis can be made with absolute assurance on the basis of radiographic characteristics alone. These lesions are osteoma, bone island, and nonossifying fibroma. In other cases, the radiographic manifestations are sufficiently characteristic to allow a diagnosis with a high degree of probability. In the remainder, it may be difficult to establish a tissue diagnosis with assurance. In these situations, one should attempt to determine whether the lesion is benign or malignant and to differentiate tumors from infectious, metabolic, or dysplastic processes.
The extent or limits of the lesion must be determined. In general, the diagnosis of the lesion is based on plain film radiography and is further defined by tomography. Computed tomography (CT) and magnetic resonance imaging (MRI) occasionally add to the tissue characterization of the lesion, but they are useful primarily in evaluating the extent of the lesion by determining the presence or absence of soft-tissue extension outside of bone and intramedullary extension within bone.
The best site for biopsy should be determined on the basis of the radiographic characteristics. The most active or aggressive portion of the lesion can usually be identified, and tissue that best characterizes the lesion is likely to be found at this site.
As a broad generalization, a benign lesion is sharply defined, the overlying cortex is intact, and there is no associated soft-tissue mass. In contrast, a malignant lesion is poorly defined, the overlying cortex is disrupted, and there is an associated soft-tissue mass.
DIAGNOSTIC CRITERIA
The characteristics of value in the determination of a specific diagnosis are the age of the patient,5 whether the lesion is single or multiple, the location of the lesion in relation to both the long axis and the central axis of the bone, the bone in which the lesion is located, the character of the internal margins of the lesion,15 the presence or absence of periosteal reaction and its character,20 the presence or absence of tumor
matrix calcification and its character,23 and the presence or absence of a previous history of malignancy (particularly in patients older than 40 years of age).
matrix calcification and its character,23 and the presence or absence of a previous history of malignancy (particularly in patients older than 40 years of age).
Age
The age of the patient alone is an excellent indicator of the type of tumor encountered.5 For instance, metastatic neuroblastoma is the most common malignant-appearing tumor before the age of 1 year, whereas between the ages of 1 and 20 years Ewing’s tumor is encountered in tubular bones. Between the ages of 10 and 30, osteosarcoma and Ewing’s tumor are encountered in flat bones. After the age of 40, metastatic carcinoma, multiple myeloma, and chondrosarcoma are more likely.
Location
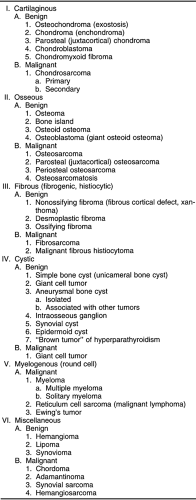
Different types of tumors occur in relatively characteristic locations within the skeletal system (Fig. 4-1). Location in relation to the long axis of bone is of primary importance.11 Certain tumors arise in the metaphysis, others in the diaphysis or within the epiphysis. Location in relation to the central axis is likewise important. Some tumors arise centrally, in the central axis; some arise eccentrically, off the central axis; still others arise within the cortex or the surface of the cortex, referred to as parosteal. When lesions of long tubular bones that are characteristically eccentric in position occur in the smaller tubular bones, such as the fibula or metacarpals, they may easily involve the entire width of the shaft and lead to a ballooned expansion of the involved bone (see Fig. 4-16). This is particularly true of nonossifying fibromas, giant cell tumors, and aneurysmal bone cysts.
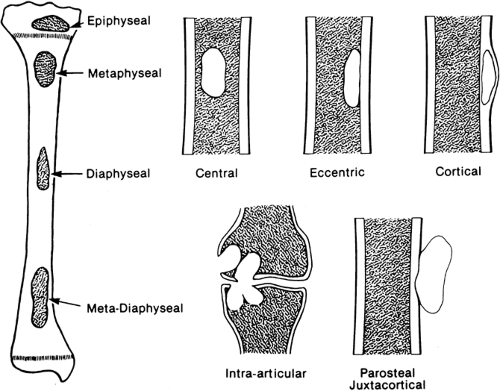 FIG. 4-1. Location of tumors. |
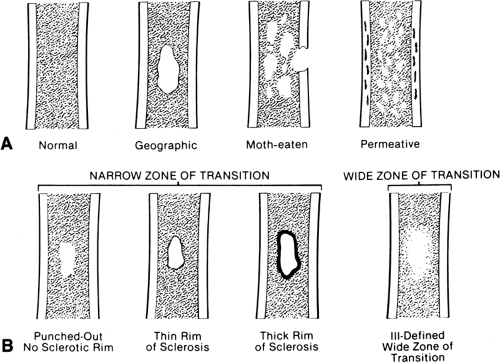 FIG. 4-2. A: Pattern of medullary destruction. B: Margination of lesions. |
 FIG. 4-3. Patterns of cortical disturbance. |
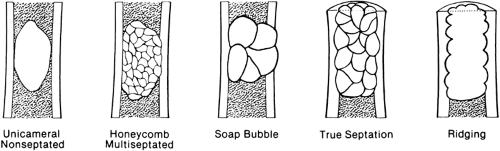 FIG. 4-4. Septation in bone lesions. |
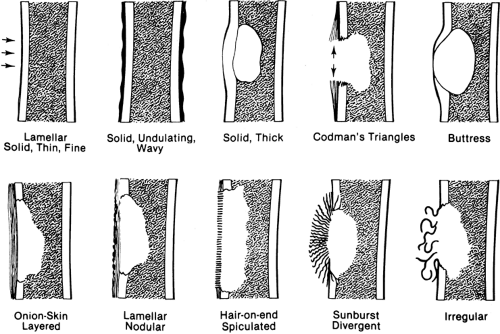 FIG. 4-5. Periosteal new-bone formation. |
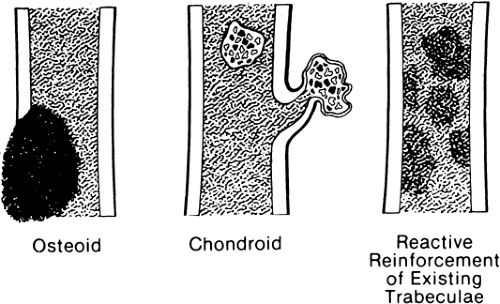 FIG. 4-6. Tumor bone formation, matrix calcification. |
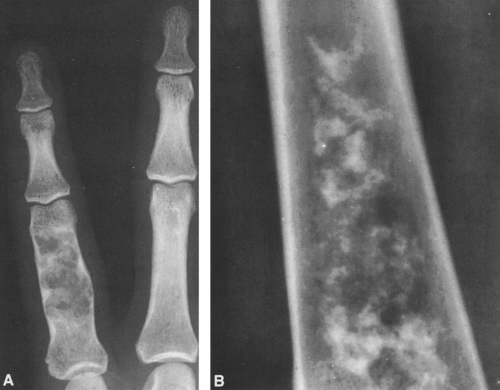 FIG. 4-7. A: Enchondroma of the proximal phalanx of the fifth digit. Note the small calcifications distally, typical of cartilaginous tumors. B: Closeup view of the lower femur showing characteristic chondroid calcification within the medullary canal. Note the lack of boundary rim of sclerosis and the small, rounded areas of lucency representing islands of uncalcified cartilage. Note also the absence of endosteal erosion and cortical thickening (compare with Fig. 4-49, chondrosarcoma, and Fig. 7-24, bone infarction). |
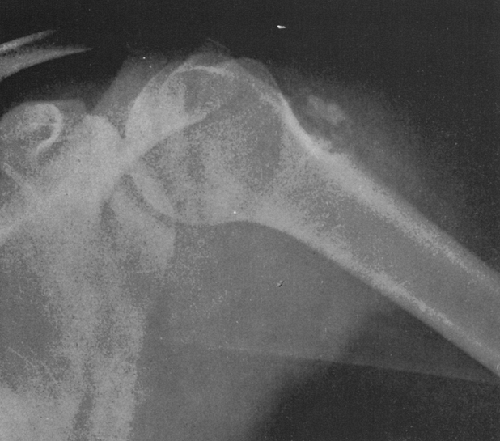 FIG. 4-8. Parosteal chondroma. The base of the lesion is bounded by a zone of sclerosis. Note the buttress at the distal margin of the lesion, the scalloping of the cortex, and the chondroid calcification within the lesion. |
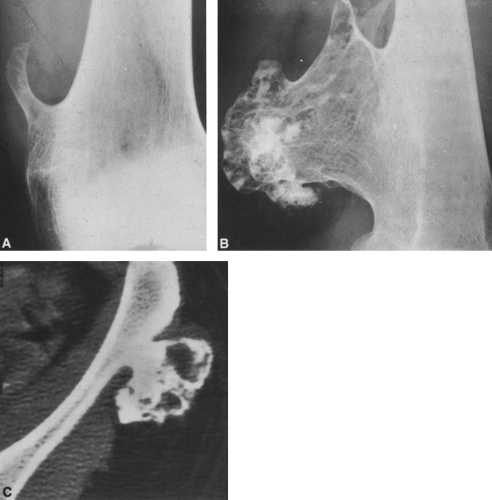 FIG. 4-9. A: Osteochondroma (exostosis) arising from the medial aspect of the distal femur. The pedicle is composed of cortical bone that merges with and is continuous with the normal femoral cortex. The medullary bone within the stalk of the lesion is likewise continuous with the medullary canal of the femur. B: Broad-based osteochondroma arising from the posterior cortex of the lower femur. The periphery of the tumor is composed of a mixture of cartilage, calcified cartilage, and bone. Note the characteristic chondroid calcification in the distal portion of the lesion. C: Computed tomogram of osteochondroma arising from the iliac bone. The lesion is sharply defined without an overlying soft-tissue mass. The cortex of the lesion is contiguous with the cortex of the iliac bone (compare with Fig. 4-50). |
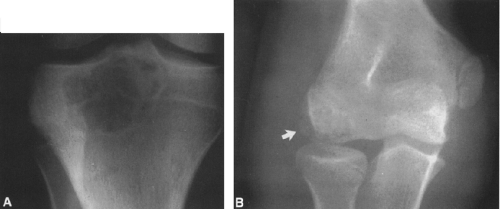 FIG. 4-10. Two cases of chondroblastoma in 14-year-olds. A: Sharply defined, lobulated lesion located in the proximal tibia epiphysis. The lesion is bordered by a thin rim of sclerosis. B: Slightly lobulated lesion with a sclerotic margin located eccentrically in the distal humeral epiphysis. It contains punctate chondroid calcification, and periosteal reaction (arrow) is noted at the lateral margin. |
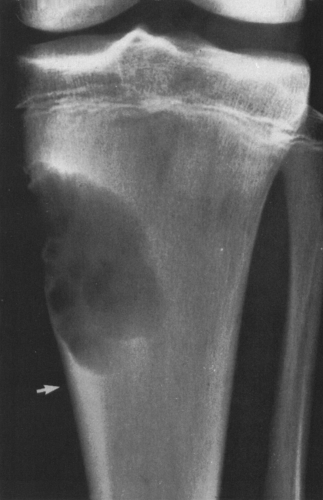 FIG. 4-11. Chondromyxoid fibroma in an 11-year-old boy. An eccentric, sharply defined lesion arising in the metaphysis of the proximal tibia is partially marginated by a thin rim of sclerosis. Note the buttress inferiorly (arrow). The medial margin of the cortex is completely destroyed, and the medial margin of the lesion is invisible. (Courtesy of Arthur Newburg, M.D., Boston, Massachusetts.) |
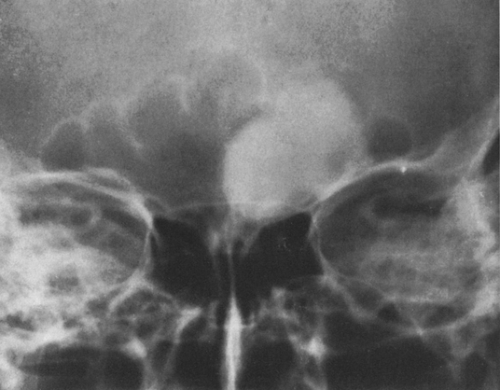 FIG. 4-12. Osteoma of the frontal sinus. A homogeneously dense, sharply marginated, slightly lobulated mass lies in the left frontal sinus. The location, density, and configuration are typical of an osteoma. This lesion is larger than average. |
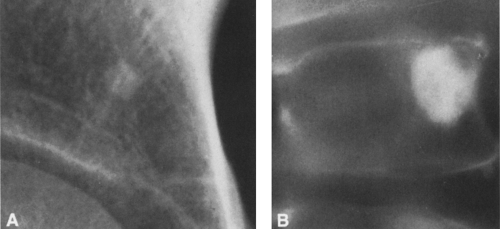 FIG. 4-13. Bone island. A: A typical small, dense nodule above the right acetabulum. B: Tomogram demonstrating a radiodense nodule of cortical bone with a sharply defined although slightly irregular peripheral margin in the second lumbar vertebral body. |
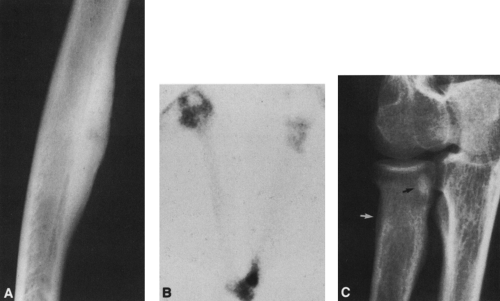 FIG. 4-14. Osteoid osteoma. A: Osteoid osteoma of the humerus. A small lucency within the anterior cortex is surrounded by a considerable amount of reactive bone, resulting in thickening of the cortex. B and C: Osteoma of the proximal radius. In the bone scan (B), a focus of increased radioactivity is identified just distal to the elbow joint. In C, a discrete, ovoid calcification (black arrow) surrounded by a zone of radiolucency is identified. Note also the overlying periosteal new-bone formation (white arrow). |
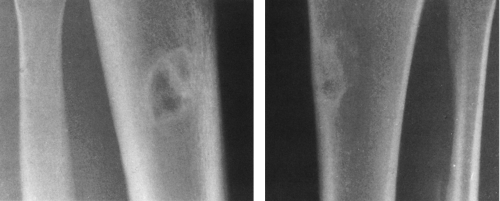 FIG. 4-15. Benign fibrous cortical defect of the tibia. The lesion is radiolucent but is limited by a thin, slightly lobulated, sclerotic margin of bone. This was an incidental finding on a radiograph obtained because of trauma. |
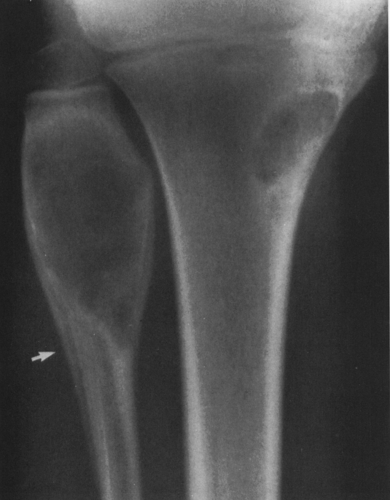 FIG. 4-16. Two nonossifying fibromas in an 11-year-old boy. A typical nonossifying fibroma with eccentric location and a thin rim of sclerosis is present in the proximal tibia. The lesion of the proximal fibula has enlarged and expanded the cortex, but note that the cortex remains intact. There is a buttress of bone formed inferiorly and laterally (arrow). (Courtesy of Theodore Keats, M.D., Charlottesville, Virginia.) |
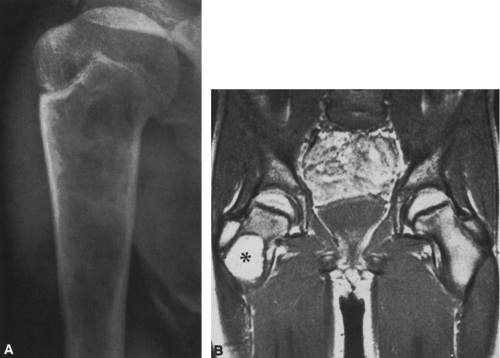 FIG. 4-17. Unicameral bone cysts. A: Simple bone cyst of the proximal humerus in a 13-year-old boy. The lesion is sharply defined, slightly expansile with endosteal erosion, and abuts the physis. B: Magnetic resonance image of a unicameral bone cyst (asterisk) of the intertrochanteric region of the proximal femur in a 10-year-old boy. The lesion is sharply defined by a thin rim of cortical bone. |
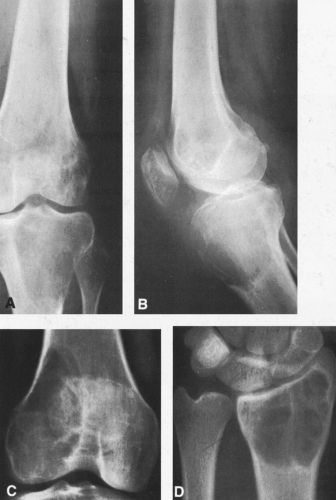 FIG. 4-18. A and B: Anteroposterior and lateral views of a giant cell tumor of the proximal tibia. C: Giant cell tumor of the distal femur. D: Giant cell tumor of the distal radius. The lesions are radiolucent, eccentric, and sharply defined, and they characteristically extend to the joint surface. |
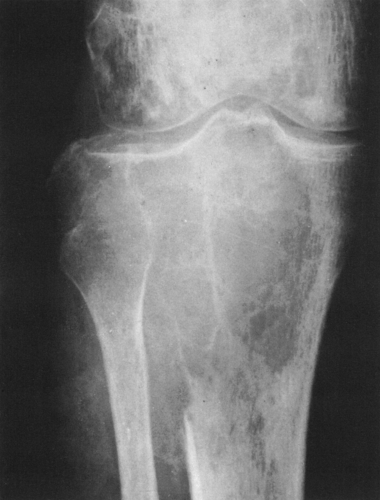 FIG. 4-19. Giant cell tumor of the tibia. A lytic tumor that has expanded and has apparently destroyed the lateral tibial cortex. The margin is less sharply defined than those in Fig. 4-18, suggesting the possibility of a malignancy, although this lesion was benign. |
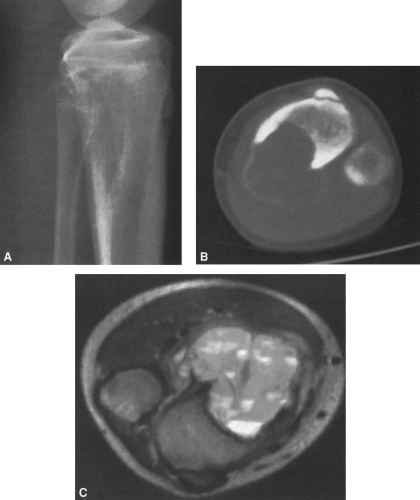 FIG. 4-20. Aneursymal bone cyst of the proximal tibia in a 15-year-old boy. A: An eccentric, markedly expansile lesion of the distal tibial metaphysis is bordered posteriorly by a very thin rim of bone. There is no matrix within the lesion, which is poorly defined anteriorly and superiorly. B: Computed tomography (CT) scan demonstrates the sharply defined, thin rim of sclerosis and the eccentric nature of the lesion. There is a variation in the density within the lesion, suggesting fluid–blood levels. C: T2-weighted axial image confirms the presence of fluid–blood levels within the lesion. Examination was performed in the supine position. Note that the thin rim of sclerosis is not as well defined by magnetic resonance imaging as it was by CT. (Courtesy of W. Michael Hensley, M.D., Parkersburg, West Virginia.) |
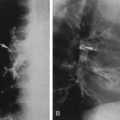
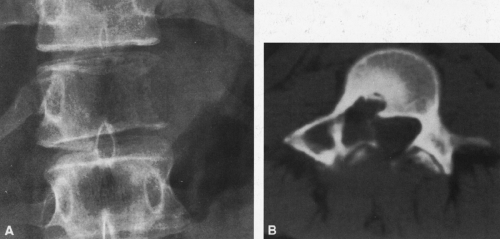 FIG. 4-21. Two cases of aneurysmal bone cyst of the spine. A: This lesion involves the left side of the body and arch of T12 and the adjacent portion of the 12th rib. Note the absence of the left pedicle. The lesion is purely destructive. B: Computed tomogram of an aneurysmal bone cyst of L4 demonstrates an expansile lesion involving the pedicle, transverse process, and facet, with extension into the vertebral body. The lesion is obviously expansile and purely lytic. |
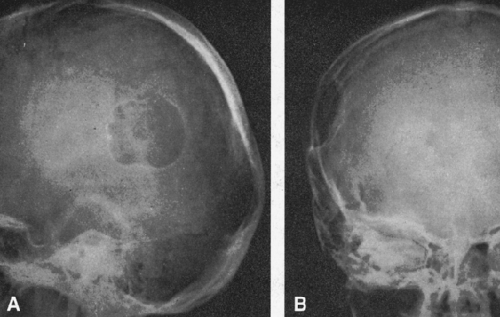 FIG. 4-22. Epidermoid cyst of the skull. An area of radiolucency is surrounded by a thin rim of sclerosis. The lesion is scalloped. |
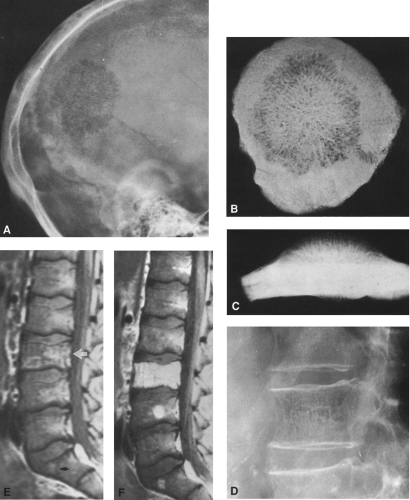 FIG. 4-23. Hemangioma of bone. A: Hemangioma of the skull. Note the somewhat granular appearance in the parietal bone. B and C: Excised specimen of a benign hemangioma of the skull shown in two projections. Characteristic linear striation is noted in the tangential view. (Courtesy of Radiological Registry of the Armed Forces Institute of Pathology, Washington, D.C.) D: Hemangioma of a vertebral body. Note the characteristic palisade-like vertical striations. E and F: Magnetic resonance images of multiple vertebral hemangiomas in a 33-year-old man. T1-weighted image (E) demonstrates obvious vertical striations across the entire L3 vertebral body (white arrow). The signal within this vertebra is mixed, containing some foci of higher signal. There are smaller foci of signal within the midportion of the fourth lumbar vertebra and the first sacral segment (black arrow). T1-weighted image (F), taken after administration of gadolinium, demonstrates an extremely bright signal from the entire third lumbar vertebral body and small, rounded, similar foci within L4 and the first sacral segment. These findings are typical of hemangioma. T2-weighted images would give a similar although less intense bright signal. |
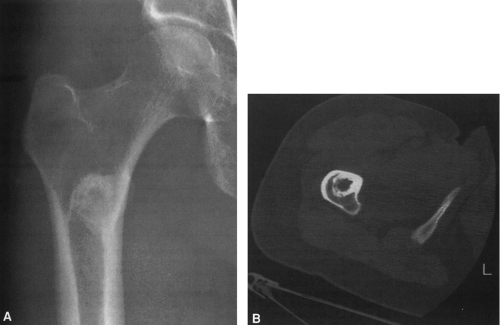 FIG. 4-24. Intramedullary lipoma in an asymptomatic 47-year-old woman. A: Note the sharply marginated, slightly eccentric lesion with a heavily calcified, swirling, thick margin of calcification at the level of the lesser trochanter. The overlying cortex is intact. B: Computed tomography scan confirms the sharp definition of the lesion with a thick, irregular border contiguous with the cortex anteriorly and medially. The density of the center of the lesion is that of fat and confirms the diagnosis of lipoma. |
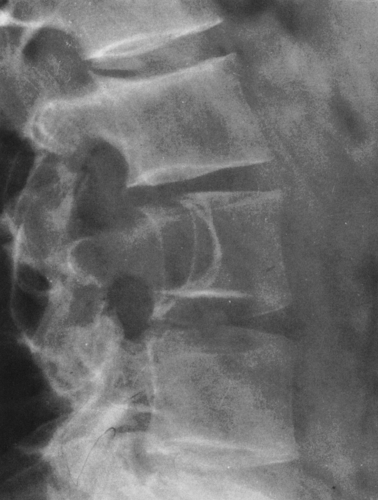 FIG. 4-25. Neurofibroma. A large neurofibroma arising from a lumbar nerve root has resulted in pressure erosion of the posterior aspect of the vertebral body and adjacent posterior elements of the spine. |
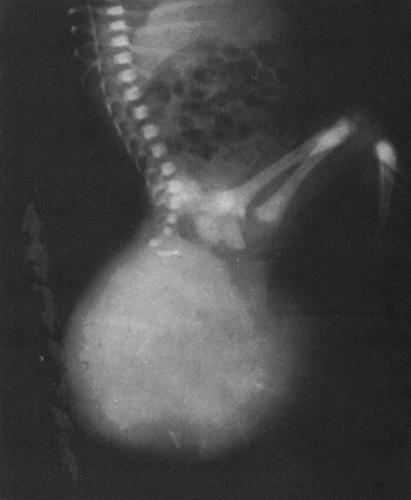 FIG. 4-26. Sacrococcygeal teratoma. This large mass found in a newborn infant contains scattered areas of calcification and bone. The lower sacrum and coccyx are deformed. |
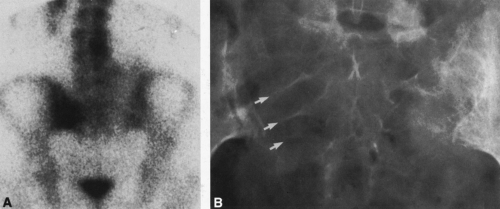 FIG. 4-27. Metastatic carcinoma of the breast to the sacrum. A: Posterior view of a bone scan demonstrates increased radioactivity in the left sacral ala. There is also a focus in the lower lumbar vertebra. B: A subtle, lytic destructive lesion present in the left sacral ala is manifested by destruction of the sacral foraminal lines. The normal sacral foraminal lines on the right are identified by arrows. Note that the bone scan is actually a mirror image of the radiograph, since it was obtained and is displayed as though looking from the back, whereas the radiograph was obtained and displayed looking from the front of the patient. |
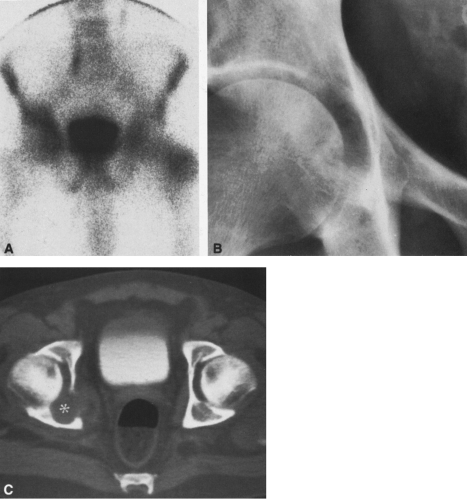 FIG. 4-28. Metastasis to the right acetabulum from carcinoma of the lung. A: Anterior view of a bone scan demonstrates increased radioactivity in the right acetabulum and left greater trochanter. B: Closeup view of the right acetabulum demonstrates a vague radiolucency medially. C: Computed tomogram demonstrates bone destruction in the medial acetabulum posteriorly (asterisk), with an adjacent soft-tissue mass. |
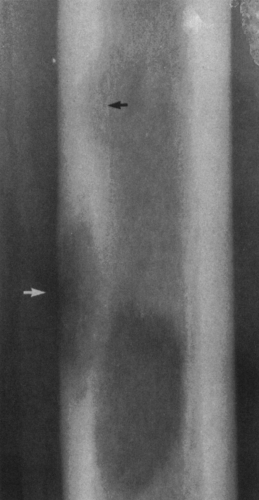 FIG. 4-29. Metastasis of the femoral shaft from carcinoma of the breast. Distally there is a lytic, ill-defined lesion in the intramedullary canal. The white arrow demonstrates an ill-defined, lytic lesion within the cortex. The black arrow demonstrates a poorly defined intramedullary lesion, identified by the presence of endosteal erosion. |
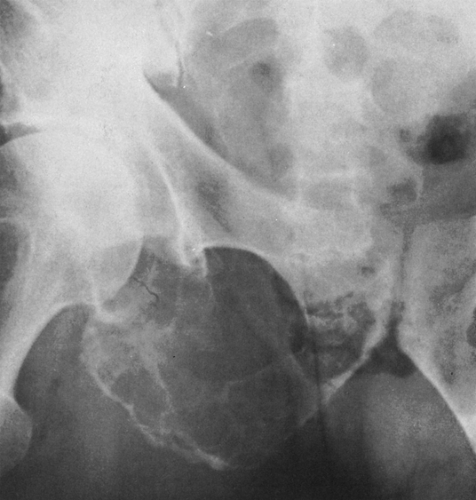 FIG. 4-30. Osteolytic expansile metastasis from carcinoma of the thyroid. The metastasis destroys and expands the inferior ischiopubic ramus. |
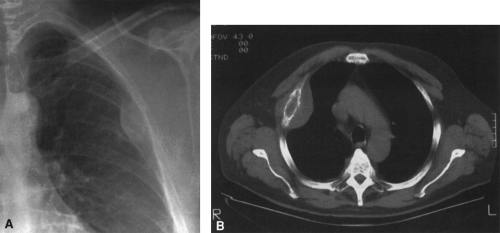 FIG. 4-31. Two cases of extrapleural sign. A: Metastatic squamous cell carcinoma of the pharynx involving the anterolateral aspect of the third left rib. The lesion has a smooth, sharply defined interface with the lung and is broader at its base than its height. The angles formed with the chest wall are obtuse. Close inspection reveals destruction of the underlying rib. B: Multiple myeloma in the anterolateral margin of the third right rib in a 66-year-old man. The rib is expanded and the cortex destroyed. The lesion has a sharp, smooth interface with the underlying lung. The lesion is characteristically broader at its base than its height. |
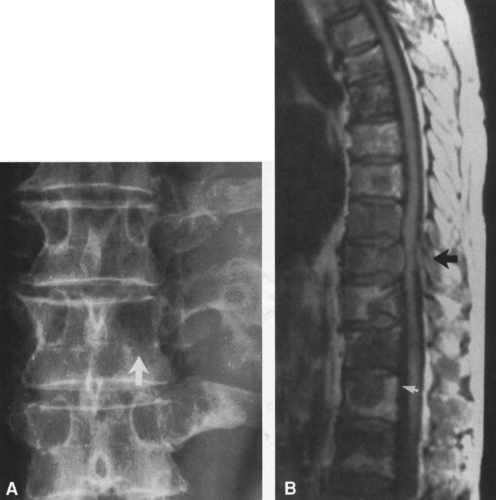 FIG. 4-32. Two cases of metastasis to the spine. A: Metastases from carcinoma of the breast to the left pedicle (arrow) of a lower thoracic vertebra. Note the absence of a normal ovoid “ring” shadow of the pedicle. There are also destructive lesions in the ribs. B: T1-weighted magnetic resonance image. Metastases to the dorsal and lumbar vertebrae from carcinoma of the lung are identified by areas of low signal on T1-weighted image. Some vertebral bodies are almost completely filled by metastatic disease. A lower thoracic vertebra is compressed and the posterior wall protrudes into the spinal canal, compressing the spinal cord (black arrow). In a midlumbar vertebra the end-plate has collapsed (white arrow) and the intervertebral disc protrudes into metastatic deposit located centrally within the subjacent vertebral body. |
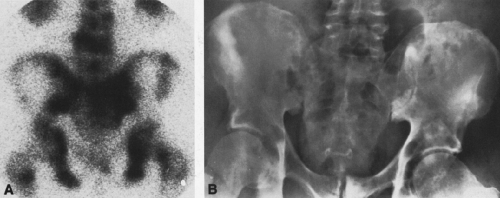 FIG. 4-33. Blastic metastasis from carcinoma of the prostate. A: Bone scan demonstrates multiple areas of increased uptake in the lower lumbar spine and pelvis. B: Anteroposterior view of the pelvis. Multiple sclerotic lesions correspond to positive areas on the bone scan. |
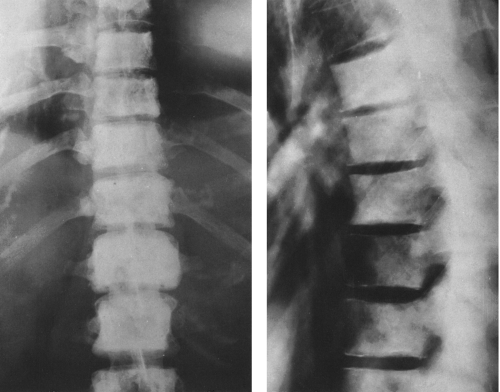 FIG. 4-34. Blastic metastases in carcinoma of the prostate. The areas of involvement are manifested by dense sclerosis that tends to obliterate the normal architecture. All of the vertebrae show some degree of involvement. |
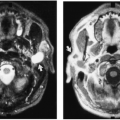
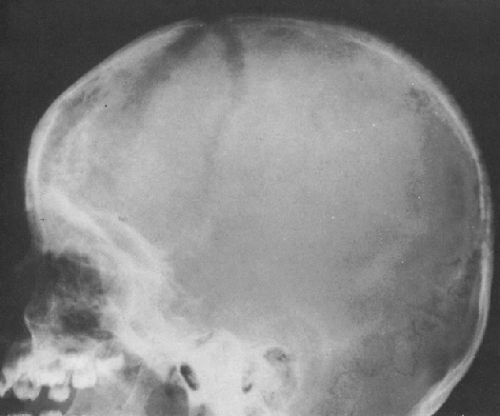 FIG. 4-35. Neuroblastoma metastasis to the skull. An area of mixed sclerotic and lytic involvement is seen in the frontal bone. The coronal suture is widened, indicating increased intracranial pressure secondary to metastatic involvement of the meninges. Patches of bone destruction are also demonstrated in the parietal bone. |
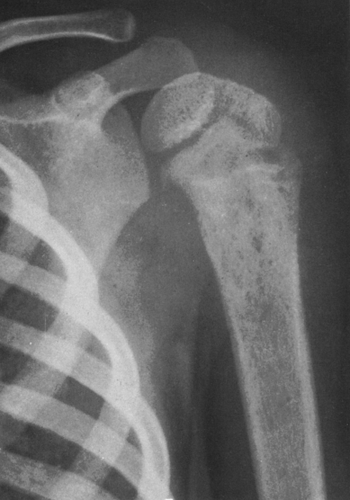 FIG. 4-36. Neuroblastoma metastasis to the proximal humerus. Note the ill-defined permeative destructive process (compare with Figs. 4-51 and 4-52, Ewing’s tumor). Round cell tumors of bone are very similar in radiographic appearance. |
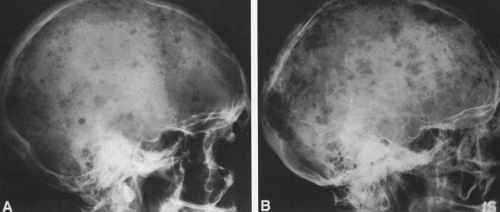 FIG. 4-37. A and B: Multiple myeloma in two patients. Multiple lytic areas are scattered throughout the calvarium. Note that the lesions tend to coalesce when widespread. |
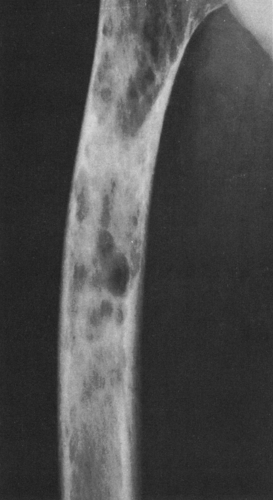 FIG. 4-38. Multiple myeloma. The midfemoral shaft is involved by a number of lytic lesions. Note the endosteal erosion by several of the lesions. |
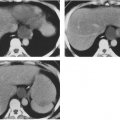
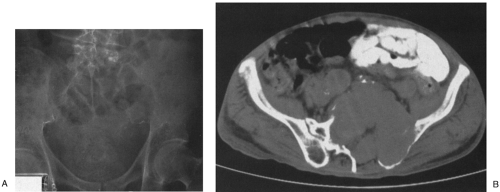 FIG. 4-39. Plasmacytoma of the sacrum in a 72-year-old man. A: Anteroposterior view of the pelvis demonstrates a destructive lesion of the entire body of the sacrum that extends across the L5-S1 intervertebral disc to destroy the left inferior aspect of the fifth lumbar vertebral body and across the left sacroiliac joint to destroy the adjacent iliac bone. B: Computed tomography scan confirms a large destructive mass arising from the sacrum and extending into the iliac bone. There is no matrix within the lesion. The anterior border of the lesion is slightly lobulated. |
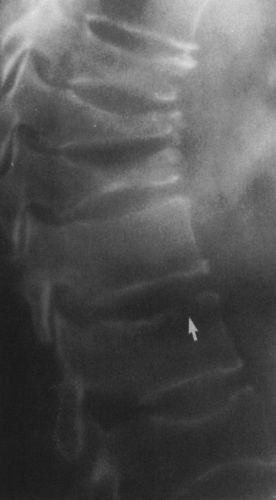 FIG. 4-40. Multiple myeloma of the spine. There are multiple compression fractures of the lower dorsal vertebrae and a biconcave lumbar vertebra. Discrete foci of disease are rarely identified in the spine in multiple myeloma. Note that the tomogram does demonstrate one single area of destruction in a vertebral end-plate (arrow). |
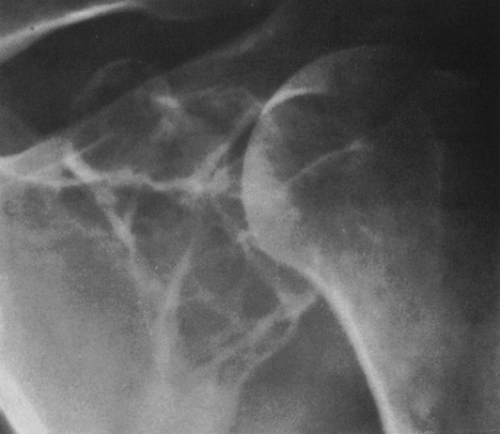 FIG. 4-41. Plasmacytoma of the scapula. Note the soap-bubbly, slightly expansile process in the neck of the scapula. |
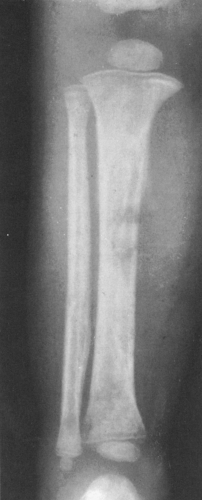 FIG. 4-42. Leukemia involving the tibia. There are poorly defined areas of destruction as well as periosteal reaction forming a Codman’s triangle on the medial aspect of the tibia. Note the thin, translucent band crossing the upper and lower metaphyses of the tibia and, to a lesser extent, of the fibula (compare with Figs. 4-51 and 4-52). |
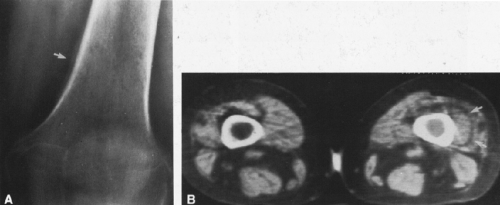 FIG. 4-43. Primary lymphoma of bone. A: An ill-defined permeative process is present in the distal femoral metaphysis and is overlaid by periosteal new-bone formation (arrow). B: Computed tomography reveals the presence of soft-tissue density in the medullary cavity and the presence of a surrounding soft-tissue mass (arrows). The normal intramedullary canal has a fat density, whereas marrow infiltrated by infection or tumor has a soft-tissue density. |
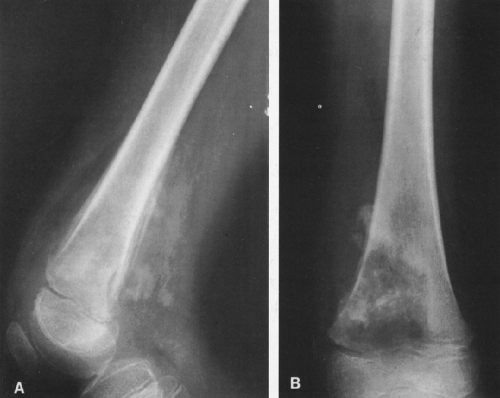 FIG. 4-44. Lateral (A) and frontal (B) projections of an osteosarcoma of the distal femur. An area of irregular destruction is best seen on the frontal projection. Laminated or layered periosteal reaction is seen posteriorly; tumor bone formation, osteoid, is noted within the medullary canal and extends into the soft tissues of the lower thigh. |
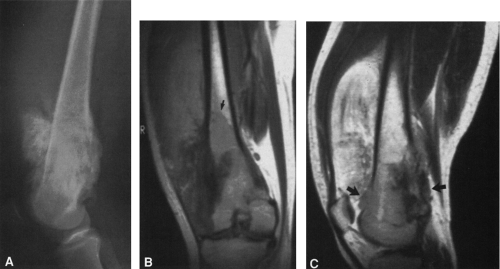 FIG. 4-45. Osteosarcoma of the distal femur in a 19-year-old man. A: Lateral view demonstrates sunburst pattern of dense periosteal new-bone formation anteriorly, dense osteoid in the medullary cavity, and cortical destruction with expansion of the lesion posteriorly. The lesion is poorly defined proximally. B: T1-weighted coronal magnetic resonance image (MRI) demonstrates proximal medullary extension of the lesion (arrow). The entire distal medullary cavity is filled with tumor. The dense osteoid gives a low signal. The lateral cortex is destroyed. Note that the associated soft-tissue mass is less well defined than on the T2-weighted image. C: T2-weighted sagittal MRI clearly demonstrates the high-signal soft-tissue mass that bows the quadriceps muscle anteriorly. There is low signal within the lesion, representing areas of osteoid bone formation. The cortex of the femur is perforated by the tumor both anteriorly and posteriorly (arrows). |
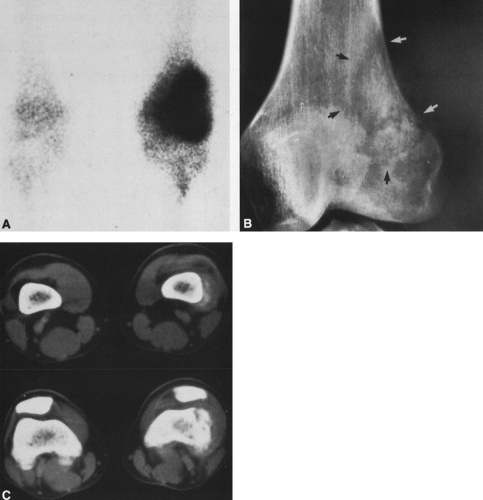 FIG. 4-46. Osteolytic osteosarcoma of the distal femur. A: Bone scan demonstrates a large area of increased radioactivity in the distal femur. B: Anteroposterior radiograph reveals an ill-defined area of destruction in the metaphysis involving both medullary bone and the overlying cortex (arrows). C: Computed tomography shows cortical destruction, possibly osteoid formation, and a surrounding soft-tissue mass. |
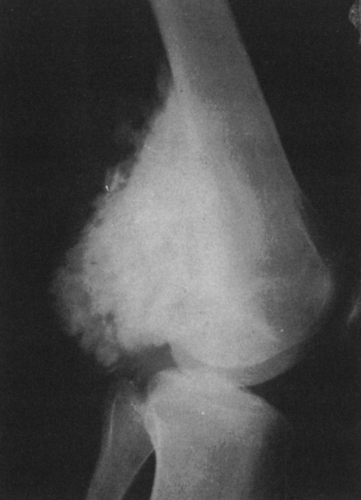 FIG. 4-47. Parosteal osteosarcoma. A large, dense mass protrudes from the posterior aspect of the lower femur. There is no evidence of extension into the intramedullary canal. This is a typical location and appearance for this tumor. |
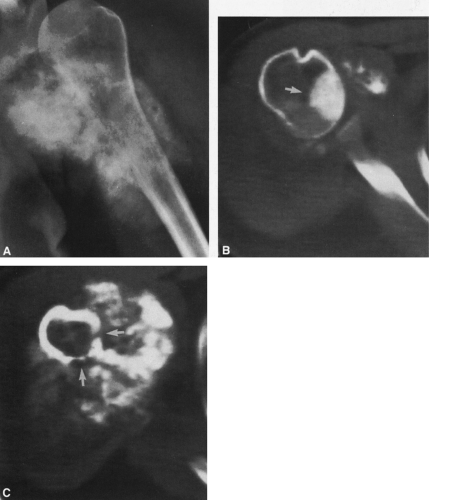 FIG. 4-48. Parosteal osteosarcoma of the proximal humerus. A: Anteroposterior radiograph demonstrates an irregular, cloud-like density typical of osteoid surrounding the proximal humerus. There is no obvious intramedullary extension, nor is there evidence of cortical destruction. B: Proximal computed tomographic (CT) scan demonstrates extension of the disease process into the humeral head (arrow). C: A more inferior CT scan demonstrates areas of cortical destruction (arrows). |
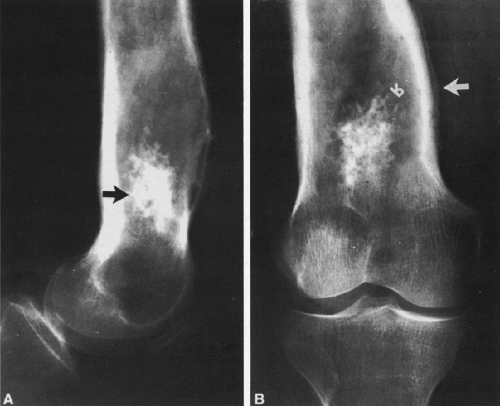 FIG. 4-49. Central chondrosarcoma. This lesion probably developed from an enchondroma in the medullary canal, designated by the arrow in A. Note the expansion and thinning of the cortex, with overlying periosteal new-bone formation designated by the white arrow in B (compare with Fig. 4-7B, benign enchondroma). |
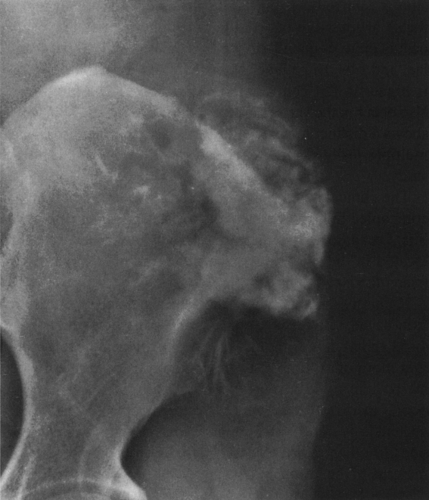 FIG. 4-50. Peripheral chondrosarcoma. This chondrosarcoma is presumed to have arisen from an exostosis of the iliac bone. Note the chondroid calcification. Malignant degeneration is revealed by the presence of the discontiguous calcifications extending into the large soft-tissue mass. |
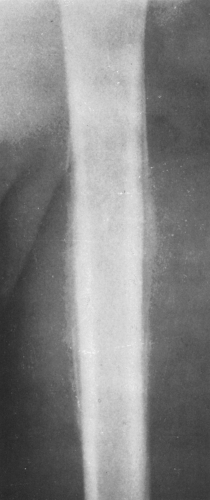 FIG. 4-51. Ewing’s tumor involving the diaphysis of the femur in a young adult. Laminated, onionskin, periosteal new-bone formation extends over a considerable length of the shaft. The medullary destruction is permeative and poorly defined. |
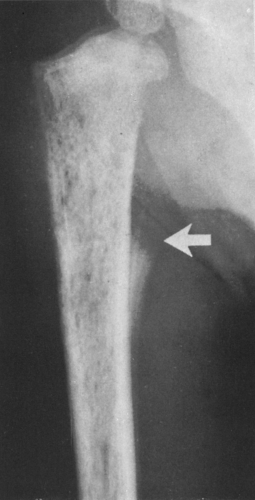 FIG. 4-52. Ewing’s tumor involving the metaphysis and proximal shaft of the humerus. There is a permeative destruction and a well-defined, laminated Codman’s triangle (arrow) at its distal margin. |
Specific Bone
To a lesser extent, the bone in which the tumor is located is also of importance. Some tumors are more likely to arise in a specific bone than in others.11 For instance, the most common site of an osteoblastoma is the posterior elements of the vertebral body, whereas adamantinomas arise in the tibia.
Internal Margins
The internal margin of a lesion relates to the radiographic appearance of the tumor–bone interface, the interface between the tumor and the bone from which it arises.15 This is dependent on the nature of the disturbance of the endosteal surface of the cortex and the pattern of medullary destruction.
Medullary destruction may be geographic, confined to a relatively specific area that is more or less easily defined; moth-eaten, with irregular patches of medullary destruction; or permeative, with rather poorly defined areas of destruction (Fig. 4-2).
The margin of the lesion may be sharply defined by a thin or thick wall of sclerotic bone (Fig. 4-2). Some lesions, although sharply defined, have no reactive bone formation about them and are said to be “punched out.” Others are poorly marginated and less well defined, with the margin of the lesion more or less blending imperceptibly into the surrounding intramedullary bone.
Zone of transition refers to the border between the lesion and normal surrounding bone. Well-defined lesions are said to have a sharp zone of transition, and those that are poorly defined are said to have a broad zone of transition.
The aggressiveness of a bone lesion is manifested radiographically by the tumor–bone interface. Indolent or slow-growing tumors are marginated by sclerotic bone, whereas those with more rapid growth lack a sclerotic margin. Should growth be even more aggressive, the margin becomes progressively less well defined. A rapid growth rate may be encountered in benign as well as malignant lesions, and the opposite is also true—that is, some malignant lesions are slow-growing and have sharply defined margins. Therefore, although the radiographic appearance of the tumor–bone interface indicates the aggressiveness and growth rate of a
bone lesion, the interface does not in and of itself indicate benignancy or malignancy. Eosinophilic granuloma, aneurysmal bone cyst, most giant cell tumors, and chondromyxoid fibroma may have an aggressive radiographic appearance and yet be benign. Conversely, solitary myeloma, adamantinoma, and juxtacortical osteogenic sarcoma are slow growing and radiographically nonaggressive but in fact are malignant.
bone lesion, the interface does not in and of itself indicate benignancy or malignancy. Eosinophilic granuloma, aneurysmal bone cyst, most giant cell tumors, and chondromyxoid fibroma may have an aggressive radiographic appearance and yet be benign. Conversely, solitary myeloma, adamantinoma, and juxtacortical osteogenic sarcoma are slow growing and radiographically nonaggressive but in fact are malignant.
A lesion may affect the cortex in several ways (Fig. 4-3). It may expand the cortex outward, distorting the normal outline of the bone with the cortex remaining intact; this type of lesion is said to be expansile or ballooned. It may erode and scallop the endosteal surface, referred to as endosteal scalloping. Some lesions have an invisible peripheral margin of cortical bone. In these, the peripheral margin is so fine that it cannot be identified on a plain film but may be visualized by tomography or CT. This is characteristic of aneurysmal bone cyst, chondromyxoid fibroma, and eosinophilic granuloma, particularly in a young child. Malignant tumors and infections lead to cortical destruction manifested by an irregular loss of cortical bone. Lesions arising in the periosteum or adjacent to the cortex cause a shallow erosion of the external surface of the cortex, referred to as saucerization. However, saucerization may also occur in Ewing’s tumor and periosteal osteosarcoma.
The lesion may be further characterized by the presence or absence of septation (Fig. 4-4). Certain lesions either are or appear to be divided by thin walls or septa of cortical bone. A lesion without any evidence of internal septa is said to be nonseptated. This is characteristic of a unicameral bone cyst. Other lesions appear to contain multiple septa and are said to be multiseptated. In some, this is because true septa extend throughout the lesion; in others, the septation is actually caused by an erosion or scalloping of the endosteal surface, with the ridges of bone between the scallops giving the false appearance of septa when viewed radiographically.
Periosteal New-Bone Formation
The presence and character of periosteal new-bone formation or periosteal reaction lend important clues to the nature of an underlying lesion (Fig. 4-5).
A single layer of periosteal reaction (lamellar) is a faint, radiodense line of 1 to 2 mm width paralleling the cortical surface. This is a hallmark of a benign process; it is usually seen in acute osteomyelitis and is rarely encountered in neoplasms.
Solid or wavy periosteal reaction is a solid reaction with an undulant outer margin. This is typical of long-standing peripheral vascular disease (varicosities) of the lower extremities and pulmonary osteoarthropathy.
Solid, compact, or thick periosteal reaction represents multiple successive layers of new bone applied to the cortex overlying a lesion. This may also be referred to as cortical thickening or hyperostosis. It is encountered in osteoid osteomas, chronic osteomyelitis, eosinophilic granulomas, and central chondrosarcomas of long bones.
A combination of lamellar and nodular periosteal reaction is typical of a benign process and is often associated with cortical bone abscess.
Layered or laminated periosteal reaction created by several parallel concentric layers or lamellae of periosteal new bone is often referred to as “onionskin” reaction. It implies a more aggressive process but is encountered in both benign and malignant disease. It is most characteristic of Ewing’s
tumor (Ewing’s sarcoma) but may be found in osteosarcoma, acute osteomyelitis, stress fractures, and eosinophilic granuloma in very young patients.
tumor (Ewing’s sarcoma) but may be found in osteosarcoma, acute osteomyelitis, stress fractures, and eosinophilic granuloma in very young patients.
Uniform, fine, parallel linear shadows oriented perpendicular to the cortex form the “hair-on-end” pattern, characteristic of Ewing’s tumor. A “sunburst” or divergent periosteal reaction is characteristic of osteosarcoma. The spicules of bone are more irregular and coarser than those encountered in the hair-on-end pattern. Periosteal reaction that is irregular and otherwise unclassifiable is typical of bone sarcoma and is often encountered in osteosarcoma.
Periosteal new-bone formation may be interrupted or may incompletely cover the surface of a lesion, as is often the case with osteosarcomas. A triangle consisting of several layers of periosteal reaction may form at the margin of the lesion. This is known as Codman’s triangle. Codman’s triangle was at one time thought to be pathognomonic of bone sarcomas, but it is also encountered in osteomyelitis. The triangle is composed entirely of periosteal reaction and is usually free of tumor; therefore, it should be avoided as a site for biopsy.
Periosteal new-bone formation associated with slow-growing lesions may result in a somewhat similar triangle of more compact and sometimes solid bone at the margin of the lesion. This is known as a buttress and is characteristic of benign lesions. Buttress formation is often associated with those lesions that have an invisible cortical margin, such as aneurysmal bone cyst, chondromyxoid fibroma (see Fig. 4-11), and eosinophilic granuloma in young patients.
Tumor Bone Formation (Matrix Calcification)
Calcification occurring within the matrix of a tumor, particularly osteoid and chondroid tumors, occurs in patterns that are characteristic23 of the tissue of origin (Fig. 4-6).
Calcification of osteoid characteristically creates a cloud-like, amorphous, homogenous opacity (see Figs. 4-44 and 4-45). On the radiograph, it appears as if painted or “chalked in” in white.
Calcific densities characteristic of chondroid matrix in small tumors are stippled or punctate, whereas in larger tumors nodules, flocculent (popcorn-like) rings, and arcs of calcific density are noted (Figs. 4-7, 4-8, and 4-9).
Reactive new bone forms in some tumors and at the margins of infections. The new bone forms on existing normal trabeculae at the borders of chronic bone abscesses and in the presence of certain malignant cells, particularly metastatic malignancies of the breast and lung (see Figs. 4-33 and 4-34). The osteoblastic response in these tumors is caused not by ossification of the tumor but by reactive new-bone formation surrounding the tumor. Reactive new bone is characteristically homogenous and amorphous.
IMAGING TECHNIQUES IN BONE TUMORS
Tomography
Tomography is used to augment the plain film and provides useful information in selected cases. It more clearly delineates and defines the lesion than plain films and may be helpful in the demonstration of matrix calcification and cortical destruction.
Computed Tomography
In most cases, CT adds little to the specific histologic diagnosis of a bone tumor beyond plain radiography, but it does give a better indication of the extent of the lesion, both within the intramedullary canal and in surrounding soft tissues, and its relationship to adjacent vascular structures (see Fig. 4-43)20. Both bone and soft-tissue windows demonstrate the extent of cortical destruction, but soft-tissue windows better demonstrate the extent of soft-tissue disease and involvement of the marrow. The normal marrow is of fat density and usually −20 to −40 Hounsfield units. When tumor involves the marrow, its density is increased to that of soft tissue, well into the positive range. Because CT is more sensitive than plain films, CT can delineate lesions indicated by a positive bone scan but inapparent on a radiograph (see Figs. 4-27 and 4-28). This is particularly helpful in the disclosure of metastatic lesions in the spine and pelvis and, less commonly, in the peripheral skeleton. CT can also
identify fine bony margins of a lesion that are inapparent on plain films (see Fig. 4-20). CT displays calcified and bony matrix within lesions much better than MRI.
identify fine bony margins of a lesion that are inapparent on plain films (see Fig. 4-20). CT displays calcified and bony matrix within lesions much better than MRI.
Magnetic Resonance Imaging
MRI demonstrates the extent of soft-tissue and marrow involvement and also defines the relationship of the tumor to the surrounding vessels18,20,21. The direct sagittal and coronal images of MRI permit a more accurate assessment of the relationship of the tumor to adjacent normal structures along the longitudinal axis of the bone, particularly the neurovascular structures, spinal cord, joints, and physis7,14,19.
Most malignant bone tumors are inhomogeneous on both T1- and T2-weighted images. The degree of inhomogeneity varies with the type of tumor matrix and the extent of hemorrhage and necrosis. T1-weighted images are best for determining the extent of marrow involvement (see Fig. 4-45B), and T2 images are more useful for evaluating cortical bone destruction and soft-tissue extension (see Fig. 4-45C). MRI is not as useful in the evaluation of cortical bone because of the absence of signal. Matrix and marginal calcification and subtle cortical changes may be more obvious on CT. The hydrogen content of cortical bone is very low and therefore gives no signal on MRI, whereas the fat in marrow contains a high hydrogen content and gives a pronounced signal on T1-weighted images. The replacement of marrow fat by tumor, infection, or hemorrhage reduces the strength of the signal. MRI affords superior soft-tissue contrast, allowing better delineation and differentiation of soft tissues than is possible by CT (see Fig. 4-45). For these reasons, MRI has largely replaced CT in the evaluation of bone and soft-tissue tumors.
Related posts:
Stay updated, free articles. Join our Telegram channel

Full access? Get Clinical Tree


