Brain Perfusion Imaging with SPECT and PET
Heidi Wassef, MD
▪ Introduction
Changes in cerebral blood flow (CBF) often precede anatomic changes. Therefore, evaluation of brain perfusion allows earlier diagnosis of many diseases compared to the evaluation of anatomy alone. Single photon emission computed tomography (SPECT) and PET can provide qualitative and quantitative perfusion data. The role of SPECT and PET in the diagnosis of chronic vascular disease, traumatic brain injury (TBI), dementia, and epilepsy is discussed in this chapter. These studies can also provide prognostic information that aids in the management of patients with cerebrovascular disease1,2 and 3 or head trauma. Brain SPECT with an acetazolamide challenge allows for the evaluation of cerebrovascular reserve and with balloon occlusion allows prediction of neurologic sequelae after carotid artery sacrifice. Finally, brain perfusion may confirm the clinical diagnosis of brain death.
▪ Radiopharmaceuticals for Brain SPECT
The ideal radiopharmaceutical for the evaluation of CBF would cross the blood-brain barrier (BBB), distribute according to blood flow, and remain there sufficiently long to allow for imaging. 99mTcethyl cysteine dimer (ECD, Neurolite) and Technetium 99mTc-exametazime (HMPAO, Ceretec) are lipophilic, cross the BBB, and are the most commonly used brain SPECT radiopharmaceuticals. The radioisotope, 99mTc, has the advantage of optimal keV and half-life. 99mTc-HMPAO becomes hydrophilic upon crossing the BBB and is then trapped in the brain. Maximal brain uptake is achieved by 20 seconds and represents 5% of injected dose.4,5 HMPAO has stable binding in vivo and prolonged retention in the brain. The latter allows for SPECT in addition to planar imaging. 99mTc-HMPAO can be imaged 30 to 90 minutes after injection.5 The ECD brain uptake is 6% of the injected dose. The advantages of ECD are in vitro stability for 6 hours, faster clearance from the blood, higher target-to-nontarget ratio, earlier imaging after intravenous injection, and better-quality SPECT brain images. 99mTc-ECD is imaged 30 to 60 minutes after injection.5 The gray-to-white matter uptake is 4.5:1 for 99mTc-ECD versus 1.6:1 for 99mTc-HMPAO. Thus, the gray-to-white matter contrast is greater with 99mTc-ECD. Although washout is minimal, the disadvantage of ECD is significant regional brain variation in clearance.6 The brain clearance is biexponential.
Typical doses of HMPAO and ECD are 10 to 20 mCi (370 to 740 MBq), and the effective doses are similar.5 Table 17.1 compares HMPAO and ECD. If patients are imaged in the subacute phase (1 to 4 weeks after symptoms of stroke) at which time CBF and metabolism are uncoupled, 99mTc-ECD is preferred since it is reported to show absence of CBF at the site of “luxury perfusion” unlike 99mTc-HMPAO.7 The phenomenon of “luxury perfusion” describes the postischemic return of CBF to normal or sometimes elevated levels compared to the metabolic requirement.
Technique
Brain SPECT involves the injection of a radiopharmaceutical that distributes in the brain according to CBF. For indications other than evaluation of suspected brain death, patients should abstain from large amounts of stimulants such as caffeine, alcohol, smoking, and other drugs that may affect cerebral perfusion. To avoid excessive sensory stimulation near the time of radiopharmaceutical injection, instructions should be given early and the intravenous cannula placed approximately 15 minutes prior to the injection.5 The patient should be injected in a quiet room with minimal stimuli. The patient should void prior to the scan. Patient comfort is critical to ensure that the patient will not move during the approximately 20 minutes required for scanning. The angiographic phase and planar anterior and lateral images are performed if the indication is suspected brain death. Dynamic images during the angiographic phase and SPECT images of the brain are obtained for most other indications. A low-energy, highor ultra-high-resolution collimator with a dual-head camera with 180-degree rotation with step-and-shoot mode and a matrix of 128 × 128 or higher is used. Dedicated brain cameras allow proximity to the head and facilitate less scatter and improved sensitivity and spatial resolution. Unprocessed data should be checked for motion or other artifacts prior to iterative reconstruction and the application of a low-pass filter. CT attenuation correction is superior to Chang attenuation correction.8 Images are reformatted to three orthogonal planes.5 With typically used techniques, HMPAO and ECD do not provide quantitative blood flow measurements. Quantitation would require an indwelling arterial line although alternative methods using the time-activity curves of the aorta or carotid artery and brain also exist.9,10,11 and 12
This method will be explained in more detail in the section on PET quantitation. In most clinical settings, relative regional blood flow data are obtained by comparing the counts to the contralateral brain counts. In some cases, the assumption that the contralateral brain has normal CBF can be made. Semiquantitative blood flow can also be obtained by comparing the cortical CBF to that of the cerebellum. The cerebellum has greater flow than the cerebral cortex and basal ganglia. Normal rCBF to the cortex or basal ganglia is greater than or equal to 70% of cerebellar flow and to the medial temporal cortex is greater than or equal to 50% of cerebellar flow. In acute cerebrovascular disease, SPECT can provide information on complications, outcome, and treatment. SPECT can also detect hypoperfusion due to vasospasm following subarachnoid hemorrhage and can predict severity of future neurologic sequelae.13 An advantage of SPECT radiopharmaceuticals is the rapid uptake and prolonged retention in the brain, which allows injection during a seizure or other acute event and delayed imaging after the stabilization of the patient. The disadvantage is that the prepared radiopharmaceutical and a technologist need to be available at all times.
TABLE 17.1 SPECT Cerebral Blood Flow Radiopharmaceuticals | |||||||||||||||||||||||||||
|---|---|---|---|---|---|---|---|---|---|---|---|---|---|---|---|---|---|---|---|---|---|---|---|---|---|---|---|
| |||||||||||||||||||||||||||
▪ Brain Positron Emission Tomography Radiopharmaceuticals
Unlike SPECT tracers that emit gamma rays, PET tracers emit positrons. The PET tracers most commonly used for the measurement of CBF are 15O2, C15O2, and H215O. These radiopharmaceuticals are produced in a cyclotron. Their very short half-life limits their usage to centers that have an onsite cyclotron. The halflives of 15O, 13N, and 11C are 2, 10, and 20 minutes, respectively.14 Extensive research with these radiopharmaceuticals has provided a wealth of information about cerebral hemodynamics and function. 18F-fluorodeoxyglucose (FDG) can provide cerebral metabolic information. Its 110-minute half-life allows sufficient time for delivery of the tracer to most imaging centers. For this reason, FDG PET has gained widespread clinical appeal. PET spatial resolution is 4 to 6 mm.14
Technique
Patients fast for 4 to 6 hours, and the blood glucose levels are checked prior to FDG administration to confirm that they are not elevated. Excessive stimulation is to be avoided following tracer injection and thus it is recommended that the cannula for intravenous administration be placed 10 minutes or more before tracer injection. The patient is injected with 5 to 20 mCi (185 to 740 MBq) in a dimly lit room, and the patient is instructed to rest comfortably and not to speak, read, or do other activities. If an FDG study is performed for evaluation of epilepsy, EEG monitoring is necessary prior to and at least 20 minutes after injection. EEG leads are removed prior to image acquisition since most will cause attenuation artifacts. Imaging is performed 30 to 60 minutes following injection. Most current scanners are hybrid PET-computed tomography (CT). CT provides attenuation correction data for PET as well as anatomic correlation of the PET functional data. Basal ganglia, hippocampal area, thalami, cerebellum, posterior cingulate gyrus, and visual cortex are relatively metabolically stable with advancing age. Decreased cortical metabolism, especially in the frontal lobes, is reported with normal aging.15
Better image quality is possible with longer 18F-FDG imaging time (15 to 30 minutes) compared to shorter 15O-H2O imaging time (1 to 2 minutes). The longer imaging time is possible because the 18F-FDG half-life is 110 minutes compared to 2 minutes for 15O-water. On the other hand, the advantage of the shorter 15O-H2O half-life is that the study can be repeated immediately.
PET Quantitation
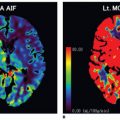
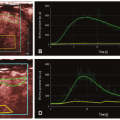
The various PET radiopharmaceuticals can provide hemodynamic (rCBF, oxygen extraction fraction [OEF], and regional cerebral metabolic rate of oxygen [rCMRO2]), metabolic, cell proliferation, or neurotransmission data. PET regional CBF (rCBF) quantitation with 15O-H2O PET water is regarded as the gold standard.16 Quantification of rCBF from 15O-H2O PET requires the knowledge of the arterial input function (AIF) into the brain typically acquired by arterial blood sampling. PET can also provide quantification of the OEF and rCMRO2.17 Due to the invasive nature of arterial sampling, research has focused on image-derived input function (IDIF). An example of this IDIF uses the common carotid arteries that can be localized by coregistered MRI.16 This is the same technique that can be used with SPECT as was shown in Figure 17.1. A region of interest (ROI) has been drawn over the common carotid arteries and used as an IDIF. Comparison of right and left hemisphere ROI time activity curves demonstrate relative perfusion differences. Deconvolution of the perfusion curves with the AIF can give an estimate of absolute perfusion.
PET can provide semiquantitative regional metabolic data. The brain depends almost exclusively on glucose metabolism. Unlike other organs, the brain cannot store oxygen or glucose, and rCBF is continuously changing to meet the changing metabolic demands. Thus, in most cases, regional metabolism correlates with rCBF. Standard uptake value is a semiquantitative parameter used in 18F-FDG PET.
 Figure 17-1. 99mTc-exametazime cerebral perfusion images in a 34-year-old unresponsive man. There is markedly decreased perfusion to the right cerebral hemisphere (A). On the lateral views, note the apparent decreased flow to the left cerebellum (white arrow) with preserved right cerebellar activity (green arrow) demonstrating crossed cerebellar diaschisis on the delayed images. The measurable perfusion data include an estimate of the arterial input function (AIF) from the carotid regions of interest (ROI) in red (B). Comparison of right (blue) and left hemisphere (yellow) ROI time-activity curves demonstrates relative perfusion differences. Deconvolution of the perfusion curves with the AIF can give an estimate of absolute perfusion. Images Courtesy of Patrick Colletti, M.D. |
▪ Pearls and Pitfalls
There are several differences between SPECT and PET to be noted. In general, the severity of hypometabolism seen on PET is greater than the severity of hypoperfusion on SPECT. Cerebellar metabolism is less than cortical metabolism in 18F-FDG PET unlike SPECT (or 15O-H2O PET) where cerebellar blood flow is greater than CBF.18 Cerebellar metabolism is approximately 85% of cortical metabolism while cortical blood flow is equal to or greater than 70% of cerebellar blood flow. Correlation with CT and/or MRI is essential to assess age-related and focal cerebral volume loss.18 This will help avoid misinterpreting focal or global cerebral volume loss as hypometabolism or hypoperfusion.18,19
▪ Clinical Applications
Acute Stroke
SPECT can help determine which patients with symptoms of acute stroke may benefit from thrombolysis to limit neurologic sequela and which patients are at high risk for hemorrhage. If initial CT excludes hemorrhage in a patient with symptoms of acute stroke, the next consideration is whether thrombolysis might be necessary. Pretherapy semiquantitative SPECT provides important information that helps select the patients who would benefit from thrombolysis.2 A retrospective study of 30 patients who had SPECT prior to endovascular thrombolysis revealed that ischemic tissue with CBF greater than 55% of cerebellar blood flow can be spared with thrombolysis even if administered more than 6 hours after the onset of symptoms and tissue with CBF greater than 35% of cerebellar flow can be spared with thrombolysis within 5 hours. Ischemic tissue with CBF less than 35% of cerebellar flow is at risk for hemorrhage despite prompt initiation of thrombolysis.2
Not only does CBF information help determine patient management, but it also provides prognostic information as listed in Table 17.2. Severe hypoperfusion in the first 6 hours after symptom onset is highly correlated with poor neurologic outcome.
Related posts:
 Vascular Anatomy and Microanatomy
 CT and MR Contrast-Enhanced Tissue Perfusion Imaging: Basic Methodology, Postprocessing, Reliability Testing
 Myocardial Perfusion Imaging: MR Techniques
 Myocardial Perfusion Imaging with PET/SPECT: Techniques and Clinical Applications
 Ultrasound Perfusion Imaging: Techniques and Analytical Methods
 Contrast-Enhanced Ultrasound: Clinical Applications
Stay updated, free articles. Join our Telegram channel

Full access? Get Clinical Tree


